AN ATMOSPHERIC MODELLING SYSTEM
FOR LEBANON
Division of Models and Technologies for Risks Reduction Bologna Research Centre L. CIANCARELLA, M. D’ISIDORO, A. PIERSANTI Territorial and Production Systems Sustainability Department Atmospheric Pollution Laboratory Atmospheric Pollution Laboratory Bologna Research Centre
Atmospheric Pollution Laboratory Pisa Centre
I. D’ELIA
Territorial and Production Systems Sustainability Department Atmospheric Pollution Laboratory
Atmospheric Pollution Laboratory Rome Headquarters
RT/2016/9/ENEA
ITALIAN NATIONAL AGENCY FOR NEW TECHNOLOGIES, ENERGY AND SUSTAINABLE ECONOMIC DEVELOPMENT
G. ZANINI, G. RIGHINI
Territorial and Production Systems Sustainability Department Division of Models and Technologies for Risks Reduction Bologna Research Centre
L. CIANCARELLA, M. D’ISIDORO, A. PIERSANTI
Territorial and Production Systems Sustainability Department Atmospheric Pollution Laboratory Bologna Research Centre
AN ATMOSPHERIC MODELLING SYSTEM
FOR LEBANON
G. BRIGANTI, A. CAPPELLETTI
Territorial and Production Systems Sustainability Department Atmospheric Pollution Laboratory
Pisa Centre
I. D’ELIA
Territorial and Production Systems Sustainability Department Atmospheric Pollution Laboratory
Rome Headquarters
RT/2016/9/ENEA
ITALIAN NATIONAL AGENCY FOR NEW TECHNOLOGIES, ENERGY AND SUSTAINABLE ECONOMIC DEVELOPMENT
I rapporti tecnici sono scaricabili in formato pdf dal sito web ENEA alla pagina http://www.enea.it/it/produzione-scientifica/rapporti-tecnici
I contenuti tecnico-scientifici dei rapporti tecnici dell’ENEA rispecchiano l’opinione degli autori e non necessariamente quella dell’Agenzia
The technical and scientific contents of these reports express the opinion of the authors but not necessarily the opinion of ENEA.
Il presente studio è stato svolto dal Laboratorio di Qualità dell’Aria dell’ENEA nell’ambito delle attività previste di una Convenzione annuale stipulata da ENEA nel 2013 con il Ministero degli Affari Esteri e della Cooperazione Internazionale (MAECI) per assistenza tecnico-scientifica al Ministry of Environment Libanese, CUP: I36D12000050005. Si ringraziano molto per la collaborazione:
Annamaria Meligrana e Guglielmo Giordano del MAECI a Roma, Dietmar Ueberbacher del MAECI con ufficio a Beirut, Rola El Sheikh del UNDP- Lebanese Petroleum Administration, Nour Masri del Lebanese Ministry of Environment a Beirut e Charbel Afif della University Saint Joseph a Beirut.
Le risorse di calcolo e il relativo supporto tecnico per questo lavoro sono state fornite dall’infrastruttura di calcolo ad alte prestazioni CRESCO/ENEAGRID e dal suo staff, vedere http://www.cresco.enea.it per informazioni.
L’infrastruttura di calcolo ad alte prestazioni CRESCO/ENEAGRID è finanziata da ENEA,
l’Agenzia Nazionale per le Nuove Tecnologie, l’Energia e lo Sviluppo Economico Sostenibile e da programmi di ricerca nazionali e europei.
ACKNOWLEDGMENTS
This work was part of a technical assistance provided in 2013 by the air quality laboratory of ENEA in the framework of a collaboration agreement with the Italian Ministry of Foreign Affairs and
International Cooperation (MAECI) to the Lebanese Ministry of Environment. The authors warmly thank the following people for their support: Annamaria Meligrana and Guglielmo Giordano of MAECI in Rome, Dietmar Ueberbacher of MAECI in Beirut, Rola El Sheik of UNDP- Lebanese
Petroleum Administration, Nour Masri of Lebanese Ministry of Environment in Beirut and Charbel Afif of University Saint Joseph in Beirut.
The computing resources and the related technical support used for this work have been provided by CRESCO/ENEAGRID High Performance Computing infrastructure and its staff; see
http://www.cresco.enea.it for information. CRESCO/ENEAGRID High Performance Computing infrastructure is funded by ENEA, the Italian National Agency for New Technologies, Energy and Sustainable Economic Development and by national and European research programs.
AN ATMOSPHERIC MODELLING SYSTEM FOR LEBANON
G. Zanini, G. Briganti, A. Cappelletti, L. Ciancarella, I. D’elia, M. D’isidoro, A. Piersanti, G. Righini Abstract
The development and application of a dedicated atmospheric modelling system (AMS) on the terri-tory of Lebanon is here described as part of technical assistance provided by ENEA to the Lebanese Ministry of Environment during 2013 and 2014.
AMS-Lebanon aims to provide a reference modelling tool for air quality policy in Lebanon, allowing to investigate hypotheses on air quality management in a quick and cost-effective way.
The modelling system is derived from ENEA’s experience in the MINNI project, supporting to the Italian Ministry of Environment for national air pollution policies, and in research exercises involving model intercomparisons at European scale.
The modelling chain connects a mesoscale meteorological model (RAMS), an emission inventory processor (EMMA) and a Chemical Transport Model (FARM). Three dimensional concentrations of atmospheric pollutants (NO2, O3, PM10, PM2.5, SO2) are calculated keeping into account atmo-spheric dynamics and chemical reactions among gas and particulate species, on a 5 km horizontal resolution grid covering Lebanon.
The Atmospheric Emission Inventory of Anthropogenic Sources for Lebanon, compiled by CEREA (France) and University of Saint Joseph (Lebanon), was adapted to AMS Lebanon and integrated with new information on large point sources and dedicated simulation of biogenic VOC emissions. The maps of average annual concentrations for NO2, O3, PM10, PM2.5 and SO2 show the distribution of atmospheric pollution all over the study domain and point out the hot-spots of ex-ceedances of EU limit values, taken as reference.
The system has been tested on a base case, represented by the 2010 emission inventory of Leba-non, and two scenarios: new emission limit values for cement industries and new functional layouts for the power plants in Zouk and Jyeh.
The setup of the AMS modelling system over Lebanon provided a comprehensive picture of the most polluted areas of the country, where mitigation measures are more urgent, development plans have to be reconsidered or more stringent emission limit values have to be applied.
The concentration values can serve as the base case for environmental impact assessments studies and for new activities proposed with atmospheric impact.
Moreover the modelling system is able to provide responses on effectiveness of new emissions scenarios, like changes of Emission Limit Values for the various sources, planned power plants transformation, future offshore drilling activities.
Viene qui descritto lo sviluppo e l’applicazione di un sistema modellistico atmosferico messo a punto per il territorio del Libano (AMS-Libano) nell’ambito dell’assistenza tecnica fornita da ENEA al Ministero dell’Ambiente Libanese tra il 2013 ed il 2014. AMS-Libano rappresenta uno strumento modellistico di riferimento per le politiche di qualità dell’aria in Libano, permettendo di approfon-dire ipotesi di gestione della qualità dell’aria in maniera efficace ed economica. Il sistema modelli-stico nasce dall’esperienza di ENEA nel progetto MINNI in supporto al Ministero Italiano
dell’Ambiente e della Tutela del Territorio e del Mare sulle politiche nazionali di qualità dell’aria e nell’ambito di esperienze di ricerca su confronti di modelli a livello Europeo.
La catena modellistica unisce un modello meteorologico di mesoscala (RAMS), un elaboratore di in-ventari di emissioni (EMMA) e un modello di trasporto e chimica in atmosfera (FARM).
Le concentrazioni tridimensionali di inquinanti atmosferici (NO2, O3, PM10, PM2.5, SO2) sono cal-colate considerando le dinamiche dell’atmosfera e le reazioni chimiche fra gas e la speciazione del particolato con una risoluzione spaziale di 5 Km sul Libano. L’inventario atmosferico delle emissioni di sorgenti antropogeniche per il Libano, compilato dal CEREA (Francia) e dall’Università Saint Jo-seph (Libano), è stato adattato per AMS-Libano e integrato con nuove informazioni su grandi sor-genti puntuali e simulazioni specifiche di emissioni biogeniche.
La mappe delle concentrazioni medie annuali di NO2, O3, PM10, PM2.5 e SO2 mostrano la
distribuzione dell’inquinamento atmosferico su tutto il dominio di studio ed evidenziano situazioni di superamento dei limiti in vigore nell’Unione Europea, considerati come riferimento. Il sistema è stato testato su un caso di base rappresentato dalle emissioni del 2010, e su due scenari emissivi: nuovi liniti ai valori emissivi per i cementifici e nuove configurazioni funzionali per le centrali elettriche situate a Zouk e Jyeh.
La messa a punto di un sistema modellistico atmosferico per il Libano ha fornito un quadro com-pleto delle aree più inquinante della regione dove le misure di mitigazione appaiono più urgenti, i piani di sviluppo devono essere rivisti o devono essere applicati valori limite delle emissioni più stringenti. I valori di concentrazione forniscono anche un caso base per gli studi di valutazione di impatto ambientale e per la proposta di nuove attività con impatto in atmosfera.
Inoltre il sistema modellistico è in grado di valutare l’efficacia di nuovi scenari di emissione, dati per esempio dal cambiamento di valori limite di emissioni delle diverse sorgenti, dalla trasformazioni pianificate di alcune centrali o da future attività estrattive off-shore.
5
INDEX
1 INTRODUCTION ... 6
2 THE MODELLING SYSTEM: AMS-LEBANON ... 7
3 BASELINE MODEL ASSESSMENT – LH0 ... 9
3.1 Meteorology ... 9
3.2 Emissions ... 10
3.2.1 Anthropogenic emissions: USJ inventory and point sources integration ... 10
3.2.2 Biogenic emissions ... 12
3.2.3 Foreign emissions ... 13
3.3 Concentrations ... 14
4 EMISSIONS SCENARIOS ... 17
4.1 LH1: new ELV on cement production, Zouk and Jyeh power plants fueled with oil ... 20
4.2 LH2: new ELV on cement production, Zouk and Jyeh power plants fueled with gas ... 23
5 CONCLUSIONS ... 26
6
1 INTRODUCTION
Air pollution modelling has been imposing more and more as a technique for addressing air quality policy for the last fifteen years. Atmospheric pollution models represent a mathematical description of reality, therefore suffer from inherent uncertainties and approximations and need a solid validation (Mircea et al. 2014, Baldasano et al 2011, Chemel et al 2010). However, they are a sort of "laboratory", the only possible in this context, where to find connections among emissions (anthropogenic and natural), weather conditions, characteristics of the territory, chemical and physical transformations of gases and particulates with concentrations and depositions.
Simple models describe a linear relation between source emission and concentration but this is not true in most of the cases. Fine particles and photochemical pollutants like ozone have a secondary nature that is the product of complex chemical reactions among primary pollutants in the atmosphere. Three dimensional chemical transport models (CTMs) represent an extraordinary tool supporting decisions on air quality policy. Indeed in Europe CTMs are currently used and routinely run in Member States to support European Union policies on air pollution according to specific laws and recommendations (i.e. Directive 2008/50/EC (EC, 2008)). On the contrary, the implementation of these models in Developing Countries is still challenging mainly due to the lack of resources, driving regulations and official mandates.
Lebanon, a Middle-Eastern country located on the Mediterranean basin, has been experiencing in the last decades severe air pollution episodes, due to growing population and urbanization, the absence of efficient public transport, and specific climatic conditions. In order to identify local anthropogenic sources with high emissions and assess their impact on population, a preliminary air quality monitoring program, performed by the Lebanese National Council for Scientific Research (CNRS) and faculty members from American University in Beirut and Saint Joseph University, was established since 2003 to provide data on ambient air quality in greater Beirut area. Only recently researchers started also to explore the capabilities of CTMs over the whole Lebanon (Waked et al. 2013). In this framework, the Italian Ministry of Foreign Affairs, under the General Directorate of Cooperation for Development, supported the Lebanese Ministry of Environment (MoE) by means of a technical assistance on air quality concerns provided by ENEA in 2013 and 2014.
Actually, this report describes the part of this technical assistance related to the development and application of a dedicated atmospheric modelling system, developed by ENEA, on the Lebanese territory. The system ran a base case, represented by 2010 emission inventory (provided by the Saint Joseph University) with meteorology of 2011, and two scenario: new ELVs for cement industries and new plans for the power plants in Zouk and Jyeh.
Given the same meteorology, differences in concentrations values between the base case and the case study show the positive or negative impact on air quality of the decisions.
7
2 THE MODELLING SYSTEM: AMS-LEBANON
The Atmospheric Modelling System of Lebanon (AMS-Lebanon) is composed of the following main components: the mesoscale meteorological model RAMS (Regional Atmospheric Modelling System, Cotton et al., 2003), the emission processor EMMA (EMission MAnager; ARIA/ARIANET, 2008) and the CTM (Chemistry Transport Model) FARM (Flexible Air Quality Regional Model; Silibello et al., 2008, Gariazzo et al., 2007). The modelling system is derived from the AMS of the MINNI project (Mircea et al., 2014; www.minni.org/en), routinely adopted over the Italian domain in support to the Italian Ministry of Environment for air pollution policies. The same system has been adopted in research exercises involving model intercomparisons at the European scale.
AMS is a modelling chain where RAMS simulations provide 3D input fields of temperature, humidity, pressure and wind to FARM, which is devoted to compute air concentrations of several gaseous and particle pollutants. Also turbulence related parameters, produced by a pre-processor starting from meteorological fields, are needed in input. Finally, the EMMA tool provides, starting from an emission inventory, the hourly emissions (areal and point sources) over the model grid speciated for the FARM chemical mechanism. Other data needed to perform air quality simulations are the soil description, orography and 3D initial and boundary conditions of concentrations. A detailed scheme of the AMS model is depicted in Figure 1.
FIGURE 1.SCHEMATIC REPRESENTATION OF THE FARM AIR QUALITY MODEL.
Over Lebanon, the AMS has been implemented on a target domain covering the country, using a 5km horizontal resolution grid, and on the year 2011 at hourly resolution.
8
The meteorological fields were produced by RAMS nesting an enlarged domain (2-way) at 15km horizontal resolution over the target domain at 5km resolution (see Figure 2), but with a vertical grids using 32 levels up to about 18km height above the ground. Initial and 6-hourly boundary conditions for meteorology were provided by the European Centre for Medium-range Weather Forecasts (ECMWF).
FARM was operated only over the target domain, as no suitable emission inventory is available at that resolution over the outer domain. The 5km grid had 16 vertical levels from 20m to 10000m above the ground. Initial and 3-hourly boundary concentration fields in input were extracted from MACC-IFS-MOZART (for chemical gaseous species) and MACC-IFS (for aerosols) reanalysis archives (global air quality services, http://www.gmes-atmosphere.eu/). The SAPRC-99 (gaseous species) and AERO3 (aerosols) chemical mechanisms were adopted in this configuration. Hourly emissions where provided by EMMA, starting from the USJ 5km gridded emission inventory over Lebanon, described in the following Chapter.
Orography is provided by RAMS at a resolution of 30 arc-seconds (about 1km), while land use data were extracted from the USGS Biosphere Atmosphere Transfer Scheme (BATS) database, at 30 arc-seconds (http://edc2.usgs.gov/glcc/globdoc2_0.php).
FIGURE 2.DOMAINS USED FOR YEAR 2011 SIMULATIONS.IN BLACK: THE TARGET DOMAIN AT 5KM HORIZONTAL RESOLUTION OVER
9
3 BASELINE MODEL ASSESSMENT – LH0
In the present chapter, we present the baseline case of the model implementation, conventionally named LH0. The model system input (anthropogenic and biogenic emissions, meteorology) is described, then model concentrations in output are presented.
3.1 Meteorology
Some results from the meteorological simulations conducted for 2011 are here shown. The modelling setup has been described in the previous Section. Hourly 3-dimensional data of temperature, pressure, wind and relative humidity were produced in output by RAMS to be subsequently used in FARM.
Yearly modelling was carried out dividing the period in 10 days simulations (day0 to day10): every ten days RAMS was re-initialized on the basis of ECMWF analyses and surface observations (assimilation of SYNOP and METAR surface data was performed over ECMWF fields) to avoid shortcomings due to possible errors growth with simulation time. A 12 hours spin-up period was applied after every re-initialization, so that in practice every simulation started at day0 -12h, ending at day10.
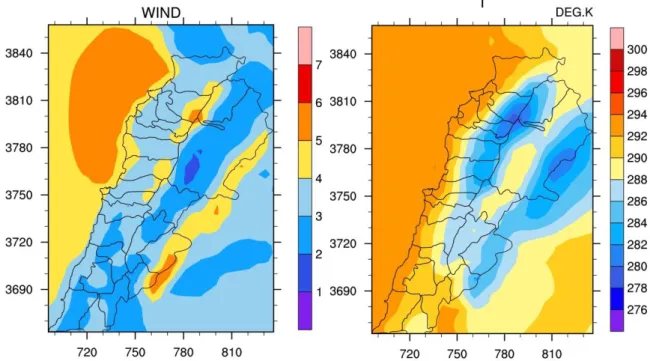
Figure 3 shows the annual average temperature (left panel) and wind speed (right panel) at the lowest model level (approx. 20m above the ground) for the 5km resolution grid over the target domain. Averaged wind is stronger over mountains and sea, including part of central and northern coastal areas. Minimum winds are found in southern Lebanon and in the Beqaa Valley, where the lowest values (between 1 and 2 m/s) were simulated.
FIGURE 3.AVERAGE ANNUAL TEMPERATURE (K, LEFT) AND WIND (M/S, RIGHT) SIMULATED WITH RAMS MODEL FOR 2011.FIELDS REFER TO THE LOWEST MODEL LEVEL, APPROXIMATELY AT 20M ABOVE GROUND.
10
3.2 Emissions
3.2.1 Anthropogenic emissions: USJ inventory and point sources integration
The common emission input is the Atmospheric Emission Inventory of Anthropogenic Sources for Lebanon, compiled by CEREA (France) and University of Saint Joseph (Lebanon), therefore cited as “USJ inventory” in the following. The inventory was provided by Dr. Charbel Afif and Dr. Charbel Abdalah of USJ, who also supported ENEA during the adaption phase for the AMS input. The USJ inventory is fully documented in a scientific paper published in 2012 (Waked et al, 2012). Here we present a brief recap of the data.
The anthropogenic emissions are mainly located on the coast line and the Bekaa Valley. A major contribution to NOx, CO and NMVOC comes from road traffic, while the power and industrial
plants are the highest emission sources of SO2, PM10, and PM2.5. NH3 emissions is mainly
originated from agriculture and animal manure management. Residential sources play a significant role in NOx, PM10 and PM2.5 production, due both to the widespread presence of personal
electricity generators, used for backup energy production in the frequent cases of power shortage, and to the domestic boilers for hot water.
The USJ inventory has been provided in a spatially gridded format, produced by the spatial allocation of emission data from administrative units to model cells, using spatial surrogate data like land cover, population density and transport networks. In the case of large point sources, single plant emissions were available for 14 plants, together with geographical coordinates, allowing an exact spatial allocation. However, for the stacks, geometrical features (height and diameter) and exhaust flow features (temperature and speed) were not available. This was an important limitation, as stacks features deeply affect pollutants dispersion, namely the actual height of polluting releases above the ground and consequently the wind speed impacting the plume.
This work was the occasion to revise and integrate the point sources inventory. The Ministry of Environment requested the industrial conductors to provide stacks geometrical and exhaust flow features. Following the responses, the features were inserted in the model input. Table 1 summarizes the USJ point sources inventory list with the mentioned integrations.
11
TABLE 1.POINT SOURCES AND STACKS USED IN THE MODEL ASSESSMENT.
Once the emission inventory data have been processed by the Emission Manager module, emissions are disaggregated in space, time, size of particles (for particulate matter) and base chemical species, in order to fit the chemical transport model design. The following maps (Figure 4) give an idea of the geographical distribution and the intensity of NOx and SO2 emissions.
PLANT STACK UTM36-X UTM36-Y HEIGHT
(m) DIAMETER (m) TEMPERATURE (K) SPEED (m/s) CO (t/y) NOX (t/y) SO2 (t/y) NMVOC (t/y) PM2.5 (t/y) PM10 (t/y) Holcim Grey 750398 3799110 109 6 391 11 4166 3228 779 208 1958 2708 Holcim White 750886 3800313 60 3 545 9 144 111 27 7 68 93 Cimentrienationale Stack 1 751254 3802399 74 4 373 13 1900 747 421 48 893 1235 Cimentrienationale Stack 2 751254 3802399 85 4 376 13 1527 1910 220 123 718 993 CimentrieSibline Stack 1 724666 3723525 64 2 363 16 744 135 12 9 259 358 CimentrieSibline Stack 2 724717 3723632 91 3 388 23 1313 1459 373 94 708 979
Lebanon Chemicals Acide Sulfurique n : 3 744328 3795690 39 2 351 3 2 5 535 0 13 18 Lebanon Chemicals Acide Sulfurique n : 4 744292 3795684 39 2 351 3 2 6 681 1 17 23 Lebanon Chemicals Acide Sulfurique n : 6 744287 3795868 40 2 346 8 8 19 2139 2 53 73
Lebanon Chemicals Chaudiere n : 2 744283 3795718 24 2 458 9 2 5 535 0 13 18
Lebanon Chemicals Chaudiere n : 3 744261 3795713 15 1 468 18 2 5 535 0 13 18
Zouk Stack 1 740533 3761882 145 4 418 21 33 1412 9558 5 85 118 Zouk Stack 2 740512 3761798 145 6 418 19 12 522 3535 2 32 44 Jyeh Stack 1 722485 3725647 41 3 418 15 5 200 1351 1 12 17 Jyeh Stack 2 722499 3725672 41 3 418 15 5 200 1351 1 12 17 Jyeh Stack 3 722514 3725694 43 3 418 16 6 248 1675 1 15 21 Jyeh Stack 4 722522 3725709 43 3 418 16 6 248 1675 1 15 21 Jyeh Stack 5 722538 3725734 43 3 418 16 6 248 1675 1 15 21 Zahrani Stack 1 717201 3708745 60 7 420 19 71 857 2190 4 5 10 Zahrani Stack 2 717201 3708745 60 7 420 19 71 857 2190 4 5 10 DeirAmmar Stack 1 765842 3817533 60 7 420 19 76 917 2344 4 5 10 DeirAmmar Stack 2 765842 3817533 60 7 420 19 76 917 2344 4 5 10 Baalbeck Stack 1 794712 3769082 20 4 416 17 3 37 94 0 0 0 Baalbeck Stack 2 794712 3769082 20 4 416 17 3 37 94 0 0 0 Tyre Stack 1 707639 3684125 20 4 416 17 10 119 305 1 1 1 Tyre Stack 2 707639 3684125 20 4 416 17 10 119 305 1 1 1 Hraiche 753655 3807727 35 3 408 17 5 198 1343 1 12 17
12
FIGURE 4.ANNUAL EMISSIONS OF NOX (LEFT) AND SO2(RIGHT).UNITS ARE IN TON/YEAR.
3.2.2 Biogenic emissions
Biogenic emissions were calculated separately by ENEA, since they are estimated also using a meteorological input; therefore such emissions have to be connected with the specific meteorological model used in the assessment.
Volatile Organic Compounds (VOCs) emitted from vegetation were calculated in AMS-Lebanon by means of the Model of Emissions of Gases and Aerosols from Nature (MEGAN; Guenther et al., 2006). In Figure 5, the emissions of Isoprene and Terpene over the target domain, averaged over 2011, are showed. Their distribution reflects the vegetation types pattern over the domain and, for isoprene and terpene, the temperature pattern (see Figure 3). Spatial distribution of terpene and isoprene is similar, with a prevalence of the latter over arable lands. Peak emissions result well correlated to the presence of forests.
Dust (soil erosion + resuspension) and sea salt emissions are depicted in Figure 6. Their estimation is made in the model using parameterizations that are function of land use (in the case of dust) and meteorological variables such as wind speed and precipitation. The figure shows that highest sea salt emissions are well correlated with zones of strongest average winds (see e.g. Figure 3, right panel). Dust emissions are well correlated with high wind regions (mainly mountains), semi-desert areas (eastern part of the domain) and arable lands (crops/mixed farming).
13
FIGURE 5.AVERAGE ANNUAL (2011) EMISSIONS OF ISOPRENE (LEFT) AND TERPENE (RIGHT), AS CALCULATED FROM MEGAN OVER THE MODELLING GRID. UNITS ARE IN MICROG/M2/S.
FIGURE 6.AVERAGE ANNUAL EMISSIONS CALCULATED BY AMS-LEBANON FOR DUST (COARSE MODE, LEFT PANEL) AND SEA SALT
(RIGHT PANEL).UNITS ARE IN MICROG/M2/S.
3.2.3 Foreign emissions
EMEP CEIP gridded inventories data, for the year 2011, have been used for anthropogenic emissions outside Lebanon boundaries. As first approximation, due the relative importance of foreign emissions, the EMEP emissions have not been spatially disaggregated on the USJ grid.
14
3.3 Concentrations
The following figures present the maps of average annual concentrations for NO2, NOx, O3, PM10,
PM2.5 and SO2, produced in output by the AMS-Lebanon modelling system.
FIGURES 7,8,9:
AMS-LEBANON RUN, BASE CASE (LH0),
MAPS OF ANNUAL AVERAGE OF CONCENTRATIONS FOR NO2,O3
15
FIGURES 10,11,12:
AMS-LEBANON RUN, BASE CASE (LH0),
MAPS OF ANNUAL AVERAGE OF CONCENTRATIONS FOR PM10, PM2.5 AND SO2(µG/M3)
These maps show in a glance the distribution of atmospheric pollution all over the study domain. Moreover, the color scales help to point out the hot-spots of “exceedances”, which in this case are referred to EU air quality limits on annual average (Directive 2008/50/EC), reported in Table 2, and are colored in red (except for NOx and O3, which have not a limit on annual average). Hot-spots are
clearly the advisable starting points of mitigation measures on air quality, while the extension of exceedance (red) and nearly exceedance (orange, yellow) zones gives a first idea on the needed effectiveness (and consequent engagement) of mitigation measures.
16 NO2 PM10 PM2.5 SO2 Annual average limit, µg/m3 40 40 25 20, for protection of vegetation
TABLE 2.EUAIR QUALITY LIMITS (DIRECTIVE 2008/50/EC), FOR AVERAGE ANNUAL CONCENTRATIONS.
NO2, PM10 and PM2.5 show a wide exceedance area on Beirut, with high peak values. This is a
combined effect of high contributions from road traffic and residential electrical production.
NO2 has high values, not exceeding the limit but around 30 µg/m3, also on Tripoli urban area and
along the Bekaa Valley, due to road traffic.
PM10 maps show several areas with values around 30 µg/m3, in southern Lebanon and in the lower right bound of the domain. Even wider areas are nearly in exceedances for PM2.5. This is an effect of the boundary conditions used for the model runs, therefore not caused by Lebanese emissions, but from transboundary pollution. Moreover, boundary conditions do not include the effect of Saharan dust, which need a separate model treatment and would further increase boundary concentrations, especially for PM10. So, given the limitations of these boundary conditions and the need of a more detailed model treatment, it is clear that PM has an important transboundary contribution, to be mitigated at international policy level.
The O3 map is inversely related to the NO2 map, due to the atmospheric chemistry where the two
substances are antagonist. The highest levels are on the sea.
The SO2 map shows several areas of exceedance and nearly exceedance, due to the same sources
impacting NO2 and PM, and namely to the sulfur content of fuels used in engines.
For a correct interpretation, the EU limit (20 µg/m3) is aimed at vegetation protection and fitted on Europe, where average precipitation is higher and causes acid rain, damaging forests. Therefore, SO2 maps should be also analyzed against the limits of concentration for human health protection.
In Europe, these latter limits protecting human health are on short-term concentrations (hourly and daily).
This allows to clarify that, for all pollutants, a modelling system at hourly time resolution (like AMS-Lebanon and state-of-art regional modelling systems) allows to calculate different aggregate indicators and statistics, for example to investigate compliance with EU limits on short-term concentrations (hourly, daily maximums), or to draw seasonal maps. This would give information on the peaks of pollution, needing different policy and mitigation measures with respect to long-term pollution, or on seasonal variations.
On the other hand, it is important to use this modelling set-up for regional and background air quality assessment, given the limited resolution and the emission inventory detail.
17
4 EMISSIONS SCENARIOS
The model assessment allows to investigate hypotheses on air quality management in a quick and cost-effective way. In a modelling tool, the whole system of input parameters (emissions and meteorology) and physical processes (transport and chemistry) is reproduced in each simulation. Therefore, once a “reference” simulation has been set down (a yearly simulation referred to a real-historical year or to a baseline future year), it is straightforward to vary input parameters, creating a so called “scenario” simulation. Scenario results can be used to “assess” potential changes in air quality, following changes in emissions and meteorology.
Examples of emission scenarios are mitigation measures on one or more emission sectors, long-term trends of energy production, variations of road vehicles fleet. Examples of meteorological scenarios are worst case episodes of low winds and long-term trends on temperatures (combined air quality-climate change scenarios).
It is important to underline the difference between “scenario assessments” and “predictions” carried out with modelling techniques. With respect to what previously defined as scenario assessment, a prediction (also named forecast) starts from a real situation and uses short term meteorological forecasts, often in combination with meteorological and air quality measurements, in order to obtain short term forecasts of concentrations. A prediction has to be enough accurate for operational uses, like in meteorological applications (e.g., civil protection in case of storms, floods, heat waves), which have been now active from decades. In the field of air quality, a forecast is used for example for traffic banning or calming when concentrations are predicted in excessive increase. Therefore, nowadays, an operational prediction cannot be pushed ahead more than 3-5 days, given the complexity of the atmospheric processes and the model limitations. Instead, a scenario assessment is a hypothetical situation, not necessarily describing actual situations, but instead investigating potential effects of emissions and mitigation measures both on short (hours, days) and on long (months, years) term concentrations of pollutants.
In this work, two emission scenarios were investigated, named LH1 and LH2, combining changes on emissions in major industrial facilities in Lebanon:
• LH1: new ELVs on cement production, Zouk and Jyeh power plants fueled with oil • LH2: new ELVs on cement production, Zouk and Jyeh power plants fueled with gas.
New ELVs on cement production
The first set of reduction measures was applied on cement factories. Starting from real production and emission data provided by the producers, we assumed realistic changes in national Emission Limit Values, following present Lebanese law and European reference practices and technologies in emission abatement. This work is fully documented in an internal report, being part of the technical assistance provided to the Ministry of Environment The proposal is summarized in Table 3.
18
new ELVs proposal for Lebanon Cement Plants (existing facilities) - mg/Nm3
NOX SOX Dust
current 2500 850 500
proposed 800 200 50
TABLE 3.CURRENT AND PROPOSED EMISSION LIMIT VALUES FOR CEMENT FACTORIES.
The actual concentrations of pollutants at stacks were provided by the cement producers and compared to the proposed limit values: for each pollutant:
- if the actual value was lower than the limit value, no changes were applied in the model emission input;
- if the actual value was higher than the limit value, the scenario value has been assumed equal to the limit value. The ratio between scenario and actual value was then applied to in the model emission input, to reduce emissions at compliance with proposed emission limit values.
It is worthy to underline that the actual emission values provided by the producers, in terms of total mass emitted per year, were not used in the model input. This was necessary in order to preserve the coherence with the baseline simulation, which uses the USJ emission inventory, not necessary in line with the producers data.
Another important issue was found on the data reported by the producers, on the annual average of pollutant concentrations at stacks. Many incoherencies were found in reference periods and percentages of water vapor and oxygen. Therefore, we had to make some assumptions, which could be wrong and have to be verified. A unified reporting format and a quality control procedure on the provided data are high priorities, for industrial emissions.
Rehabilitation of Zouk and Jyeh power plants: fueling with oil or with gas
The second set of reduction measures was applied on Zouk and Jyeh power plants, following MoE’s indications given before 23/6/2014, not including some following provisions (two new power generating groups added to the old ones, in both plants, and the sludge oil incineration in Zouk). This second set is therefore to be considered an exercise set, showing the potentiality of the AMS on a hypothetical set of measures on power plants
Both these plants are under rehabilitation projects and procedures, aimed to increase power production. In a first phase, the plants will be fueled with heavy fuel oil, in the perspective of a natural gas feeding, once the supply chain of natural gas has been built in Lebanon. Furthermore, the two stacks in Zouk will be reduced in height, from present 145 meters to 44 meters.
The environmental studies on emissions and atmospheric pollution of the oil fuel transition phase were provided by the MoE and allowed to quantify the predicted changes in emission rates, with respect to the actual situation.
19
In analogy with the approach used for cement factories, the ratios between new (predicted) and old (actual) emission rates were applied to baseline model input emissions (year 2010), obtaining LH1 scenario emissions.
For the gas fuel, in absence of specific data, the GAINS Europe emission factors were used in order to obtain LH2 scenario emissions, as they provide information on power plants emissions, with different types of fuel and abatement technology. More in details, SO2 and PM emissions are put to
zero, while NOx emissions from the LH1 scenario are multiplied by a reduction factor of 0.26,
obtained by the ratio between emission categories GAS-POGCM and PP_EX_OTH-HF-POGCM. Further details on technologies can be found in the GAINS-Europe model documentation (http://www.iiasa.ac.at/web/home/research/researchPrograms/GAINS.en.html). Like before, it is worthy to underline that the actual emission values provided in the environmental studies, in terms of total mass emitted per year, were not used in the model input. This was necessary in order to preserve the coherence with the baseline simulation, which uses the USJ emission inventory, not necessary in line with the data in the revamping projects.
In the following panels of maps, showed in the next paragraph, the comparison between each scenario and the baseline case is presented, for NO2, PM10 and SO2. The panels report the annual
average concentrations in the scenario case (upper left) and in the baseline case (upper right), then the absolute (lower left) and relative (lower right) difference of concentrations between scenario and reference cases are reported. For all maps, the measure unit is µg/m3, except for the relative difference, expressed in percentage referred to the baseline case (i.e. (LHy –LH0) x 100 / LH0 ).
20
4.1 LH1: new ELV on cement production, Zouk and Jyeh power
plants fueled with oil
Important increases of the concentrations are visible for NO2 (Fig. 13) on both the power plants,
with Zouk in evidence (over +2.5 µg/m3) with the synergic effect of a larger NOx emission and
lower stacks. Percentage increases are also important and widespread over the country. For PM10 (Fig. 14), reductions are visible due to the new ELV in Sibline cement factory but the values, both absolute and in percentage, are low. SO2 (Fig. 15) shows a complex situation, with valuable
reduction on Jyeh (less emission, same stack height) but almost no reduction in Zouk (antagonist effect between emission reduction and shortening of the stacks). Almost no effect on Chekka is visible, coherently with limited changes in SO2 and NOx emissions.
21
22
23
4.2 LH2: new ELV on cement production, Zouk and Jyeh power
plants fueled with gas
NO2 map (Fig. 16) is almost invariate, following emissions variations. For PM10 (Fig. 17) and SO2
(Fig. 18), more important reductions are visible, as emissions from power plants become actually negligible. However, these reductions seem far too small, for such a switch in combustion technology in power plants (from oil to gas). Therefore, we suspect that baseline emissions for SO2
and most of all for PM10 are underestimated.
24
25
26
5 CONCLUSIONS
The Atmospheric Modelling System of Lebanon (AMS-Lebanon) was developed by ENEA - Laboratory on Atmospheric Pollution for the Lebanese Ministry of Environment.
The system has been tested on a base case, represented by the 2010 emission inventory of Lebanon, and two scenarios: new emission limit values for cement industries and new plans for the power plants in Zouk and Jyeh.
In the base case, the maps of average annual concentrations for NO2, O3, PM10, PM2.5 and SO2
show the distribution of atmospheric pollution all over the study domain and point out the hot-spots of exceedances of EU limit values, taken as reference. NO2, PM10, PM2.5 and SO2 show a wide
exceedance area on Beirut, with high peak values, due to road traffic, residential electrical production and high sulfur content of fuels. PM shows an important transboundary contribution, to be mitigated at international policy level.
Due to the absence of long series of air pollution data over Lebanon, a classical validation of model results against measured meteorological variables and pollutant concentrations has not been possible. A model-to-model comparison has been performed between the ENEA's AMS and the USJ modelling system run over the same year 2011, using the same spatial resolution and fed by the same emissions but involving different meteorological and chemical transport models. Results have given more robustness to AMS-Lebanon indications. However, a national air quality network has been established in Lebanon in 2013, therefore in the future model evaluations against measured concentrations will be feasible.
Another priority is the update and improvement of the national emission inventory, both for large point sources (with the utilization of emission monitoring systems records) and for the main polluting sectors, road traffic and domestic combustion, with dedicated surveys, traffic counts and modelling, investigations on fuels and on driving habits. The major industrialized areas (Chekka-Selaata, Zouk, Jyeh-Sibline) result underestimated in the maps, likely for the lack of detailed emission description of the processes (quarries, diesel generation, etc.). Furthermore, such intensive polluting activities, as well as the large urban area of Beirut, cannot be adequately represented at 5 km resolution, but need a finer resolution in dedicated model activities.
The two scenario cases investigate reduction measures on cement factories and power plants. Realistic changes in national Emission Limit Values for cement factories have been assumed, following present Lebanese law and European reference practices and technologies in emission abatement. Furthermore, part of the planned rehabilitation measures of Zouk and Jyeh power plants (restart with oil fuel and a lower stack, scenario LH1, then commutation to gas fuel, scenario LH2) were applied. GAINS Europe emission factors were used in absence of specific data on gas fuel and abatement technologies. Both the scenarios cases were compared to the base case.
In the LH1 scenario, important increases of the concentrations are visible for NO2 on the power
plants and widespread over the country. For PM10, low reductions are visible around the Sibline cement factory. SO2 shows a complex situation, with valuable reduction on Jyeh but almost no
reduction in Zouk. Almost no effect on Chekka cement factory. In the LH2 scenario, NO2 shows
very limited variations. For PM10 and SO2, important reductions are visible, even if not large as
expected, indicating a possible underestimation in SO2 and PM10 emission from the industrial
27
responses on effectiveness of new emissions scenarios, like changes of Emission Limit Values for the various sources, planned power plants transformation, future offshore drilling activities.
These results are a starting point, demonstrating the usefulness of a state of the art air pollution model in assessing the effectiveness of industrial plans or political decision. The availability of a national emission inventory allowed a good model set-up, while the calculation of concentrations showed areas of improvement for the emission inventory.
Actually, the setup of the AMS modelling system over Lebanon provides the Ministry of Environment with a comprehensive picture of the most polluted areas of the country, representing the base case for environmental impact assessments studies or for new activities proposed where mitigation measures are more urgent, development plans have to be reconsidered or more stringent emission limit values have to be applied.
28
ARIA/ARIANET, 2008. EMMA (EMGR/make) User Manual, R2008.99. Arianet, Milano, Italy. Baldasano, J.M., Pay, M.T., Jorba, O., Gassó, S., Jiménez-Guerrero, P., 2011. “An annual assessment of air quality with the CALIOPE modeling system over Spain”. Sci. Total Environ. 409, 2163e2178.
Chemel, C., Sokhi, R.S., Yu, Y., Hayman, G.D., Vincent, K.J., Dore, A.J., et al., 2010. “Evaluation of a CMAQ simulation at high resolution over the UK for the calendar year 2003”. Atmos. Environ. 44, 2927e2939.
Cotton, W.R., Pielke, R.A., Walko, R.L., Liston, G.E., Tremback, C.J., Jiang, H., et al., 2003. RAMS 2001: Current status and future directions. Meteorol. Atmos. Phys. 82, 5-29.
European Commission (EC), 2008. Directive 2008/50/EC of the European Parliament and of the Council of 21 May 2008 on ambient air quality and cleaner air for Europe. The Framework Directive. Official Journal European Union En. Series, L152/51.
Gariazzo, C., Silibello, C., Finardi, S., Radice, P., Piersanti, A., Calori, G., et al., 2007. A gas/aerosol air pollutants study over the urban area of Rome using a comprehensive chemical transport model. Atmos. Environ. 41, 7286-7303.
Guenther, A., Karl, T., Harley, P., Wiedinmyer, C., Palmer, P. I., and Geron, C., 2006. Estimates of global terrestrial isoprene emissions using MEGAN (Model of Emissions of Gases and Aerosols from Nature). Atmos. Chem. Phys., 6, 3181-3210.
Mircea, M., Ciancarella L., Briganti G., Calori G., Cappelletti A., Cionni I., Costa M., Cremona G., D’Isidoro M., Finardi S., Pace G., Piersanti A., Righini G., Silibello C., Vitali L., Zanini G., 2014. Assessment of the AMS-MINNI system capabilities to simulate air quality over Italy for the calendar year 2005. Atmos. Environ. 84, 178-188.
Silibello, C., Calori, G., Brusasca, G., Giudici, A., Angelino, E., Fossati, G., et al., 2008. Modelling of PM10 concentrations over Milano urban area using two aerosol modules. Environ. Model. Softw. 23, 333-343.
Waked, A., Seigneur, C., Couvidat, F., Kim, Y., Sartelet, K., Afif, C., Borbon, A., Formenti, P., and Sauvage S., 2013 Modeling air pollution in Lebanon: evaluation at a suburban site in Beirut during summer. Atm. Chem. Phys., 13, 5873–5886, 2013.
Edito dall’ENEA
Servizio Promozione e Comunicazione Lungotevere Thaon di Revel, 76 - 00196 Roma
www.enea.it Pervenuto il 31.3.2016
Stampato presso il Laboratorio Tecnografico ENEA - C.R. Frascati Finito di stampare nel mese di aprile 2016