Clinics of Oncology
Stereotactic Radiation Therapy of Lung Cancers and Subsequent
Parenchymal Alterations: from Their Spatial Distribution to the
Use in Clinical Practice
Maddalo Marta1, Baiguini Anna2, Borghesi Andrea3, Toraci Cristian4, Bonù Marco Lorenzo2, Polonini Alessia4, Salah Emiliano1,
Greco Diana1, Ravanelli Marco3, Farina Davide3, Vitali Paola1, Buglione Michela2, Triggiani Luca2, Pasinetti Nadia5, Spiazzi Luigi4,
Maroldi Roberto2, Magrini Stefano Maria2 and Borghetti Paolo1
1Department of Radiation Oncology, Spedali Civili, Brescia 2Department of Radiation Oncology, University of Brescia 3Department of Radiology, Spedali Civili, Brescia
4Departmeny of Medical Physics, Spedali Civili, Brescia
5Department of Radiation Oncology, Valcamonica Hospital, Esine (Brescia)
Volume 2 Issue 3- 2020 Received Date: 11 Dec 2019 Accepted Date: 19 Jan 2020 Published Date: 22 Jan 2020
1. Abstract 1.1. Aims
Stereotactic body radiation therapy (SBRT) is one of the standard radical treatments in stage I non-small cell lung cancer (NSCLC) and an option for lung metastases. The pulmonary parenchymal CT alterations at 3, 6 and 12 months are the object of a prospective analysis in patients submitted to SBRT, to define factors affecting the different radiological alterations. The isodoses better conformed to the damaged pulmonary volume will be identified; the time course of CT alteration is also addressed.
1.2. Materials and Methods
CT images of patients treated with SBRT for primitive or lung metastases were reviewed.
Planning target volume (PTV), comorbidity, type of tumor, were related to patterns of lung toxicity (dense, ground glass or both).
1.3. Results
From 2012 to 2015, 56 patients were treated with SBRT (55 Gy in 5 fractions schedule). In terms of dimension of PTV, the pattern of toxicity changes at 3 (p = 0.009), 6 (p = 0.001) and 12 (p = 0.002) months, showing that small nodules developed ground glass patterns and bigger nodules a dense one. Pattern of toxicity changed at 3 (p = 0.003) and 6 months (p = 0.026) in relation with comorbidities, but not at 12 months.
1.4. Conclusions
The pattern of lung toxicity changed during the first year after SBRT. Old patients with several comorbidities repair differently lung damage with consequently particular type of toxicity pattern. A deeper understanding of the isodose that better conforms to damaged volume could contribute to distinguish radiation induced lung injury from disease progression.
2. Keywords
SBRT; SABR; Lung cancer; Lung damage; Stereotactic body radiation therapy
Research Article
Valcamoni-3. Introduction
Stereotactic body radiation therapy (SBRT) has been adopted since the mid-1990s for treating lung nodules, including early stage non-small cell lung cancer (NSCLC) and lung oligometastases [1], yielding excellent local control rates [2].
Fifteen to twenty percent of patients diagnosed with NSCLC have stage I disease [3]. Treatment of choice in early stage NSCLC is surgery. Dang Han-Yu et al. [4] reported the results of a meta-analysis comparing surgery versus SBRT in this subset of patients. The same authors reported also two subgroup meta-analyses comparing SBRT versus lobectomy and versus sub-lobar
resection. These studies demonstrated a significant difference in terms of overall survival (OS) favouring surgery and in particular lobectomy. The authors concluded that SBRT offers good short-term control of early-stage NSCLC but that lobectomy is still the standard treatment, due to better long-term prognosis.
Two randomized phase III trials comparing lobectomy and SBRT (STARS and ROSEL, ClinicalTrials.gov, STARS: NCT00840749, ROSEL: NCT00687986)) [5] in medically operable stage I NSCLC have been performed but none of them reached the number of patients expected to be enrolled. A pooled analysis of these two trials, however, showed a benefit in OS for SBRT.
However, several authors pointed out that it is difficult to compare SBRT data to surgical series. Ricardi et al. [6] after a median follow-up of 20.4 months after SBRT on lung metastases found out that 2 and 3 Years local control rates were 89% and 83.5% respectively, overall survival 66.5% and 52.5%, cancer-specific survival 75.4% and 67%, progression-free survival 32.4% and 22.3%. They concluded that lung SBRT, also without histological confirmation, appear promising also considering issues as patients compliance to treatment, toxicity profile, and cost-effectiveness parameters.
Table 1: RTOG Common Toxicity Criteria for lung toxicity
Grade
0 None
1 Asymptomatic or mild Symptoms (dry cough) Slight radiographic appearances 2
Moderate symptomatic fibrosis or pneumonitis (severe cough)
Low grade fever
Patchy radiographic appearances
3 Severe symptomatic fibrosis or pneumonitis Dense radiographic changes 4 Severe respiratory insufficiency/Continuous O2/ Assisted ventilation 5 Death related to radiation effects
Grade Definition of dyspnea: A disorder characterized by an uncomfortable sensation of difficulty breathing
0 None
1 Shortness of breath with moderate exertion
2 Shortness of breath with minimal exertion; Limiting instrumental ADL 3 Shortness of breath at rest; Limiting self care ADL 4 Life-threatening consequences; urgent intervention indicated
5 Death
Table 2:CTCAE Common Terminology Criteria for Adverse Events for dyspnea.
Grade
Acute Lung Tox
(RTOG) Acute Esophageal Tox (RTOG) Late Lung Tox (RTOG) Late chest wall Tox (RTOG)
N patients Percentage N patients Percentage N patients Percentage N patients Percentage
0 39 70 51 91 30 54 47 84
1 12 21 3 5 18 32 0 0
2 3 5 2 4 7 13 4 7
3 2 4 0 0 0 0 1 2
4 0 0 0 0 1 2 4 7
Table 3: Description of patients toxicities referring to RTOG scales.
3 months 6 months 12 months
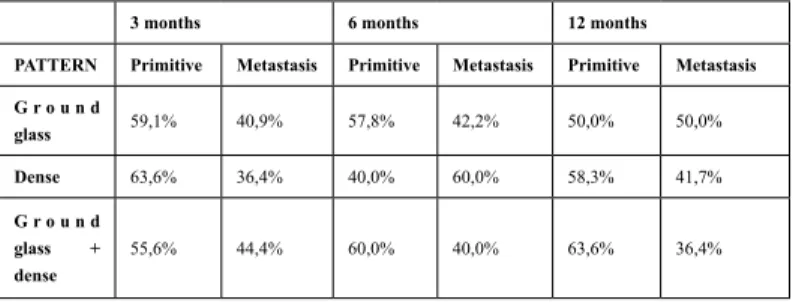
PATTERN Primitive Metastasis Primitive Metastasis Primitive Metastasis G r o u n d glass 59,1% 40,9% 57,8% 42,2% 50,0% 50,0% Dense 63,6% 36,4% 40,0% 60,0% 58,3% 41,7% G r o u n d glass + dense 55,6% 44,4% 60,0% 40,0% 63,6% 36,4%
Table 4:Lung alteration patterns variations over time (3, 6 and 12 months after SBRT) according to the type of tumor (primitive or metastasis).
In a very recent retrospective multicenter analysis (2019) Scotti et al. [7] at univariate analysis no significant difference was found in local control between patients who underwent SBRT or lobectomy, with a trend in favor of surgery. Overall survival was significantly better in patients who underwent lobectomy; however, no difference in overall survival was observed between operable patients undergoing SBRT and patients that underwent lobectomy.
Progression free survival was comparable between patients who underwent lobectomy and SBRT.
Even considering surgery as the treatment of choice for early stage NSCLC, about thirty percent of patients are not operated, due to older age, medical comorbidities or because of their preferences. In this setting, a better level of evidence on SBRT is available: a
3 months p=0.0009 3 months p=0.0001 3 months p=0.0002
PATTERN PTV ≤ 28.1 cc PTV > 28.1 cc Sum PTV ≤ 28.1 cc PTV > 28.1 cc Sum PTV ≤ 28.1 cc PTV > 28.1 cc Sum Ground glass 32.2% 9.4% 41,6% 31.5% 3.7% 35,2% 42.6% 8.5% 51,1% Dense 13.2% 28.3% 41,5% 11.1% 16.7% 27,8% 10.6% 14.9% 25,5% Ground glass + dense 7.5% 9.4% 16,9% 13% 24% 37% 6.4% 17.0% 23,4% Sum 52,9% 47,1% 100,0% 55,6% 44,4% 100% 59,6% 40,4% 100%
Table 5:Lung alteration patterns variations over time (3, 6 and 12 months after SBRT) according to PTV volume.
3 months p=0.0009 3 months p=0.0001 3 months p=0.0002
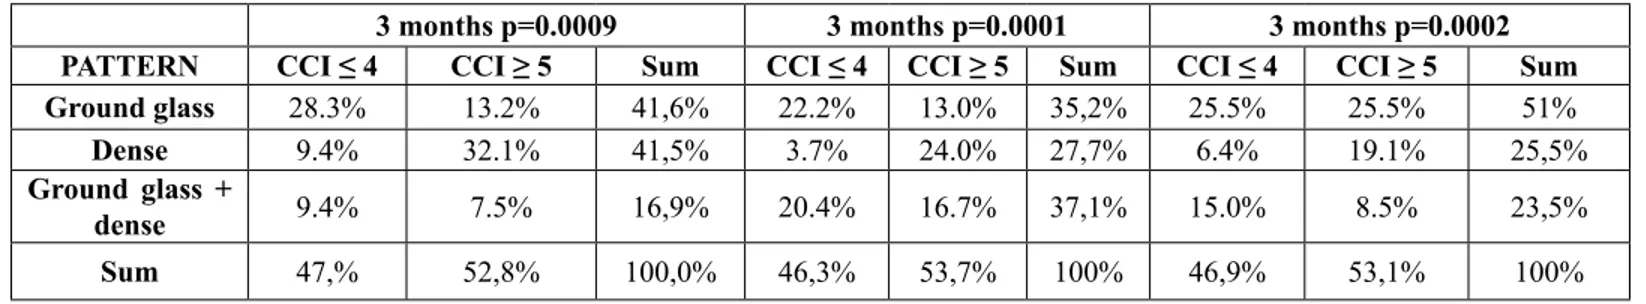
PATTERN CCI ≤ 4 CCI ≥ 5 Sum CCI ≤ 4 CCI ≥ 5 Sum CCI ≤ 4 CCI ≥ 5 Sum
Ground glass 28.3% 13.2% 41,6% 22.2% 13.0% 35,2% 25.5% 25.5% 51%
Dense 9.4% 32.1% 41,5% 3.7% 24.0% 27,7% 6.4% 19.1% 25,5%
Ground glass +
dense 9.4% 7.5% 16,9% 20.4% 16.7% 37,1% 15.0% 8.5% 23,5%
Sum 47,% 52,8% 100,0% 46,3% 53,7% 100% 46,9% 53,1% 100%
Table 6: Lung alteration patterns variations over time (3, 6 and 12 months after SBRT) according to CCI.
3 months 6 months 12 months
T o x volume ( m e a n cc) Iso dose ( m e a n Gy) CI (mean
%) Tox volume (mean cc)
Iso dose ( m e a n Gy) C I ( m e a n %) T o x v o l u m e ( m e a n cc) Iso dose (mean Gy) C I (mean %) PTV (median 28.1) U n d e r median 35 43 47 52 40 49 50 35 46 O v e r median 49 49 51 76 37 46 73 38 48 Charlson Com orbidity Index ≤ 4 42 44 49 69 37 52 71 34 51 ≥ 5 41 46 49 57 41 44 49 38 43 Lung Toxicity Pattern G r o u n d Glass 50 42 46 56 39 48 50 37 46 Dense 27 50 49 50 37 43 63 35 50 GG + Dense 57 43 56 78 40 51 76 35 43
Table 7: Quantitative analysis of how the lung toxicity volumes and is dose curves change according to PTV, CCI and lung toxicity pattern.
Phase 1 study conducted at Indiana University showed that patients with stage I disease treated with escalating SBRT doses had crude rates of local failure of 21%. A dose response was recognized with a cut-off value of 16 Gy for single fractions [8, 9]. A Phase 2 multicenter trial (RTOG 0236) [10] evaluated SBRT’s toxicity and efficacy in a high risk population of patients with early stage medically inoperable lung cancer, concluding that the survival rate at 3 years was of 55.8% with high rates of local tumor control (97.6%) and moderate treatment-related morbidity.
The SPACE study [11] randomized patients with stage I medically inoperable NSCLC to receive SBRT (66 Gy in 3 fractions) or 3DCRT (70 Gy in 35 fractions). No differences were found in terms of progression free survival, overall survival and local control; toxicity was generally mild in both treatment arms.
Based on these studies, SBRT is now the standard of care for inoperable early stage NSCLC. Nonetheless, even if local control rates are excellent, distant failure is common, occurring in 20-30% of patients in 3-5 years [12].
SBRT for lung oligometastases represents a different scenario; many data support this therapeutic approach mainly to postpone systemic treatment [13].
During follow up, usually 3-4 months after SBRT, a shadow corresponding to the irradiated area appears, characterized by shrinkage of the pulmonary parenchyma. Sometimes on this area symptomatically radiation pneumonitis develops. The shadow of the treated nodule blends itself with the shadow of the radiation pneumonitis area, making it difficult to distinguish one from the other. If the dimensions of the shadow remain stable during the follow up, the tumor is generally considered controlled, because likely no vital tumor cells are present. Conversely, if the shadow starts to grow and enlarges vital residual cells and uncontrolled tumor are supposed to be present. Sometimes, in relation to these radiological signs, many years are necessary to be sure that local control has been achieved. Several authors stated that the presence of a residual mass is not necessarily indicative of a possible future recurrence and, in some cases, the tumor seems to be controlled even if a mass shadow persists [2, 14].
To date, to differentiate pulmonary parenchymal CT alterations after stereotactic body radiation therapy (SBRT) from local relapse remains difficult.
The purpose of this study is to evaluate in retrospect clinical toxicities and radiological lung alteration in a cohort of patients treated with SBRT for lung nodules. Moreover, this study aims to define which factors could affect CT volumes and pattern of lung toxicity and to assess the isodose curves that better conform to the damaged pulmonary volume. CT alterations time course has been also addressed.
4. Patients and Methods 4.1. Patients selection
From 2012 to 2015 91 patients were treated with lung SBRT at the Brescia University Radiation Oncology Department: 46 lesions were primary lung cancers and 45 were secondary nodules from lung or other primary tumors.
All the patients were treated with 55 Gy in 5 fractions; they had the entire radiological follow up at the Brescia University Radiology
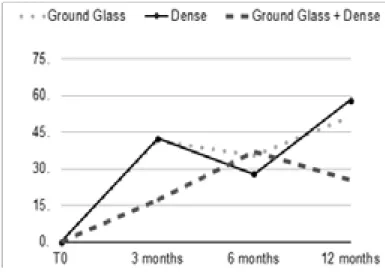
Figure 1:percentage of different patterns at 3, 6 and 12 months of follow up.
Figure 2:This picture reports lung damage in a patient with a nodule in left lung. In particular it is depicted how lung damage progresses during time at 3, 6 and 12 months after SBRT.
Department. The present study is therefore limited to 56 patients and 60 lesions.
The patients comorbidities were defined using the Charlson Comorbidity Index, CCI, a system integrating information about clinical conditions, comorbidity and patients age. Fit patients had CCI ≤ 4; patients were considered un-fit if CCI was ≥ 5.
4.2. SBRT methods
Patients were positioned on a wing board and respiratory motion was reduced by abdominal compression. A 4D CT scan (Philips Brilliance CT, Philips, Cleveland, USA, ®) was obtained, using five image reconstruction phases (from 0 to 80%), with 0% representing the end of inspiration, 40% representing half of a respiratory cycle and 80% representing the completed cycle.
Contouring was conducted with Nucletron Oncentra MasterPlan ® (Columbia, USA) and planning with Philips Pinnacle ® (Massachusetts, USA).
The Gross Tumor Volume (GTV) was identified on axial CT using pulmonary windowing (considering the window width at +1600 Hounsfield Units and the window level at -600 Hounsfield Units). After having contoured the five different GTVs, corresponding to the five image reconstruction phases, the Internal Target Volume (ITV) was defined, including all the GTV contours. The Planning Target Volume (PTV) was created by expanding the ITV 0.9 cm in all direction.
All patients were treated using Volumetric Modulated Arc Therapy (VMAT), with daily image guidance with 3D Cone-Beam kV CT (IGRT). SBRT was delivered using two Elekta Synergy ® linear accelerators. The treatment was given in 5 consecutive 11 Gy daily fractions.
4.3. Follow up procedures: radiological and clinical evaluation After SBRT completion, radiological and clinical follow up begun prospectively for all treated patients, at defined time points (3, 6 and 12 months), according to institutional policy.
Radiological follow up was carried out with multi detector row computed tomography (MDCT) scanner at 3, 6 and 12 months. All the MDCT exams were performed at the Radiology Department of our University using a 128-detector CT scanner (Soma tom Definition Flash; Siemens healthcare, Forchheim, Germany) with
the following parameters: collimation, 128x0.6 mm; beam pitch, 1.2; rotation time, 0.5 s; tube voltage, 120 kVp; and tube current, 110 mAs. The acquisition, extending from the lung apex to lung base, was performed in inspiratory apnea. The volume was reconstructed as 1 mm thick sections, applying a sharp reconstruction algorithm and lung window setting. Only unenhanced MDCT images were used for image evaluation.
Clinical follow up was performed in order to evaluate local control and regional or distant progression. It was used a cut off of 3 months to distinguish between acute and late toxicity. Reported toxicities were assessed using different evaluation scales. In particular, acute lung and esophageal toxicities were determined with reference to RTOG Common Toxicity Criteria, as well as late lung and chest wall toxicity. Late dyspnea was also assessed according to CTCAE (Common Terminology Criteria for Adverse Events) v. 5.0 (2017). RTOG and CTCAE scales are reported in Table 1 and 2.
4.4. Evaluation of the characteristics of the lung toxicity during follow up
Three different patterns of lung toxicity in follow up CT scans were defined in order to classify lung toxicity patterns [12-16]:
• Dense pattern: represented by a region with “solid” high density, where blood vessels cannot be recognized;
• Ground Glass (GG) pattern: with higher density than normal lung parenchyma, but with the possibility of seeing blood vessels; • Mixed pattern: characterized by both dense and GG patterns. In this study planning CT were co-registered with 3, 6 and 12 months follow-up CT. These images were obtained in different respiratory phases and with different setup. The comparison was possible using the Varian Medical Systems software Velocity ® (Velocity Medical Solutions, Atlanta, Georgia, USA). This software works through a modified B-spline calculation algorithm, that computes the 3D displacement necessary for voxels to reach optimal fits and contours attached to specific voxels are deformed and warped with the same 3D displacement.
Both the CT scan images at 3, 6 and 12 months after SBRT and the SBRT planning images were sent to to the Velocity ® software. The first step was a rigid registration, providing a good correspondence between the bone structures of the two sets of images; on the contrary, the results of the matching of the treated lesion with the lung toxicity area and the thoracic wall were
unsatisfactory.
Thus, a second step was a deformable registration the lung region of interest. This allowed us to obtain a better coregistration of the treated nodule with the lung toxicity area and the thoracic wall (3-5 mm precision). After deformation, matching was qualitatively evaluated by comparing locations of major structures (for example great vessels, chest wall, major airways).
The third step was the contouring of the lung visible alterations areas in the follow up CT at 3, 6 and 12 months.
Finally, these contoured areas were compared with the planning volumes and the isodose curves.
In a preliminary phase radiation oncologists were trained by a radiologist, in order to better identify the three different alterations pattern. At the beginning CT scans were contoured by two double-blinded radiation oncologists. The contours obtained in the first 10 patients were compared and no significant differences were found between the two operators. The study was therefore continued by a single radiation oncologist.
To evaluate the relations between PTV volume and lung alterations a median PTV volume has been calculated, in order to understand if lung alterations change in relation to PTV volumes.
5. Statistical Analysis
The data are presented as numbers (%) or the mean ± standard deviation for normally distributed data or as the median and interquartile range (IQR) for not normally distributed data. The relationship between the different clinical and treatment variables (type of nodule, primary vs metastatic; age, presence of COPD, Karnofsky index, CCI, Planning Target Volume – PTV) with the type of lung abnormalities (ground glass, dense, mixed) was analyzed.
To compare different variables χ-square test, Student t test and Anova test were used. Student t test was used to investigate two groups of patients and Anova test to compare more than two groups of patients.
The SPSS ® software (IBM, Chicago, Illinois, USA) was used for statistical analysis, using two-sided statistical testing with p = 0.05 indicating statistical significance.
6. Results
From 2012 to 2015, 56 patients and a total number of 60 nodules were treated with SBRT for primary stage I NSCLC or pulmonary
metastasis with a 55 Gy in 5 fractions schedule.
Forty-five percent of patients had a Charlson Comorbidity Index lower than 5 (CCI ≤ 4) and 55% had CCI ≥ 5.
Among all patients, 39 (70%) were asymptomatic, while 17 presented mild or moderate lung toxicity and none had severe lung toxicity. Only 5 patients (9%) reported acute esophageal toxicity. Late lung RTOG toxicity was assessed in 26 of patients (47%). Late chest wall toxicity was found in 9 patients (16%), manifesting with rib fracture.
All these results are reported in Table 3.
Late dyspnea described using CTCAE scale was reported by 35 patients out of 56 (63%). Sixteen patients (29%) reported grade 1 dyspnea, 17 patients grade 2 dyspnea (30%), 1 patient (2%), grade 3 and 1 patient grade 4 dyspnea. It is also interesting to notice that the majority of these patients (30 out of 35, 85.7%) already presented mild or moderate dyspnea before radiation treatment. In particular, the patients that reported grade 3 dyspnea already had previously grade 2 dyspnea and the patient that reported grade 4 dyspnea already had grade 3 dyspnea.
Loco-regional progression of disease
Twelve patients out of 56 (21%) showed loco-regional relapse of disease. Of these patients, 7 presented nodal mediastinal relapse, while in 5 patients massive lung progression was described, with the appearance of several lung nodules. All of these five patients had an increase in the dimensions of the treated lung lesions and also in-field progression.
Fifty-eight percent of the cases had primitive lung cancer, 30% were treated for lung cancer metastases and 11.7% for metastases from other primitive tumors.
Three months after SBRT 41.5% of patients had GG pattern, 41.5% dense toxicity and 17% mixed pattern. At 6 months, 35.2% of patients had GG changes, 27.8% had dense parenchymal alterations and 37% had mixed pattern. At 12 months, GG, dense and mixed patterns were respectively present in 51%, 25.5% and 23.5% of patients (Figure 1).
The different toxicity areas deriving from treating lung cancer, metastases from lung cancer or metastases from different tumors tended to increase in volume during time.
Lung alteration patterns variations over time (3, 6 and 12 months after SBRT) according to the type of tumor (primitive or metastasis)
are reported in Table 4.
The median PTV volume was 28.1 cc (range 8.86 - 108.0 cc). Lung alterations resulted different in relation to PTV volumes.
A ground glass pattern of lung alteration was more represented for nodules with PTV < 28.1 cc. Three, 6 and 12 months after SBRT, GG pattern rate resulted significantly higher for small nodules 32.1% (p=0.009), 31.5% (p=0.001) and 42.6% (p=0.002), respectively (Table 5).
The pattern of lung damage significantly changes at 3 and 6 months but not at 12 months (p = 0.009 and 0.009, respectively) in relation with CCI. In particular, 28.3% of the fit patients (CCI ≤ 4) developed a ground glass pattern at 3 months and 22.2% at 6 months, while in older patients with several comorbidities (CCI ≥ 5) dense toxicity was the more frequently observed pattern, 32.1% at 3 months and 24.1% at 6 months.
Lung changes variations over time (3, 6 and 12 months after SBRT) according to the score of Charlson Comorbidity Index are reported in Table 6.
7. Dosimetric Evaluation
The quantitative analysis of how lung toxicity volumes and isodose curves change according to PTV, CCI and lung toxicity pattern is reported in table 7.
Patients with larger PTV showed a non-significantly lung alteration volume, increasing with time after SBRT. In parallel, isodose curves values encircling the lung toxicity areas (included in the 35 - 50 Gy isodose range), tended to decrease in dimension during the 12 months of follow up, being substantially superimposable for patients with high and low CCI.
Patients with CCI ≤ 4 showed larger damaged volume than unfit patients (differences not statistically significant) that increased at the various time intervals after SBRT (42 cc, 69 cc and 71 cc at 3, 6 and 12 months, respectively). The values (in Gy) of the isodoses better conforming to the damaged lung volume decreased during the follow up, ranging in the different subgroups analysed between 42 and 50 Gy at 3 months, 37 Gy and 41 Gy at 6 months, 35 Gy and 38 Gy at 12 months.
Evaluating the conformal index (CI) at 3, 6 and 12 months, the isodose conformation around the damaged area is about 50%.
8. Discussion
The main aim of this study was to evaluate clinical toxicities and radiological lung alteration in a cohort of patients treated with SBRT for lung nodules. As already described in literature our series reported a low rate of toxicity.
This series attempts to take advantage from more precise three-dimensional evaluation of the shape of lung damaged regions and of dose envelopes.
Therefore the data from this series add to the literature on the value of the isodose curve that more accurately conforms to the area involved by CT-defined lung toxicity. This dose–alteration correlation might have an important application during follow up after SBRT: in fact, it could help to distinguish recurrence from benign changes based on the knowledge of the relevant isodose curves and on the degree of normal density changes after SBRT. We observed that the isodose curves better fitting with the extent of CT-evident lung toxicity are in the 35-50 Gy range. Even if this range seems large, it corresponds to a 5-30 mm radius around the area of interest on the CT slice.
The time course of RILD is known since more than 30 years [17]. However to help to semi-quantitatively distinguish between disease relapse/progression and RILD, a few authors tried to define the isodose curves that correspond to pulmonary alterations. Our results are generally in agreement with these studies, that outline modest increases in CT density above 20-30 Gy and profound changes at doses above 60 Gy.
Palma et al. [18] in a 2011 study reported that density increases mostly at doses > 20 Gy, with a plateau above 30 Gy. They also reported in another study conducted in the same year [19] that the largest increases in lung density are noted in regions receiving more than 50 Gy.
Aoki et al. [20] report that the minimal lung dose to the area with pulmonary injury ranges between 16 and 36 Gy, with a median of 24 Gy.
Knoll et al. [1] noticed that the 20 Gy isodose curve approximates the pattern and shape of the observed radiation induced lung injury and is not predictive of recurrence.
In our series, patients with CCI < 4 showed smaller nodules and presented mainly a GG lung damage that tended to decrease during follow up. On the contrary, patients with CCI > 5 tended to have greater nodules and developed a dense lung damage that often increased in dimensions during follow up.
The fact that old patients tend to have greater nodules could have more than a clinical explanation. In fact old people with comorbidities could have a late diagnosis of lung nodules (primitive or metastasis), and therefore these lesions could be larger. In elderly with comorbidities diagnosed with a large lung nodule, surgery is not feasible. Therefore, the increase of lung toxicity area during follow up could be explained and related to the initial greater dimension of the lesion.
In literature a few studies [21-24] reviewed the mechanisms of lung damage from a histologic point of view. The mechanisms of damage can be resumed as follow:
a month after SBRT, a damage to type I and type II pneumocytes can be observed. Subsequently there is a reduction of surfactant production and the alveoli tend to collapse. Moreover, it appears a vascular damage with an increase of vessel permeability leading to interstitial edema;
3-6 months after SBRT, there is an incessant inflammatory response, with proliferation of leucocytes, plasmacells, macrophages, fibroblasts that provide collagen fibers deposition. A thickening of alveolar septa Is also observed;
6-9 months after SBRT, fibrosis starts to develop with capillary loss, further alveolar septa thickening and obliteration of alveolar space; 1-2 years after SBRT, the full picture of pulmonary fibrosis is evident, as consequence of the lung damage repair process. This process is mediated by macrophages that stimulate a cytokine cascade (mainly represented by TNF-alpha, TGF-beta, IGF-1, PDGF), that consequently recruits fibroblasts, responsible of fibrotic damage. These cascades are stimulated by the activation of promoters like NFKB and AP1 (encoded by Jun and FOS genes), that enhance cytokines genes transcription.
The consequent development of pulmonary fibrosis is limited to the treated area where radiation induced cytokine release takes place.
8.1. This process is represented by the following CT scan density changes
One month after SBRT, is often impossible to see changes of lung tissue;
Approximately 3-6 months after SBRT, the consolidation, in the high-dose region of pulmonary parenchyma, and ground glass alteration in the low dose region begin to be seen. This is considere d as acute radiation pneumonitis;
between 6 and 9 months after SBRT, consolidation develops into solid or dense consolidation, seen at CT imaging as a dense opacity; This process evolves, until at 1-2 years after SBRT, when the pulmonary opacities become stable.
If there will not be cancer recurrence, these areas will tend not to change in their extension and morphology.
This whole process is represented in Figure 2.
Aging is associated with a chronic pro-inflammatory state [25-27] characterized by elevated levels of circulating cytokines, such as IL-1, Il-6, TNF-alpha, leading to the definition of the so-called “inflamm-aging”, a subclinical inflammatory status characterized by a lifelong continuous stimulation of the immune system. So it can be hypothesized that in older patients with comorbidities who underwent radiotherapy, a lung damage repair mechanism is activated, causing a continuous inflammatory response after SBRT. This reaction is characterized by a perpetual pro-inflammatory state, leading to an enhancement of the inflammatory state, resulting in an increased production of cytokines (with a leading role played by TNF-alpha). Fibroblast activation and fibrosis development follow. Fibrotic areas are those characterized by a dense pattern in follow up CT scans. This could explain why older people with comorbidities tend to develop a dense toxicity pattern, that increases during the first year of follow up.
However, these hystopatological and radiographic findings do not correlates with increased clinical toxicity. Thus, elderly patients remains ideal candidates for SBRT, especially those unfit for surgery.
9. Conclusion
The “shape” of lung toxicity changes during the first year after SBRT, leading to lung fibrosis within 12 months. Old patients with several comorbidities have a different capability to repair lung damage and they consequently show higher incidence of this type of pattern. Young and fit patients tend to have smaller nodules and they show a GG damage that decreases during follow up.
In addition to the knowledge of the “shape” of isodose curves, this could allow to better distinguish radiation induced lung injury from disease progression.
References
1. Knoll MA. The use of isodose levels to interpret radiation induced lung injury : a quantitative analysis of computed tomography changes. Quant Imaging Med Surg. 2016; 6: 35-41.
2. Takenaka R. The Fate of Residual Tumor Masses That Persist After Stereotactic Body Radiation Therapy for Solitary Lung Nodules: Will They Recur? Clin Lung Cancer. 2015; 1-6.
3. Midthun DE, Jett JR. Update on screening for lung cancer. Semin Respir Crit Care Med. 2008; 29: 233-240.
4. Deng HY, Wang YC, Ni PZ. Radiotherapy, lobectomy or sublobar resection? A meta-analysis of the choices for treating stage I non-small-cell lung cancer. Eur J Cardio-thoracic Surg. 2017; 51: 203-210.
5. Chang JY, Senan S, Paul MA. Stereotactic ablative radiotherapy versus lobectomy for operable stage I non-small-cell lung cancer: a pooled analysis of two randomised trials. Lancet Oncol. 2015; 16: 630-637. 6. Ricardi U. Stereotactic body radiation therapy for lung metastases. Lung Cancer. 2012; 75: 77-81.
7. Scotti V, Bruni A, Francolini G. Stereotactic Ablative Radiotherapy as an Alternative to Lobectomy in Patients With Medically Operable Stage I NSCLC: A Retrospective, Multicenter Analysis. Clin Lung Cancer. 2019; 20: e53-e61.
8. McGarry RC, Papiez L, Williams M. Stereotactic body radiation therapy of early-stage non-small-cell lung carcinoma: Phase I study. Int J Radiat Oncol Biol Phys. 2005; 63: 1010-1015.
9. Timmerman R, Papiez L, McGarry R. Extracranial Stereotactic Radioablation*. Chest. 2003; 124: 1946-1955.
10. Timmerman R. Stereotactic Body Radiation Therapy for Inoperable Early Stage Lung Cancer. JAMA. 2010; 303: 1070-1076.
11. Nyman J. SPACE – A randomized study of SBRT vs conventional fractionated radiotherapy in medically inoperable stage I NSCLC. Radiother Oncol. 2016; 121: 1-8.
12. Folkert M. Stereotactc ablative body radiosurgery (SABR) or Stereotactic body radiation therapy (SBRT). Adv Drug Deliv Rev. 2016; 109: 3-14.
13. Triggiani L. Metastasis-directed stereotactic radiotherapy for oligoprogressive castration-resistant prostate cancer: a multicenter study. World J Urol. 2019.
14. Matsuo Y, Nagata Y, Mizowaki T. Evaluation of mass-like consolidation
after stereotactic body radiation therapy for lung tumors. Int J Clin Oncol. 2007; 12: 356-362.
15. Kato S, Nambu A, Onishi H. Computed tomography appearances of local recurrence after stereotactic body radiation therapy for stage I non-small-cell lung carcinoma. Jpn J Radiol. 2010; 28: 259-265.
16. Takeda A. Possible misinterpretation of demarcated solid patterns of radiation fibrosis on CT scans as tumor recurrence in patients receiving hypofractionated stereotactic radiotherapy for lung cancer. Int J Rad Onc Biol Phys. 2008; 70: 1057-1065.
17. Glaholm J, Repetto L, Yarnold JR. Carboplatin (JM8), etoposide (VP16) and thoracic irradiation for small cell lung cancer (S.C.L.C.): An evaluation of lung toxicity. 12: 31-37
18. Palma DA. Lung density changes after stereotactic radiotherapy: a quantitative analysis in 50 patients. Int J Rad Onc Biol Phys. 1988; 81: 974-978.
19. Palma DA. A new approach to quantifying lung damage after stereotactic body radiation therapy. Acta Oncol. 2010; 50(4): 509-17. 20. Aoki T. Evaluation of lung Injury after Three-dimensional Conformal Stereotactc Radiation Therapy for solitary Lung Tumors: CT appearance. Radiology. 2003; 230: 101-108.
21. Linda A, Trovo M. Radiation injury of the lung after stereotactic body radiation therapy (SBRT) for lung cancer : A timeline and pattern of CT changes. Eur J Rad. 2011; 79: 147-154.
22. Kimura T. CT Aappearance of radiation injury of the lung and clinical symptoms after stereotactic body radiation therapy (SBRT) for lung cancers: are patients with pulmonary emphysema also candidates for SBRT for lung cancers? Int J Rad Onc Biol Phys. 2006; 66: 483-491. 23. Abratt RP (2002) Lung toxicity following chest irradiation in patients with lung cancer. Lung Cancer. 2002; 35: 103-109.
24. Jenkins P. Computed tomography appearance of early radiation injury to the ling: correlation with clinical and dosimetric factors. Int J Rad Onc Biol Phys. 2001; 81: 97-103.
25. Busse PJ, Mathur SK. Age-related changes in immune function: Effect on airway inflammation. J Allergy Clin Immunol. 2010; 126: 690-699. 26. Weiskopf D, Weinberger B, Grubeck-Loebenstein B. The aging of the immune system. Transpl Int. 2009; 22: 1041-1050.
27. Yoshikawa TT, Castle SC. Clinical relevance of age-related immune dysfunction. Clin Infect Dis. 2000; 31: 578-585.