ALMA MATER STUDIORUM
UNIVERSITA' DI BOLOGNA
SCUOLA DI SCIENZE
Corso di laurea magistrale in BIOLOGIA MARINA
Inference of Raja miraletus population structure using mitochondrial and
nuclear DNA: comparing the resolution power of molecular markers in
exploring species and population boundaries.
Tesi di laurea in Struttura e connettività delle popolazioni marine
Relatrice Presentata da
Dott.ssa Alessia Cariani Alessia Crosara
Correlatori
Alice Ferrari
Fausto Tinti
III sessione
TABLE OF CONTENTS
1. INTRODUCTION ... 1
1.1. AIMS ... 6
2. MATERIALS AND METHODS ... 7
2.1. SAMPLING... 7
2.2. DNA EXTRACTION & PCR AMPLIFICATION ... 8
2.2.1. Nuclear markers ... 8
2.2.2. Mitochondrial marker ... 9
2.3. DATA ANALYSIS ... 9
2.3.1. Nuclear markers dataset ... 9
2.3.2. Mitochondrial marker dataset assessment ... 9
2.3.3. Genetic diversity... 10
2.3.4. Population differentiation ... 10
2.4. DEMOGRAPHIC HISTORY ... 11
3. RESULTS ... 12
3.1. Nuclear and mitochondrial markers dataset assessment ... 12
3.2. Genetic diversity... 12
3.2.1. Nuclear markers polymorphism ... 12
3.2.2. Mitochondrial marker polymorphism ... 14
3.3. Population differentiation ... 15
3.4. Demographic history ... 29
4. DISCUSSION AND CONCLUSIONS ... 32
REFERENCES ... 36
APPENDIX ... 42
1 1. INTRODUCTION
The popular assumption that speciation is manifested as physical change has recently come under scrutiny, since an increasing number of marine species have been demonstrated to share analogous ecological traits and similar morphological patterns (Bickford et al. 2007). This phenomenon appears common among elasmobranchs (class Chondrichtyes), whose deep genetic partitions suggest cryptic speciation events across several taxa, as documented within Rajiformes, family Rhinobatidae (Sandoval-Castillo et al. 2004) and Rajidae (Griffiths et al. 2010), Myliobatiformes, family Myliobatidae and Dasyatidae (Pavan-Kumar et al. 2013; Henderson et al. 2015), Carcharhiniformes, family Sphyrnidae (Quattro et al. 2006) and Carcharhinidae (Ovenden et al. 2011).
Here I examined and discussed the case of Raja miraletus (L.) species complex, whose connectivity, population structure and evolutionary history suggested its tripping into past cryptic speciation.
The Brown skate is a demersal cartilaginous fish of small-medium size (from average length 20-50cm to max length 60cm; McEachran et al. 1998) belonging to the family Rajidae and superorder Batoidea. The latter diversified into Torpediniformes, Pristiformes, Myliobatiformes and Rajiformes during the Jurassic period (Tinti, 2008), when the shark body plan, typical of ancestral Neoselachians (Shirai, 1996), independently evolved into a depressed, rounded pectoral disk supported to the snout tip by fin radials (Aschliman et al. 2012).
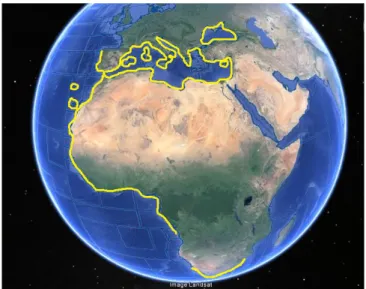
R. miraletus (etymology Raja: Latin, raja,-ae) is characterized by a wide distribution: it can be found along
the Atlantic Coasts from Spain and Morocco to South Africa and the South-West Indian Ocean (IUCN, 2009; Fig.1), within the Mediterranean Basin at a depth range between 17m and 462m (Mytilineou et al. 2005) and mostly over soft bottoms. The species inhabits also the Black Sea (Stehmann and Bürkel, 1984; Compagno and Ebert, 2007; Froese and Pauly, 2015) and has also been reported along the Northern and Southern coastline of Portugal, although nowadays its presence seems to be more and more rarefied (Serra-Pereira et al. 2010).
2
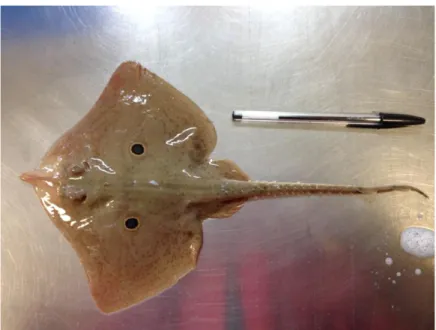
R. miraletus is recognizable by its morphology and peculiar pigmentation: the body shape is rhomboid,
starting with a slightly pointed and short snout and finishing with a long tail. The tail has small thorns, two small dorsal fins and a small caudal fin on its end. In Italy R. miraletus is commonly known as “Razza quattrocchi”, owing its name to a distinctive feature of this species: on the upper ochre-brownish surface scattered with dark spots (Stehmann and Bürkel, 1984; Compagno et al. 1989), two bright blue-purple eyespots encircled with one yellow line (ocellus) stand clearly out at the base of both pectoral fins (Fig.2). The ventral portion is white, non-pigmented and smooth.
The Brown skate has been included in the IUCN Red List of Threatened species in 2009 (Smale et al. 2009, classified as Least Concern) since, similarly to many other elasmobranchs, it is characterized by a slow reproduction rate and a low recovery after disturbance. Besides the sensitive ecological and biological traits (scarcely migratory and ovoviviparous), this species suffers from by-catch of bottom trawl fisheries, with significant differences depending on the gears and areas considered.
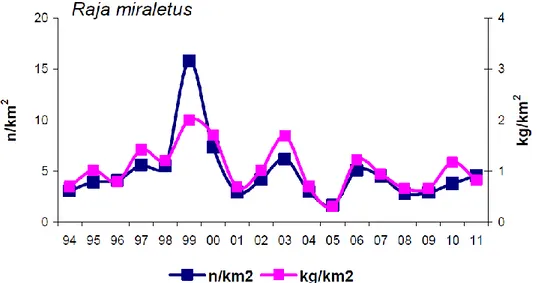
Historical data collected during GRUND and MEDITS scientific surveys between 1994 and 2011 in the Italian Waters have shown that the Brown skate has been characterized by fluctuant and generally negative abundance and biomass indices in Tuscany (FAO division 37.1.3; see Fig.3), while in Southern Adriatic (FAO division 37.2.1) sexually mature individuals have been rarely caught. R. miraletus has been collected with a 14-30% frequency along the Sardinian Coasts (FAO division 37.1.3) and with a slightly lower frequency (12-25%) in the FAO division 37.2.2, corresponding to the Sicilian Channel (data from ELASMOSTAT final report, ARPAT).
For this reasons the improvement and implementation of a species-specific stock assessment, management plans and catch monitoring are strongly recommended in order to guarantee its conservation and recovery.
Figure 2. Immature individual of R. miraletus caught in the Sicilian
3
Considering the wide distributional area of the Brown skate and both thermal gradients and currents crossings characterizing the Atlantic Coast of Africa in first place, we can distinguish three main biogeographical regions in the species range (Briggs, 1974). The North-Western region comprehends the area from the Strait of Gibraltar to Cape Blanco (21°N). Many oceanic currents from the Mediterranean Sea characterize this province (i.e. the inter-tropical Canary Current) and Cape Blanco is therefore the southern range limit for many endemic Mediterranean species. The upwelling zones of Cape Blanco and Cape Frio (18°S) bound the tropical, central region, under which the Benguela front is localized. Cape Frio receives the cold waters from the Benguela Current coming from the Antarctic. The third region ranges from Cape Frio to Cape Agulhas, where the Indian-warm Agulhas Current replaces the Benguela Current.
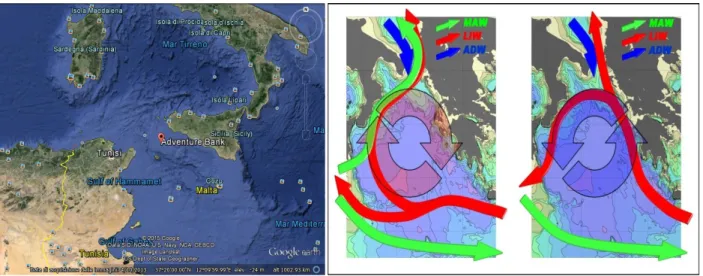
In second instance, the variety of hydrological and climatic condition found throughout the Mediterranean Sea (Bianchi and Morri, 2000) and the past and present connections with adjacent oceans and basins, e.g. with the Atlantic and Indian Oceans throughout the Gibraltar Strait and the Suez Channel respectively and with the Black Sea throughout the Bosporus-Dardanelles sill (Boero, 2003; Abdulla et al. 2008; Coll et al. 2010), could have also influenced population structuring of this species within the basin. Particular attention should be paid to the oceanographic and hydrographic discontinuities characterizing the Mediterranean Sea. The southern limit of its continental shelf can be considered a continuous couloir connecting the westernmost part of the Basin to the centre-south (Algeria, Sardinia, Tuscany and Sicily). In particular, both Sicilian Channel and Ionian Sea represents a meeting point between Western and Eastern Basin and are known to be a sensitive transition district, due to a slow replacement of water. The Sicilian Channel is a morphologically complex area because of its particular geological development, oceanographic dynamics and for the physical, chemical, biological processes characterizing it (Betroux, 1980; Manzella et al. 1988; Robinson et al. 1999; Garcia Lafuente et al. 2002). Within the Channel, two banks can be distinguished: Adventura and Maltese Bank (Fig.4a). These two submerged panhandles connect North Africa to Sicily and are crossed by two currents, the “Modified Atlantic Water” (Warn-Varnas et al. 1999) and the “Levantine Intermediate Water” (henceforth MAW and LIW; Bryden et al. 1994; Tsimplis and Bryden, 2000). The
Figure 3. Raja miraletus indices of density (n/km2) and biomass (kg/km2) estimated in the Tuscany
4
superficial circulation of the Mediterranean Sea is strongly influenced by the incoming MAW (through the Strait of Gibraltar). This current is relatively warm and slightly salty (15°C, 36.2‰). On the other hand, the density of the “Levantine Surface Water” (LSW), which increases during the winter and enhances deep mixing events, calls cold and salty water (13.5°C, 38.4‰) known as LIW (Bryden et al. 1994; Tsimplis and Bryden, 2000). In the westernmost part of the Sicilian Channel the MAW forks into the “Atlantic Ionian Stream” (AIS) which carries Atlantic warmer and less salty water towards the Ionian Sea and the “Atlantic Tunisian current” (ATC) that flows in direction of the Tunisian Coast (Robinson et al. 1999; Lermusiaux and Robinson, 2001; Beranger et al. 2005). In addition, the AIS coming from the West brings two cyclonic vortices: the first on Adventura Bank and the second around the Maltese platform, at South of Capo Passero, where the internal water temperature is much lower than the offshore waters (Dinieri, 2008; Fig.4b). This current path is responsible for an upwelling zone, affecting the surface temperature and modifying the thermocline’s structure (Lermusiaux, 1998; Robinson et al. 1999).
Since oceanographic and hydrographic discontinuities (i.e. upwelling zones) have been universally recognized as concomitant factors shaping population structure and regulating gene flow in the marine realm (Patarnello et al. 2007; Quinteiro et al. 2007; Galarza et al. 2009), this complex of transitional areas likely represents the most important migration barriers for small-sized fish and especially for the bottom dwelling elasmobranchs inhabiting the African and Mediterranean continental shelf and slope.
Twenty years after Wallace’s revision of the African skates’ taxonomy (Wallace, 1967), in which the South African R. ocellifera (Regan, 1906) population has been synonymised as R. miraletus, McEachran et al. (1989) started focusing their interest on the study of morphological characteristics of this species. In the mentioned case study, 124 specimens were collected along the Western and South African Coasts and within the Mediterranean Sea. After selecting 22 landmarks and comparing individual-based measurements, they could observe that the Gulf of Guinea-equatorial African samples partially overlapped with the Angolan sample, while the Mediterranean and South African could be considered morphologically distinct (Fig.5a
Figure 4a (left panel). Zoom on Sicilian Channel and localization of Adventura Bank and Maltese Bank. Figure 4b (right panel). Superficial and deep inversions characterizing the Ionian Waters.
5
and Fig.5b), questioning Wallace’s taxonomical incorporation of R. ocellifera into R. miraletus nominal species. As a matter of fact, the variation of meristic and morphometric characteristics of the Brown skate over this broad area supports the identification of three allopatrically or parapatrically distributed geographical populations: one inhabiting the Atlantic Coasts of South Africa, one belonging to Western Africa and one inhabiting the Mediterranean Sea (McEachran et al. 1989).
Skates and rays exhibit high levels of morphological and ecological stasis (Ebert and Compagno, 2007), which is paired with extraordinary species diversity. The complex mechanism of species evolution can be measured at different levels, morphology, genetic diversity and differentiation. R. miraletus represents another example of how strictly connected the environment, the behavioural habits and the evolutionary and ecologic drivers are.
The reported morphological variation of the Brown skate is coupled with the geographical clustering of highly divergent mitochondrial lineages (Cadinu, 2009; Cariani et al. 2010; Messinetti, 2013). At the same time high molecular divergence between populations of R. miraletus is also supported by nuclear loci (Cariani et al. 2012; Ferrari, 2012; Vinjau, 2012) that have detected strong genetic differences among geographical groups. For these reasons we hypothesized that the nominal R. miraletus likely followed cryptic speciation events, where the morphological similarity among taxa could be due to common descent (i.e. homologies), to convergent evolution (i.e. homoplasious character states), or both (Bernardo, 2011).
Figure 5a (left panel). Scatter of scores on the first two principal components of the Mediterranean and South African
samples of Raja miraletus. 1=Mediterranean sample, 5=South African sample (analysis based on 22 log-transformed morphometric ratios; figure from McEachran et al. 1989).
Figure 5b (right panel). Scatter of scores on the first two principal components of the Gulf of Guinea-equatorial African
and Angolan samples of Raja miraletus. 3=Gulf of Guinea-equatorial African sample, 4=Angolan sample (analysis based on 22 log-transformed morphometric ratios; figure from McEachran et al. 1989).
6 1.1. AIMS
On the basis of the mentioned observations I measured the genetic variation derived from both mitochondrial and nuclear markers (henceforth mtDNA and nuDNA) aiming to unravel the connectivity and the population structure of the target species Raja miraletus.
In particular I aim to investigate:
1) The species boundaries in R. miraletus complex, assessing the effectiveness of oceanographic barriers of Cape Frio and Cape Blanco;
2)The population boundaries in R. miraletus complex in Mediterranean Sea, verifying the occurrence of transitional areas or barriers to gene flow;
3)The role of ecological and environmental drivers in drawing the phylogeography of this species complex; 4)The demographical history of this species complex, assessing the origin time of its lineages/species.
7 2. MATERIALS AND METHODS
2.1. SAMPLING
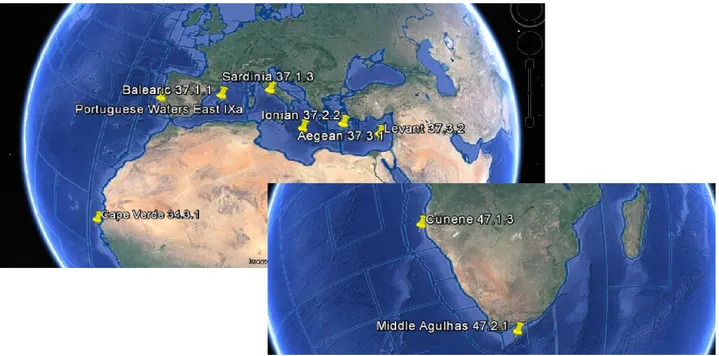
In order to extend and integrate two previously analyzed and independent datasets from Ferrari (2012) and Vinjau (2012), a dedicated sampling activity was organized in the framework of the MEDITS survey in 2014. Fin clips from 19 Raja miraletus specimens were collected in December 2014 in the Adventura Bank area (Sicilian Channel). Fin clips were cut from each individual using sterile tweezers and clippers, transferred to a clean tube with 96% ethanol and stored at -20°C for subsequent DNA analyses. The final sample size for downstream analyses consisted of 338 individuals, collected during previous research project over a broad geographical area (South African, Senegalese, Angolan and Portuguese Coasts and the whole Mediterranean Sea; refer to Tab.1 and Fig.6 for collection details).
Sampling data
FAO division Area N N
(SSR) N
(COI) Years Code Source Coordinates
Middle Agulhas 47.2.1 South Coast 8 8 5 2006 SAC/07 ST Not available
Middle Agulhas 47.2.1 South Africa 0 0 5 2007 SAC/07 BOLD 33°68'S 26°86'E
Middle Agulhas 47.2.1 South Coast 32 31 30 2011 SAC/11 ST 20°19'S 36°57'E
Cunene 47.1.3 Angola 28 26 27 2006 ANC/06 ST 12°23'S 13°22'E
Cape Verde 34.3.1 Senegal 5 5 5 2007 SEC/07 LF Not available
Portuguese Waters East IXa Portugal 10 3 11 2005, 2006, 2007 POC/07 LF 38°87'N 9°68'W
Balearic 37.1.1 Algeria 8 5 8 2002, 2003 AGC/03 LF Not available
Balearic 37.1.1 Algeria 9 8 8 2009, 2010 AGC/10 LF Not available
Balearic 37.1.1 Balearic Islands 19 16 19 2006 BIS/06 ST Not available
Sardinia 37.1.3 Northern Sardinia 11 8 11 2002, 2005 SDC/05 ST Not available
Sardinia 37.1.3 Tuscany 26 21 22 2005, 2006 TUC/06 ST Not available
Sardinia 37.1.3 Tuscany 16 13 6 2008, 2010 TUC/10 ST 43°00'N 9°44'E
Ionian 37.2.2 Sicily Channel Adventura Bank 22 22 22 2014 ADV/14 ST 37°12'N 13°20'E Ionian 37.2.2 Sicily Channel Maltese Bank 16 8 17 2000, 2002 MAL/02 ST Not available
Ionian 37.2.2 Ionian Sea 4 4 3 2004 JON/04 ST 36°40'N 15°08'E
Adriatic 37.2.1 Northern Adriatic Sea 30 8 30 2000, 2002, 2004 FNC/04 ST 43°44'N 14°50'E Adriatic 37.2.1 Northern Adriatic Sea 33 20 25 2006, 2007 FNC/07 ST 43°41'N 14°57'E Ionian 37.2.2 Southern Adriatic West 20 20 16 2001, 2004 PGC/04 ST Not available Ionian 37.2.2 Southern Adriatic East 22 20 14 2004 ABC/04 ST Not available
Aegean 37.3.1 Aegean Greece 0 0 2 2014 GRE/14 BOLD 39°12'N 23°00'E
Levant 37.3.2 Israelian Coasts 8 7 14 2009 ILC/09 LF Not available
Levant 37.3.2 Levantine Sea 11 7 11 2009 TKC/09 LF Not available
Table 1. Geographical samples and codes of Raja miraletus individuals considered in this study and corresponding FAO division
and geographical coordinate, when available. N number of individuals analysed per area. N(SSRs) number of individuals considered for nuclear markers analysis, N(COI) number of individuals considered for mitochondrial markers analysis, ST sample collected by scientific trawl, LF sample collected by fishery landings, BOLD sequence retrieved from BOLD online database (http://www.boldsystems.org).
8 2.2. DNA EXTRACTION & PCR AMPLIFICATION
Total genomic DNA (gDNA) was extracted from about 20mg of each fin clip with the Invisorb® Spin Tissue Mini Kit (Stratec® molecular) according to manufacturer’s protocol (for details visit http://www.stratec.com/en/molecular/Products_Molecular/Genomic_DNA/Invisorb_Spin_Tissue_Mini_Kit/I nvisorb_Tissue_Mini.php).
2.2.1. Nuclear markers
Eight microsatellite loci (henceforth SSR loci) isolated and characterized in related species (El Nagar et al. 2010) and optimized in R. miraletus by Ferrari (2012) were used for the amplification of the 19 newly extracted gDNAs (Tab.2 in Appendix).
The PCR reactions were performed in a 10µL total volume containing 2-3µL of gDNA corresponding to ~20ng, 2µL of PCR Buffer (1X), 0.5µL of MgCl2 (1.25mM), 0.5µL each primer (0.5µM), 0.8µL of dNTP
mix (0.05mM each) and 1U Recombinant Taq DNA Polymerase (Promega).
DNA amplifications were run on a Biometra T-Gradient Thermocycler as follows: after an initial denaturation at 94°C for 3 min, amplification was performed with 30 cycles consisting of denaturation at 94°C for 30 sec, annealing at 53°C for 30 sec, extension at 72°C for 30 sec, followed by a final extension at 72°C for 10 min. Amplicons were checked on 2% agarose gel and successfully amplified fragments were stored at -20ºC until shipping to Macrogen Europe (Amsterdam, the Netherlands). Individual genotyping was performed on ABI3100 Genetic Analyser (Applied Biosystems), using forward primers labelled and LIZ HD500 (Applied Biosystems) as internal size standard.
9 2.2.2. Mitochondrial marker
A fragment of the mitochondrial Cytochrome oxidase subunit I (COI) gene of about 650bp was amplified using the COI-3 primer cocktail (Ivanova et al. 2007; Tab.3 in Appendix) designed to increase the probability of primers’ annealing to each of strand of DNA template.
PCR reactions were performed in 50μL total volume containing 10µl of buffer Promega (1X), 5µl MgCl (2.5mM), 0.5µl of dNTP mix (0.1mM each one), 1 µl of each primer (0.2mM), 0.25U Taq DNA Polymerase (Promega) and 4µl of pure gDNA. The cycle was planned with the following thermal profile: 94°C for 2 min, 35 cycles of 94°C for 30 sec, 52°C for 40 sec, 72°C for 1 min and a final extension step at 72°C for 10 min. The PCR products were visualized on agarose gel at 2% and successfully amplified fragments were stored at -20ºC until shipping to Macrogen Europe (Amsterdam, the Netherlands). Individual Sanger sequencing was carried out on Applied Biosystems 3730xl DNA Analyzer.
2.3. DATA ANALYSIS
2.3.1. Nuclear markers dataset assessment
The 19 newly obtained chromatograms for each of the eight SSR loci were manually checked using GENEMAPPER v5.0 (Applyed Biosystems). Furthermore, I have performed the careful revision, calibration and binning of two previous datasets (Ferrari, 2012; Vinjau, 2012), building a final dataset constituted by 260 individual genotypes. The allele calling for a total of 260 individuals has been realized through GENEMAPPER. The initial scoring of alleles provided size values as two decimal numbers. The software includes, besides the possibility to process quality values (PQVs), used to identify high, medium, and low quality data, also the binning of allelic values. In other words, it assigns an integer (bin) to the scored alleles according to their length in base pairs and rounds off the raw values. This software allows avoiding the introduction of errors in the allele-calling phase that could be undertaken through the manual correction of raw data and affect the estimates of genetic diversity and differentiation. Then, ML-NullFreq (Kalinowski et al. 2006) and FreeNA (Chapuis and Estoup, 2007) were used to test for the presence of stuttering, large allele drop out and null allele’s artefacts.
2.3.2. Mitochondrial marker dataset assessment
A total of 38 forward and reverse strand electropherograms were manually edited and aligned by CLUSTAL W software (Thompson et al. 1994), incorporated into MEGA v.6.6 (Tamura et al. 2013). The correct amino acidic translation was assessed to exclude the presence of stop codons and sequencing errors (Moulton et al. 2010).
For each individual, consensus COI sequences were first compared with published sequences from both the Barcode of Life Data System (BOLD at http://www.boldsystems.org) and the NCBI (http://www.ncbi.nlm.nih.gov/genbank/) on-line databases through the BLAST algorithm (http://blast.ncbi.nlm.nih.gov/Blast.cgi) in order to rule out any error due to mishandling of samples on board
10
or during the laboratory activities. After this assessment, the newly obtained sequence were integrated in the existing dataset originated in previous research work (Cadinu, 2009; Bertucci Maresca, 2010; Vinjau, 2012). Available sequences for R. miraletus were also retrieved from both on-line databases selecting, when available, records from different geographical origins: South Africa and Aegean Sea. The retrieved sequences were integrated building a final dataset of 311 sequences.
2.3.3. Genetic diversity
The complete SSRs dataset was analysed using GENETIX v.4.05 (Belkhir et al. 2004) in order to estimate some descriptive statistics, as the observed heterozygosity (HO), expected heterozygosity (HE) Through Weir
& Cockerham’s F-statistics estimators, it was possible to apply the Jackknifing over loci to assess the single-locus effects. The deviation from the Hardy–Weinberg equilibrium (HW) was investigated using the exact tests from GENEPOP on the web v.4.2 (Rousset, 2008). The allelic richness (Ar) and the inbreeding coefficient were estimated using FSTAT v.2.9.3.2 (Goudet, 2002).
On the complete COI dataset, the number of polymorphic sites (S), the haplotype diversity (Hd), and the nucleotide diversity (π; Nei, 1987) and their standard deviations were calculated using DNASP v.5.0 (Rozas et al. 2009). The best evolutionary substitution model was assessed using MEGA following the corrected Akaike Information Criterion (AICc; Akaike, 1977) and it was applied to all subsequent analyses. ARLEQUIN v.3.5.2.2. (Excoffier et al. 2010) was used to calculate the haplotype frequencies.
2.3.4. Population differentiation
FST and ϕst distance matrices were calculated using ARLEQUIN with 10,000 permutations, P<0.05 and Tamura-Nei substitution model applied to the mtDNA dataset. The virtual spatial differentiation and genetic relationships among geographical population samples were assessed through Principal Coordinate Analysis (PCoA) and were conducted on Genotypic and Haploid Genetic Distance matrix. PCoA plots were generated using the program GenALEx v.6.5 (Peakall and Smouse, 2012). The genetic heterogeneity among the geographic samples was also assessed by the analysis of molecular variance (AMOVA, Excoffier et al. 1992). Different grouping of the geographic samples were tested, following both a priori subdivision according to sampling locations and FAO divisions as well as according to the groups revealed by the PCoA results. The adjustment of p-values has been realized through the sequential Bonferroni correction (Rice, 1989) implemented in the software SGoF+ (Carvajal-Rodriguez and de Uña-Alvarez, 2011).
In order to unravel the individual-based genetic clustering, I analysed two SRRs datasets, one considering the totality of the geographical samples and one focusing on NE Atlantic-Mediterranean samples, using the Bayesian algorithm implemented in STRUCTURE v2.3.4 (Falush et al. 2007). This analysis was carried out assuming an admixture ancestry model with the geographical origin of samples as prior information (LOCPRIOR models), associated with a correlated allele frequencies model. For each simulation of K (1-20), five independent replicates were run, setting a burn-in period of 200,000 iterations and 500,000 iterations for the MCMC. The assessment of the number of cluster K was inferred using Evanno’s Δk and
11
Pritchard’s average log probability methods (Pritchard et al. 2000, Evanno et al. 2005), both implemented in the STRUCTURE HARVESTER v.0.6.93 web application (Earl and Von Holdt, 2012).
To investigate haplotype relationships, the parsimony network was created using HAPLOVIEWER (http://www.cibiv.at/~greg/haploviewer) and the dnapars program of the PHYLIP package version 3.6 (Felsenstein, 2005).
The average genetic distances observed within and between the Atlantic African and the NE Atlantic-Mediterranean clades were calculated using MEGA and compared with inter-groups distances of homologous COI sequences (529bp) of different species of Rajidae (Raja straeleni, R. microocellata, R.
asterias, R. brachyura, R. clavata, R. montagui, R. polystigma, R. radula and R. undulata) retrieved from the
NCBI (http://www.ncbi.nlm.nih.gov/genbank/) on-line database. The best model used was the Tamura Nei model.
2.4. DEMOGRAPHIC HISTORY
The time at which the siblings African (ex R. ocellifera) and Mediterranean R. miraletus diverged was estimated using a Bayesian coalescent approach, as implemented in BEAST v1.8 (Drummond and Rambaut, 2012). In order to estimate the most recent common ancestor (TMRCA) we included the complete COI dataset and a sub-set of NE Atlantic-Mediterranean R. miraletus. A strict clock and a Yule tree prior were used. I set the normal prior distribution probabilities with mean 12 MYA for the whole COI dataset, 5.5 MYA for the NE Atlantic-Mediterranean clade and SD=1. This calibration was based on the time of rising of species diversity among the NE Atlantic and Mediterranean Sea, determined by Valsecchi et al. (2005) using mtDNA 16S sequence divergence scaled with fossil records was used by placing a normal distribution on the root height. For this analysis we applied the TN93 substitution model, as the most appropriated model inferred by MEGA software. To ensure convergence of the posterior distributions a Markov Chain Monte Carlo (MCMC) run of 30,000,000 generations sampled every 1,000 generations with the first 25% of the sampled points removed as burn-in were performed and combined subsequently in the module LOGCOMBINER (BEAST software package).
12 3. RESULTS
3.1.Nuclear and mitochondrial markers dataset assessment
The final SRRs dataset analysed for R. miraletus was constituted by 260 individuals divided in 20 geographical populations, including 19 specimens collected in the Adventura Bank, 171 Mediterranean specimens previously considered by Ferrari (2012) and 70 specimens considered by Vinjau (2012). I performed a meticulous revision, calibration and binning of the complete dataset over all eight SRRs loci. Similarly, a final dataset of 311 COI sequences over 21 geographical populations was obtained analysing new 38 forward and reverse strand electropherograms, aligning the resulting 19 consensus sequences and integrating them with those considered in Vinjau (2012).
3.2. Genetic diversity
3.2.1. Nuclear markers polymorphism
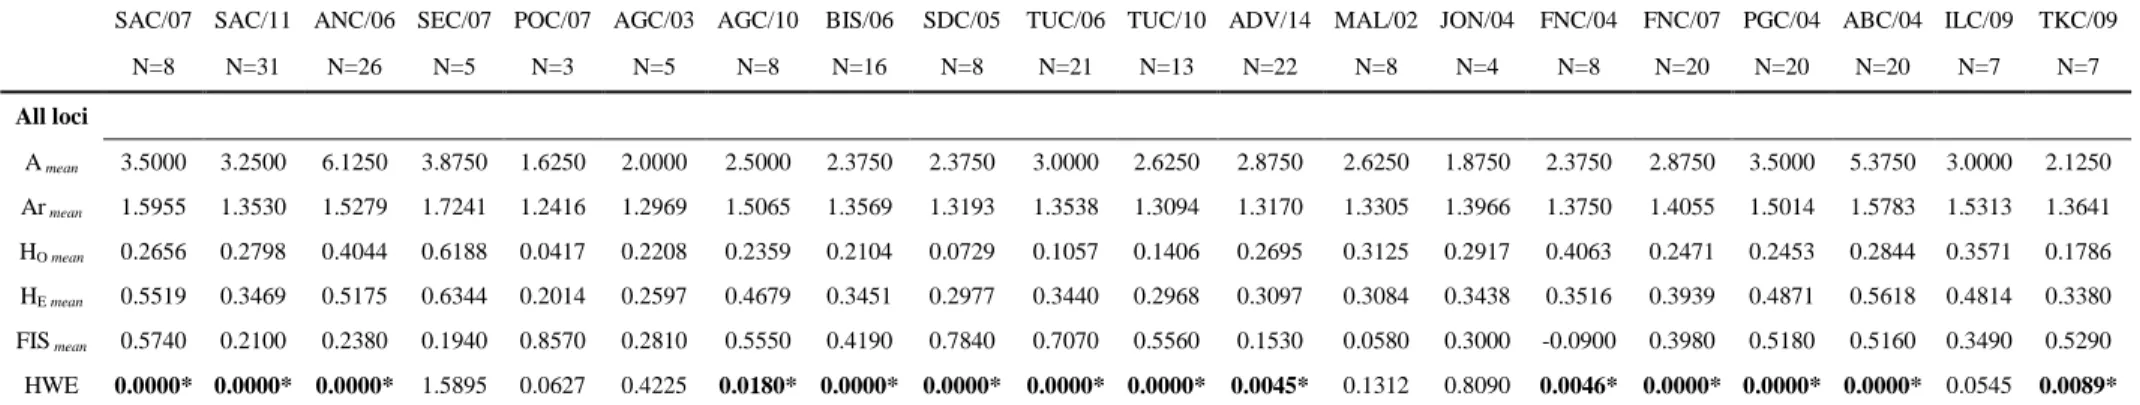
On average, all eight SSR loci were polymorphic, with a number of alleles ranging from eight (Leri34, Leri40 and Leri50) to 15 (Leri27). The allele frequencies at the 20 geographic samples are shown in Tab.Ia (in Appendix). The comparison of genetic diversity estimates in temporal replicates TUC/06 and TUC/10 revealed that locus Leri34 shifted from polymorphic to monomorphic because of alleles’ loss and the mean allelic richness showed a slight reduction (TUC/06=1.268; TUC/10=1.000, Tab.Ib).
In Tab.4, mean Allelic richness (Armean) estimates showed similar low values for each geographical sample.
The most variable sample was the SEC/07 despite the low number of individuals analysed, followed by ABC/04 and ANC/06. A low polymorphism was detected in POC/07 that exhibited five monomorphic loci (Leri26, Leri34, Leri63, Leri40 and Leri44). The Ar measured per each locus is available in Appendix, Tab.Ib.
13
SAMPLES
SAC/07 SAC/11 ANC/06 SEC/07 POC/07 AGC/03 AGC/10 BIS/06 SDC/05 TUC/06 TUC/10 ADV/14 MAL/02 JON/04 FNC/04 FNC/07 PGC/04 ABC/04 ILC/09 TKC/09
N=8 N=31 N=26 N=5 N=3 N=5 N=8 N=16 N=8 N=21 N=13 N=22 N=8 N=4 N=8 N=20 N=20 N=20 N=7 N=7 All loci A mean 3.5000 3.2500 6.1250 3.8750 1.6250 2.0000 2.5000 2.3750 2.3750 3.0000 2.6250 2.8750 2.6250 1.8750 2.3750 2.8750 3.5000 5.3750 3.0000 2.1250 Ar mean 1.5955 1.3530 1.5279 1.7241 1.2416 1.2969 1.5065 1.3569 1.3193 1.3538 1.3094 1.3170 1.3305 1.3966 1.3750 1.4055 1.5014 1.5783 1.5313 1.3641 HO mean 0.2656 0.2798 0.4044 0.6188 0.0417 0.2208 0.2359 0.2104 0.0729 0.1057 0.1406 0.2695 0.3125 0.2917 0.4063 0.2471 0.2453 0.2844 0.3571 0.1786 HE mean 0.5519 0.3469 0.5175 0.6344 0.2014 0.2597 0.4679 0.3451 0.2977 0.3440 0.2968 0.3097 0.3084 0.3438 0.3516 0.3939 0.4871 0.5618 0.4814 0.3380 FIS mean 0.5740 0.2100 0.2380 0.1940 0.8570 0.2810 0.5550 0.4190 0.7840 0.7070 0.5560 0.1530 0.0580 0.3000 -0.0900 0.3980 0.5180 0.5160 0.3490 0.5290 HWE 0.0000* 0.0000* 0.0000* 1.5895 0.0627 0.4225 0.0180* 0.0000* 0.0000* 0.0000* 0.0000* 0.0045* 0.1312 0.8090 0.0046* 0.0000* 0.0000* 0.0000* 0.0545 0.0089* Table 4. Summary statistics of the SSR polymorphism per geographical sample and over all the loci considered. Amean mean number of alleles, Armean mean allelic richness, HO mean mean
14
The comparisons between the expected (HE) and observed (HO) heterozygosity showed that He was higher
than HO in most samples and a significant deviation from HW equilibrium was detected in almost all
samples, even after Bonferroni correction (Tab.4). The deviation from HW equilibrium was ascribed by low polymorphism and deficit of heterozygosity as confirmed by medium-high FIS values.
Ml-Nullfreq and FreeNA results detected the presence of null alleles at loci Leri40, Leri50 and Leri44. Nevertheless we did not exclude any of them, since Jackknife analysis didn’t reveal outliers over the confidence interval (Fig.7).
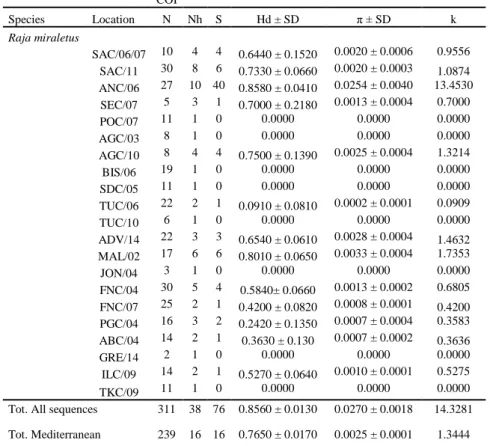
3.2.2. Mitochondrial marker polymorphism
The COI polymorphism among 21 geographical samples and 311 sequences showed low nucleotide diversity (π), and very high haplotype diversity (Hd). The majority of samples showed medium-high values of Hd (Tab.5). ANC/06 showed the highest polymorphism, k estimate (13.453) and Nh (10), followed by ALG/10, ADV/14 and MAL/02. These geographical populations showed high values of Hd and π in relation to other samples. In general, the samples belonging to Eastern Mediterranean (JON/04, FNC/04, FNC/07, PGC/04, ABC/04, GRE/14, ILC/09, TKC/09) showed lower Nh, Hd and π values than those form NE Atlantic and Western Mediterranean (POC/07, AGC/03, AGC/10, BIS/06, SDC/05, TUC/06 and TUC/10). From the geographical distribution of the 38 haplotypes African and NE Atlantic-Mediterranean samples did not share any haplotype (Appendix, Tab.II). Hap_24 appeared common to 11 Mediterranean samples. The majority of haplotypes (26) was detected in turn in only one population.
0.3000 0.3500 0.4000 0.4500 0.5000 0.5500
Leri27 Leri26 Leri24 Leri34 Leri63 Leri50 Leri40 Leri44
Co n fid en ce in terv al o f F S T v alu es SSRs loci
15 COI Species Location N Nh S Hd ± SD π ± SD k Raja miraletus SAC/06/07 10 4 4 0.6440 ± 0.1520 0.0020 ± 0.0006 0.9556 SAC/11 30 8 6 0.7330 ± 0.0660 0.0020 ± 0.0003 1.0874 ANC/06 27 10 40 0.8580 ± 0.0410 0.0254 ± 0.0040 13.4530 SEC/07 5 3 1 0.7000 ± 0.2180 0.0013 ± 0.0004 0.7000 POC/07 11 1 0 0.0000 0.0000 0.0000 AGC/03 8 1 0 0.0000 0.0000 0.0000 AGC/10 8 4 4 0.7500 ± 0.1390 0.0025 ± 0.0004 1.3214 BIS/06 19 1 0 0.0000 0.0000 0.0000 SDC/05 11 1 0 0.0000 0.0000 0.0000 TUC/06 22 2 1 0.0910 ± 0.0810 0.0002 ± 0.0001 0.0909 TUC/10 6 1 0 0.0000 0.0000 0.0000 ADV/14 22 3 3 0.6540 ± 0.0610 0.0028 ± 0.0004 1.4632 MAL/02 17 6 6 0.8010 ± 0.0650 0.0033 ± 0.0004 1.7353 JON/04 3 1 0 0.0000 0.0000 0.0000 FNC/04 30 5 4 0.5840± 0.0660 0.0013 ± 0.0002 0.6805 FNC/07 25 2 1 0.4200 ± 0.0820 0.0008 ± 0.0001 0.4200 PGC/04 16 3 2 0.2420 ± 0.1350 0.0007 ± 0.0004 0.3583 ABC/04 14 2 1 0.3630 ± 0.130 0.0007 ± 0.0002 0.3636 GRE/14 2 1 0 0.0000 0.0000 0.0000 ILC/09 14 2 1 0.5270 ± 0.0640 0.0010 ± 0.0001 0.5275 TKC/09 11 1 0 0.0000 0.0000 0.0000
Tot. All sequences 311 38 76 0.8560 ± 0.0130 0.0270 ± 0.0018 14.3281 Tot. Mediterranean 239 16 16 0.7650 ± 0.0170 0.0025 ± 0.0001 1.3444
3.3. Population differentiation
It is important to note that small sample sizes, as those we deal with in several geographical samples, decrease the power of the analyses and consequently reduce the ability to detect significant population structure (Chevolot et al. 2006b); therefore, appropriate caution should be used in interpreting the results obtained. However, similar experimental designs and analytical approaches proved geographical population structure and genetic differentiation at multiple taxonomic levels in other skates (Chevolot et al. 2006a; Plank et al. 2010; Pasolini et al. 2011).
The analysis of genetic differentiation among 20 samples based on SSRs data showed significant pair-wise FST values (P<0.05), even after Bonferroni correction (Tab.6).
Table 5. mtDNA polymorphism and its parameters. Nh number of haplotypes, Hd haplotype diversity, π nucleotide diversity, k
16
SAC/06 SAC/11 ANC/06 SEC/07 POC/07 AGC/03 AGC/10 BIS/06 SDC/05 TUC/06 TUC/10 ADV/14 MAL/02 JON/04 FNC/04 FNC/07 PGC/04 ABC/04 ILC/09 TKC/09 SAC/06 * 0.1524 0.2038 0.0178* 0.0048* 0.0006* 0.0005* 0.0000* 0.0035* 0.0000* 0.0000* 0.0000* 0.0002* 0.0082* 0.0160* 0.0000* 0.0000* 0.0000* 0.0000* 0.0005* SAC/11 0.0802 * 0.0000* 0.0117* 0.0003* 0.0000* 0.0000* 0.0000* 0.0000* 0.0000* 0.0000* 0.0000* 0.0000* 0.00099* 0.0067* 0.0000* 0.0000* 0.0000* 0.0001* 0.0000* ANC/06 0.0457 0.1965* * 0.0019* 0.0001* 0.0000* 0.0000* 0.0000* 0.0000* 0.0000* 0.0000* 0.0000* 0.0000* 0.0000* 0.0001* 0.0000* 0.0000* 0.0000* 0.0000* 0.0000* SEC/07 0.1926* 0.2246* 0.2559* * 0.0198* 0.0062* 0.0146* 0.0004* 0.0137* 0.0001* 0.0003* 0.0000 0.0004* 0.0071* 0.1738 0.0015* 0.0032* 0.0660 0.0687 0.0445* POC/07 0.5409* 0.4944* 0.5134* 0.4339* * 0.9999 0.9999 0.5704 0.7785 0.6497 0.9999 0.9999 0.9999 0.0290* 0.1260 0.0005* 0.0021* 0.0012* 0.0077* 0.0090* AGC/03 0.5952* 0.5183* 0.5392* 0.5139* 0.0000 * 0.9999 0.5322 0.4875 0.4220 0.9999 0.9999 0.9999 0.0085* 0.0207* 0.0000* 0.0001* 0.0001* 0.0042* 0.0011* AGC/10 0.5190* 0.4684* 0.4903* 0.3903* -0.0260 0.0252 * 0.9999 0.9999 0.8716 0.7511 0.2631 0.9999 0.0052* 0.0299* 0.0000* 0.0000* 0.0000* 0.0012* 0.0003* BIS/06 0.5697* 0.5012* 0.5249* 0.4554* -0.0190 0.0231 -0.0492 * 0.3129 0.7832 0.4702 0.0822 0.2547 0.0001* 0.0004* 0.0000* 0.0000* 0.0000* 0.0000* 0.0000* SDC/05 0.4496* 0.4115* 0.3988* 0.3725* 0.0857 0.1444 0.0095 0.0244 * 0.2488 0.2827 0.1175 0.4694 0.0076* 0.0859 0.0000* 0.0000* 0.0002* 0.00198* 0.0007* TUC/06 0.6103* 0.5199* 0.5455* 0.5186* -0.0173 0.0226 -0.0408 -0.0243 0.0309 * 0.7082 0.0767 0.2894 0.0002* 0.0002* 0.0000* 0.0000* 0.0000* 0.0000* 0.0000* TUC/10 0.6074* 0.5212* 0.5444* 0.5289* -0.0721 -0.0301 -0.0198 -0.0056 0.0447 -0.0212 * 0.5359 0.4976 0.0014* 0.0012* 0.0000* 0.0000* 0.0000* 0.0000* 0.0000* ADV/14 0.7755* 0.6080* 0.6399* 0.7507* 0.0000 0.0000 0.1089 0.0725 0.3112 0.0634 -0.0138 * 0.9999 0.0002* 0.0001* 0.0000* 0.0000* 0.0000* 0.0000* 0.0000* MAL/02 0.6524* 0.5438* 0.5675* 0.5937* 0.0000 0.0000 0.0667 0.0529 0.2000 0.0495 -0.0034 0.0000 * 0.0020* 0.0069* 0.0000* 0.0000* 0.0000* 0.0004* 0.0002* JON/04 0.3553* 0.3770* 0.3895* 0.3538* 0.6778* 0.7428* 0.6072* 0.6380* 0.5826* 0.6756* 0.6864* 0.8973* 0.8012* * 0.3910 0.0001* 0.0001* 0.0000* 0.0118* 0.0149* FNC/04 0.1644* 0.1945* 0.2326* 0.1177 0.2829 0.3462* 0.2831* 0.3448* 0.2130 0.3695* 0.3646* 0.5622* 0.4121* 0.0761 * 0.0000* 0.0002* 0.0014* 0.0294* 0.0084* FNC/07 0.6137* 0.5327* 0.5295* 0.4598* 0.8303* 0.8432* 0.7828* 0.7801* 0.7652* 0.7979* 0.8141* 0.8979* 0.8587* 0.7527* 0.5093* * 0.7516 0.0201* 0.1930 0.4823 PGC/04 0.5847* 0.5166* 0.5117* 0.4148* 0.7896* 0.8053* 0.7448* 0.7473* 0.7232* 0.7669* 0.7807* 0.8714* 0.8239* 0.7187* 0.4726* -0.0162 * 0.0411* 0.3014 0.4781 ABC/04 0.3241* 0.3525* 0.3168* 0.1122 0.5402* 0.5696* 0.5143* 0.5510* 0.4691* 0.5788* 0.5779* 0.6865* 0.6025* 0.4690* 0.2445* 0.0817* 0.0662* * 0.4846 0.1973 ILC/09 0.3766* 0.3840* 0.3709* 0.1699 0.6063* 0.6601* 0.5722* 0.6106* 0.5374* 0.6503* 0.6541* 0.8273* 0.7154* 0.4910* 0.2157* 0.0625 0.0193 -0.0053 * 0.5846 TKC/09 0.4886* 0.4545* 0.4449* 0.3265* 0.8178* 0.8472* 0.7523* 0.7613* 0.7370* 0.7917* 0.8064* 0.9312* 0.8765* 0.6317* 0.3579* 0.0201 0.0286 0.0495 0.0250 *
17
Medium-high and significant pair-wise fixation index (P<0.05) testified a clear differentiation between two main macro-areas: the Atlantic African Coasts and NE Atlantic-Mediterranean Sea.
At the same time, within the NE Atlantic-Mediterranean samples, high and significant values were found. As a matter of fact, the Western Mediterranean (POC/07, AGC/03, AGC/10, BIS/06, SDC/05, TUC/06, TUC/10, ADV/14 and MAL/02) is significantly different from Eastern Mediterranean (FNC/07, PGC/04, ABC/04, ILC/09 and TKC/09).
Differently, the comparison within FNC/07, PGC/04, ABC/04, ILC/09 and TKC/09 was not significant. The comparison of population differentiation estimates in temporal replicates AGC/03, AGC/10 and TUC/06, TUC/10 revealed low and not-significant FST values.
Furthermore, also the genetic differentiation among 21 samples based on COI data showed significant pair-wise Фst values, even after Bonferroni correction (P<0.05; Tab.7). Фst values were in most cases more informative than those showed by the FST pair-wise matrix in detecting more genetic differentiations within the Western Mediterranean and the Eastern Basins. As a matter of fact, differently from FST values, Фst highlighted high and significant values within FNC/07, PGC/04, ABC/04, ILC/09 and TKC/09.
Coherently, the deeper differentiation was observed between Atlantic Africa and NE Atlantic-Mediterranean samples, but also between Western and Eastern Mediterranean.
18
SAC/06/07 SAC/11 ANC/06 SEC/07 POC/07 AGC/03 AGC/10 BIS/06 SDC/05 TUC/06 TUC/10 ADV/14 MAL/02 JON/04 FNC/04 FNC/07 PGC/04 ABC/04 GRE/14 ILC/09 TKC/09 SAC/06/07 * 0.6436 0.0002* 0.0003* 0.0000* 0.0001* 0.0001* 0.0000* 0.0000* 0.0000* 0.0001* 0.0000* 0.0000* 0.0038* 0.0000* 0.0000* 0.0000* 0.0000* 0.0178* 0.0000* 0.0000* SAC/11 -0.0252 * 0.0000* 0.0000* 0.0000* 0.0000* 0.0000* 0.0000* 0.0000* 0.0000* 0.0000* 0.0000* 0.0000* 0.0000* 0.0000* 0.0000* 0.0000* 0.0000* 0.0029* 0.0000* 0.0000* ANC/06 0.3101* 0.4147* * 0.0001* 0.0000* 0.0000* 0.0000* 0.0000* 0.0000* 0.0000* 0.0000* 0.0000* 0.0000* 0.0002* 0.0000* 0.0000* 0.0000* 0.0000* 0.0027* 0.0000* 0.0000* SEC/07 0.9441* 0.9346* 0.4988* * 0.0003* 0.0006* 0.0005* 0.0001* 0.0002* 0.0000* 0.0022* 0.0000* 0.0000* 0.0177* 0.0000* 0.0000* 0.0000* 0.0000* 0.0476* 0.0001* 0.0002* POC/07 0.9878* 0.9784* 0.7352* 0.9951* * 0.9999 0.0155* 0.0000* 0.0000* 0.0000* 0.0000* 0.0002* 0.0001* 0.0028* 0.0000* 0.0000* 0.0000* 0.0000* 0.0114* 0.0000* 0.0000* AGC/03 0.9856* 0.9767* 0.7161* 0.9938* 0.0000 * 0.0733 0.0000* 0.0000* 0.0000* 0.0003* 0.0022* 0.0004* 0.0069* 0.0000* 0.0000* 0.0000* 0.0000* 0.0199* 0.0000* 0.0000* AGC/10 0.9707* 0.9702* 0.7127* 0.9740* 0.3041* 0.2446 * 0.0001* 0.0010* 0.0001* 0.0864 0.0749 0.0426* 0.0224* 0.0003* 0.0001* 0.0000* 0.0000* 0.0646 0.0000* 0.0000* BIS/06 0.9917* 0.9826* 0.7808* 0.9970* 1.0000* 1.0000* 0.4161* * 0.9999 0.9999 0.9999 0.0000* 0.0000* 0.0008* 0.0000* 0.0000* 0.0000* 0.0000* 0.0043* 0.0000* 0.0000* SDC/05 0.9882* 0.9791* 0.7427* 0.9953* 1.0000* 1.0000* 0.3041* 0.0000 * 0.9999 0.9999 0.0021* 0.0031* 0.0011* 0.0004* 0.0000* 0.0000* 0.0004* 0.0112* 0.0000* 0.0000* TUC/06 0.9908* 0.9826* 0.7907* 0.9955* 0.9421* 0.9361* 0.3993* -0.0069 -0.0359 * 0.9999 0.0000* 0.0000* 0.0005* 0.0000* 0.0000* 0.0000* 0.0000* 0.0040* 0.0000* 0.0000* TUC/10 0.9840* 0.9760* 0.7092* 0.9926* 1.0000* 1.0000* 0.1928 0.0000 0.0000 -0.0845 * 0.0356* 0.0393* 0.0136* 0.0047* 0.0025* 0.0005* 0.0020* 0.0348* 0.0000* 0.0001* ADV/14 0.9661* 0.9677* 0.7757* 0.9686* 0.4922* 0.4601* 0.1375 0.4048* 0.3384* 0.4107* 0.2754* * 0.5547 0.2332 0.0004* 0.0004* 0.0003* 0.0039* 0.4062 0.0000* 0.0000* MAL/02 0.9628* 0.9662* 0.7583* 0.9644* 0.5335* 0.4965* 0.1653* 0.3753* 0.2993* 0.3824* 0.2264* -0.0231 * 0.2191 0.0018* 0.0017* 0.0013* 0.0071* 0.4545 0.0000* 0.0000* JON/04 0.9803* 0.9745* 0.6872* 0.9893* 1.0000* 1.0000* 0.6034* 1.0000* 1.0000* 0.9601* 1.0000* 0.1940 0.1316 * 0.0004* 0.0000* 0.0011* 0.0030* 0.1051 0.0016* 0.0036* FNC/04 0.9809* 0.9775* 0.8115* 0.9842* 0.7310* 0.7133* 0.3733* 0.4793* 0.4244* 0.4737* 0.3738* 0.2321* 0.1728* 0.6165* * 0.5742 0.1160 0.4872 0.6335 0.0000* 0.0000* FNC/07 0.9855* 0.9800* 0.8013* 0.9893* 0.8350* 0.8212* 0.4834* 0.6788* 0.6273* 0.6565* 0.5812* 0.2684* 0.2050* 0.7222* -0.0177 * 0.1597 0.7201 0.5759 0.0000* 0.0000* PGC/04 0.9851* 0.9787* 0.7700* 0.9900* 0.8906* 0.8771* 0.5410* 0.8231* 0.7774* 0.7896* 0.7327* 0.2914* 0.2259* 0.7515* 0.0627 0.0187 * 0.6474 0.9999 0.0000* 0.0000* ABC/04 0.9846* 0.9781* 0.7606* 0.9898* 0.8866* 0.8713* 0.4815* 0.7999* 0.7456* 0.7574* 0.6912* 0.2478* 0.1805* 0.7579* -0.0069 -0.0470 -0.0353 * 0.9999 0.0000* 0.0000* GRE/14 0.9783* 0.9736* 0.6699* 0.9872* 1.0000* 1.0000* 0.3715 1.0000* 1.0000* 0.9187* 1.0000* 0.1200 0.0107 1.0000 -0.0608 -0.0817 -0.2871 -0.1756 * 0.0078* 0.0128 ILC/09 0.9834* 0.9785* 0.7746* 0.9876* 0.9334* 0.9240* 0.7973* 0.9350* 0.9141* 0.9252* 0.8922* 0.7099* 0.6849* 0.8717* 0.7841* 0.8306* 0.8330* 0.8321* 0.8069* * 0.0000* TKC/09 0.9888* 0.9802* 0.7567* 0.9955* 1.0000* 1.0000* 0.7853* 1.0000* 1.0000* 0.9702* 1.0000* 0.6030* 0.5665* 1.0000* 0.6866* 0.7815* 0.8234* 0.8342* 1.0000 0.9139* *
19
The average genetic distance within groups of individuals belonging to the NE Atlantic-Mediterranean clade was very low (0.0025), indicating a certain degree of homogeneity. The same could not be observed within the Atlantic African clade (0.0187).
The inter-specific distances between the other skates species (Tab.8) have showed ranging values from Minimum 0.015 for the recently diverged species Raja clavata-R. straeleni and R. montagui-R. polystigma to Maximum 0.088 for R. asterias-R. microocellata. A high value (0.073) was exhibited by the relationship with R. undulata the species more phylogenetically distant between all (Messinetti, 2013).
Two PCoA (Principal Coordinate Analysis) based on the Genetic Distance matrix, computed on the SSRs dataset, were performed to assess the virtual spatial differentiation among geographical populations (Fig.8 and Fig.9).
PCo1 and PCo2 explained most of the variation (Fig.8: 71.87%; Fig.9: 66.77%). The PCo1 reported in Fig.8 showed a pattern of differentiation where the African samples (SAC/06, SAC/11, ANC/06 and SEC/07) are the most divergent from NE Atlantic and Western Mediterranean ones (POC/07, AGC/03, AGC/10, BIS/06, SDC/05, TUC/06 TUC/10, ADV/14 and MAL/02), while the Eastern Mediterranean (JON/04, FNC/04, FNC/07, PGC/04, ABC/04, ILC/09, TKC/09) are differentiated from the others according to PCo2.
Zooming inside the Mediterranean Basin (Fig.9) the PCo1 revealed a strong differentiation between NE Atlantic-Western and Eastern Mediterranean samples, with the exception of FNC/07 and JON/04, which are located in the transition between the two main groups.
Raja_straeleni Raja_microocellata 0.060 Raja_asterias 0.060 0.088 Raja_brachyura 0.060 0.045 0.088 Raja_clavata 0.015 0.060 0.060 0.052 Raja_montagui 0.058 0.062 0.082 0.058 0.050 Raja_polystigma 0.056 0.064 0.080 0.051 0.052 0.021 Raja_radula 0.029 0.067 0.050 0.071 0.029 0.064 0.062 Raja_undulata 0.073 0.080 0.077 0.071 0.073 0.077 0.071 0.075
Raja_straeleni Raja_microocellata Raja_asterias Raja_brachyura Raja_clavata Raja_montagui Raja_polystigma Raja_radula Raja_undulata
20
At the same way, PCoA (Principal Coordinate Analysis) based on the Haploid Genetic Distance, computed on the COI dataset, were performed (Fig.10 and Fig.11). Fig.10 showed a pattern of differentiation of two main groups: Atlantic Africa versus NE Atlantic-Mediterranean Sea, The PCo1 explained most of the variation (82.61%) and a total differentiation of the Senegalese sample (SEC/07).
The best performing PCoA was obtained comparing only the NE Atlantic-Mediterranean populations (Fig.11). The scatter plot showed three subgroups distributed along the PCo1, which explained 45.4% of variance. The differentiation between NE Atlantic-Western Mediterranean and Eastern Mediterranean was clear. According to PCo2, ILC/09 was the most differentiated sample.
SAC/06 SAC/11 ANC/06 SEC/07 POC/07 AGC/03 AGC/10 BIS/06TUC/06SDC/05 TUC/10 ADV/14MAL/02 JON/04 FNC/04 FNC/07 PGC/04ABC/04 ILC/09 TKC/09 PCo 2 ( 27. 16% ) PCo1 (44.71%)
Principal Coordinates (PCoA)
POC/07 AGC/03 AGC/10 BIS/06 SDC/05 TUC/06 TUC/10 ADV/14MAL/02 JON/04 FNC/04 FNC/07 PGC/04ABC/04 ILC/09 TKC/09 PCo 2 ( 14. 88% ) PCo1 (53.89%)
Principal Coordinates (PCoA)
Figure 8. Plot describing the PCoA carried out on Genotypic Genetic Distance matrix over all geographical samples.
Figure 9. Plot describing the PCoA carried out on the Genotypic Genetic Distance matrix of NE Atlantic and Mediterranean
21
The AMOVA analysis was performed on both SRRs and COI markers, testing three different sample groupings, set on the basis of geographical location of samples (FAO divisions) and on the PCoA results (Tab.9).
AMOVA1 was carried out over all samples, divided in two main groups defined on the geographic distance as: Atlantic Africa versus NE Atlantic-Mediterranean Sea (FAO divisions: Middle Agulhas, Cunene, Cape Verde versus Portuguese Waters East, Balearic, Sardinian, Ionian, Adriatic, Aegean, Levant).
AMOVA1 calculated on COI marker showed the highest and statistically significant percentage of molecular variation among groups (90.22%; FCT=0.90, P=0.0002).
SAC/06/07 SAC/11 ANC/06 SEC/07 POC/07 AGC/03 AGC/10 BIS/06 SDC/05 TUC/06 TUC/10 ADV/14 MAL/02 JON/04 FNC/07 FNC/04 PGC/04 ABC/04 ILC/09 GRE/14 TKC/09 PCo 2 ( 7.9 9% ) PCo1 (82.61%)
Principal Coordinates (PCoA)
POC/07 AGC/03 AGC/10 BIS/06 SDC/05 TUC/06 TUC/10 ADV/14 MAL/02 JON/04 FNC/04 FNC/07 PGC/04 ABC/04 ILC/09 GRE/14 TKC/09 PCo 2 ( 21. 46% ) PCo1 (45.40 %)
Principal Coordinates (PCoA)
Figure 11. Plot describing the PCoA carried out on the Haploid Genetic Distance of NE Atlantic and Mediterranean samples. Figure 10. Plot describing the PCoA carried out on the Haploid Genetic Distance over all geographical samples.
22
AMOVA2 calculated on COI marker and two groups determined in view of the PCoA results carried out on the Genotypic Genetic Distance matrix (Portuguese Waters East, Balearic, Sardinian, Adventura and Maltese Bank versus Adriatic, Ionian, Aegean, Levant) showed 32.03% of variation among groups (FSC= 0.3203, P=0.0000; Fig.9). The same comparison calculated on SRRs markers showed a higher variation (more than 60%) and statistically significant value (FCT=0.6065, P=0.0000) among groups.
AMOVA3 focused on the Atlantic African samples and compared three groups: Middle Agulhas versus Cunene versus Cape Verde. Low/no variation was observed at any of the AMOVA levels, probably because of the small sample size (N) characterizing SEC/07.
23
AMOVA–Groupings SSRs AMOVA–Groupings COI
AMOVA1-All samples, two groups: Atlantinc Africa vs NE
Atlantic-Mediterranean Sea
(Middle Aghulas, Cunene, Cape Verde) vs (Portuguese Waters East, Balearic, Sardinian,
Jonian, Adriatic, Levant)
AMOVA1-All samples, two groups: Atlantinc Africa vs NE
Atlantic-Mediterranean Sea
(Middle Aghulas, Cunene, Cape Verde) vs (Portuguese Waters East, Balearic, Sardinian, Jonian,
Adriatic, Aegean, Levant)
Total variation
(%) F statistics P
Total variation
(%) ϕ statistics P
Among groups 22.2600 FCT 0.2226 0.0169+-0.0014 Among groups 90.2200 FCT 0.9022 0.0002+-0.0001
Among population within groups 36.3200 FSC 0.4672 0.0000+-0.0000 Among population within groups 4.7900 FSC 0.4903 0.0000+-0.0000
Within population 41.4200 FST 0.5858 0.0000+-0.0000 Within population 4.9800 FST 0.9502 0.0000+-0.0000
AMOVA–Groupings SSRs AMOVA–Groupings COI
AMOVA2- two groups: NE Atlantic-West Med vs East Med
(Portuguese Waters East, Sardinian, Adventura e Maltese Bank) vs (Adriatic, Jonian, Levant)
AMOVA2- two groups: NE Atlantic-West Med vs East Med
(Portuguese Waters East, Sardinian, Adventura e Maltese Bank) vs (Adriatic, Jonian, Aegean, Levant)
Total variation
(%) F statistics P
Total variation
(%) ϕ statistics P
Among groups 60.6500 FCT 0.6065 0.0000+-0.0000 Among groups 32.0300 FCT 0.3203 0.0000+-0.0000
Among population within groups 7.9900 FSC 0.2029 0.0000+-0.0000 Among population within groups 35.0600 FSC 0.5157 0.0000+-0.0000
Within population 31.3600 FST 0.6864 0.0000+-0.0000 Within population 32.9200 FST 0.6708 0.0000+-0.0000
AMOVA–Groupings SSRs AMOVA–Groupings COI
AMOVA3-three groups belonging
to the Atlantic Africa (Middle Aghulas) vs (Cunene) vs (Cape Verde)
AMOVA3-three groups belonging
to the Atlantic Africa (Middle Aghulas) vs (Cunene) vs (Cape Verde)
Total variation
(%) F statistics P
Total variation
(%) ϕ statistics P
Among groups 11.4600 FCT 0.1146 0.3293+-0.0049 Among groups 57.1700 FCT 0.5717 0.1683+-0.0036
Among population within groups 7.1000 FSC 0.0802 0.1538+-0.0037 Among population within groups -2.7000 FSC -0.0630 0.6451+-0.0045
Within population 81.4400 FST 0.1857 0.0000+-0.0000 Within population 45.5200 FST 0.5448 0.0000+-0.0000
24
The parsimony network of the COI haplotypes in Fig.12 identified two main macro-haplogroups, coherently with the boundaries between geographical samples assessed by SSRs analysis. A clear differentiation between the Atlantic African and the NE Atlantic-Mediterranean samples was unequivocal.
Considering the South-Atlantic African haplogroup, it was characterized by shared haplotypes belonging to Middle Agulhas samples. The latter were separated by one mutation from the haplotype belonging to Cunene, while private haplotypes were observed in Cape Verde and Cunene divisions respectively.
A total of 16 mutations separated the African R. miraletus (ex. R. ocellifera) from the NE Atlantic-Mediterranean R. miraletus haplogroup. Among the latter, at a phylogeographical level, the largest haplotype was shared by a high number of individuals coming from both Western and Eastern Mediterranean Basin (FAO divisions: Balearic, Sardinia, Ionian, Adriatic) including Adventura and Maltese Bank.
Balearic and Sardinia divisions showed well-defined haplotypes within the largest Mediterranean haplogroup, while a smaller one reunited the Portuguese Waters, Balearic and Ionian divisions.
A third haplogroup embraced individuals of Eastern Mediterranean Basin (Ionian, Adriatic and Aegean divisions), including an unusually haplotype of Maltese Bank. Balearic and Ionian divisions shared a fourth haplotype, while two more haplotypes belonging to Levant area resulted independent.
Focusing on the NE Atlantic-Mediterranean haplogroup a slight differentiation was observed, a part of Balearic division and Ionian were the most frequent haplotypes, which appeared to be shared more than once within the Mediterranean haplogroup.
This pattern could be considered as a signal that the southern limit of Mediterranean continental shelf could fulfil the role of a continuous couloir connecting the westernmost part of the Basin to the centre-south (a part of Balearic, Sardinia and Ionian division). Similarly Ionian (JON/04), which appeared to be an admixed area when referring to the nuDNA signal, fell into the Algerian-Sicilian couloir. Splitting between the West and the East Mediterranean can be also seen considering the haplotypes. The most common haplotype (90 individuals) mainly embraced the samples of the West Mediterranean. The 62 individuals haplotype included the Adriatic samples and a two individuals from Greece. The 21 individuals haplotype incorporated a part of the Sicilian Channel samples, while the remaining part was shared between 31 individuals including the Portuguese and the two Algerian samples.
25
Figure 12. Statistical parsimony network of the COI haplotypes of Atlantic African and NE Atlantic-Mediterranean Raja miraletus. The
confidence interval was at 95%. Numbers in circles represent the number of individuals that share a determinate haplotype. The size of the circles is proportional to the number of individuals that shared that haplotype.
26
The population structure of R. miraletus was also investigated with a Bayesian clustering analysis implemented in the software STRUCTURE and assessed with STRUCTURE Harvester, which identified K=3 and K=4 as the most appropriate K according to the Pritchard criterion considering the trend of LnP(K) (Fig.13a), while according to Evanno et al. (2005) the true value of K is K=2 (Fig.13b).
Here I report clustering barplots for K=2, 3, 4 (Fig.14). With K=2 samples clearly divided into two main groups: Atlantic Africa and NE-Atlantic Mediterranean Sea. In particular, SEC/07 showed admixing genetic composition of the two clusters. With K=3 the clustering highlighted a deeper differentiation between Atlantic Africa, NE Atlantic-Western Mediterranean and Eastern Mediterranean samples. SEC/07 still showed similar admixing pattern as for K=2 and a new admixing area between the two Mediterranean clusters appeared for the sample JON/04. With K=4, ANC/06 showed a high level of admixture of two genetic components, one shared with SAC/11and SAC/06 and the other belonging to SEC/07. The latter seemed to be completely independent, while the Western-Eastern Mediterranean subdivision remained mostly unvaried. Nevertheless, in light of the PCoA and AMOVA results, a deeper analysis was needed.
Therefore, the same analysis was coherently applied on a subset of 190 individuals, divided in 16 geographic samples, belonging to the NE Atlantic and Mediterranean samples.
STRUCTURE Harvester identified K=3, K=4 and K=5 as the most appropriate K according to the Pritchard criterion considering the trend of LnP(K) (Fig.15a), while according to Evanno et al. (2005) the true value of K is K=2 (Fig.15b). Here I report clustering barplots for K=2, 3, 4 and 5 (Fig.16).
27
Figure 15a (left panel). Mean Ln(K). Figure 15b(right panel). Absolute value of ΔK.
Figure 14. Bayesian assignment of Raja miraletus individuals built on the complete SSRs dataset and with estimated K=2, 3, 4. On
the horizontal axis are reported the geographic samples, while on the vertical axis is reported the percentage of individual membership to a given genetic cluster. Single vertical bar represents one individual. Fractions of colour of a bar represent the estimated membership to a certain genetic group of that individual. Black lines separate different localities set a priori.
28
For the clustering results obtained with K=2, no differences were highlighted in relation to what obtained over all samples with K=3 (Fig.14).
Results for K=3 showed that individuals belonged to two main genetic entities: NE Atlantic-Western Mediterranean (from POC/07 to MAL/02) and the second one of Eastern basin (from FNC/07 to TKC/09). JON/04 was confirmed to be an admixing area, while a third genetic component appeared scattered throughout the whole plot.
With K=4 a deeper structuring between samples of Western and Eastern localities started to appear. Within the Western Mediterranean group, Adventura and Maltese Bank individuals presented a different genetic
Figure 16 Bayesian assignment of Raja miraletus individuals built on the NE Atlantic-Mediterranean SSRs dataset and with
estimated K=2, 3, 4, 5. On the horizontal axis are reported the geographic samples, while on the vertical axis is reported the percentage of individual membership to a given genetic cluster. Single vertical bar represents one individual. Fractions of colour of a bar represent the estimated membership to a certain genetic group of that individual. Black lines separate different localities set a priori.
29
make-up in relation to Portuguese and Balearic samples, which also appeared different from those belonging to the Sardinian division. Within the Eastern Mediterranean group, the Bayesian assignment plot showed a main genetic entity, which was not reported among the Western Mediterranean populations.
Considering K=5 the strongest distinction between three main groups could be identified. In particular, samples belonging to NE Atlantic-Western Mediterranean (POC/07, AGC/03, AGC/10, BIS/06, SDC/05, TUC/06 and TUC/10) are clearly separated from the Sicilian Channel (ADV/14 and MAL/02), which, in turn, deeply recalled a certain genetic component found along the Algerian Coasts and around the Balearic Islands (AGC/03, AGC/10 and BIS/06). Then, the transitional area represented by JON/04 connected the Sicilian Channel with FAN/07, representing the Western Coasts of the Adriatic Sea. A strong differentiation and independent genetic composition was showed by FAN/04 corresponding instead to the Eastern Coasts of the Adriatic Sea. In closing, the Southern Adriatic Sea, Israelian coasts and Levantine Sea (PGC/04, ABC/04, ILC/09 and TKC/09) recalled the FAN/07 component, even if it appeared more scattered and admixed.
Differently, considering K=5 a distinction between three main groups could be identified. In particular, samples belonging to NE Atlantic-Western Mediterranean (POC/07, AGC/03, AGC/10, BIS/06, SDC/05, TUC/06 and TUC/10) are clearly separated from the Sicilian Channel (ADV/14 and MAL/02), which, in turn, recalled a certain genetic component fund along the Algerian Coasts and around the Balearic Islands (AGC/03, AGC/10 and BIS/06).
Then, the transitional area represented by JON/04 connected the Sicilian Channel with FAN/07, representing the Western Coasts of the Adriatic Sea.
A strong differentiation and independent genetic composition was showed by FAN/04 corresponding instead to the Eastern Coasts of the Adriatic Sea.
3.4. Demographic history
The chronogram in Fig.17 reconstructed the Time of the Most Common Recent Ancestor (TMRCA) of the
R. miraletus complex. Numbers near nodes represented the divergence time estimates expressed in MYA.
The separation (posterior=1) between the out-group R. asterias and R. miraletus complex occurred 15.98MYA. The statistically supported node (posterior=1) for TMRCA of R. miraletus complex was estimated 11.74MYA. This period seemed to sign the differentiation between the Atlantic African (ex R.
ocellifera) and the NE-Atlantic-Mediterranean R. miraletus species. The split between the Atlantic African
haplotypes and the Angolan ones (Hap_12) occurred 10.34MYA. The separation from the Senegalese clade (Hap_20-22) from the South-Central African one occurred 4.48MYA, and within the latter where a further split dated 1.79MYA.The NE Atlantic-Mediterranean clade resulted as the most recent (1.91MYA), even if the separation between Eastern and Western Mediterranean did not appear clear. The TMRCA of Atlantic African (ex R. ocellifera) and the NE Atlantic-Mediterranean R. miraletus was estimated from the COI
30
dataset, supporting a recent divergence of those that we could define as siblings ex R. ocellifera and R.
miraletus. This result was concordant with previous studies stating that the North-eastern Atlantic and
31
Figure 17. Chronogram illustrating the TMRCA of Raja miraletus complex. Refer to Tab.II for the distribution of the COI haplotypes among R. miraletus population samples.
32 4. DISCUSSION AND CONCLUSIONS
The evolutionary history of skates has been described in recent times (Valsecchi et al. 2005; Chevolot et al. 2006; Compagno and Ebert, 2007; Tinti, 2008; Iglesias et al. 2009; Pasolini et al. 2011; Messinetti, 2013), but few and fragmented references focused on the Brown skate species complex (i.e. Raja ocellifera and
Raja miraletus) proposed by McEachran et al. (1989) on the basis of morphometric variations among
different geographical samples.
Considering the intrinsically sensitive ecological and biological traits and the scarce migratory behaviour of
R. miraletus, the major impediment to its dispersal are the complex of oceanographic and hydrogeological
discontinuities characterizing the Eastern Atlantic and the Mediterranean Basin. As a consequence, the past agreement about a uniform and contiguous marine realm seems more out-dated than ever. This thesis represents the final demonstration and identification of species boundaries in the R. miraletus complex on a wide geographical range, totally overlapping with the one considered in McEachran et al. (1989).
Following the wave of previous works by Ferrari (2012) and Vinjau (2012) I increased both nuDNA and mtDNA datasets with 19 additional individuals and other samples excluded from previous analyses (i.e. FAN/04 corresponding to the Croatian Coasts). The investigation based on both molecular markers, along with the merging and homogenization of previous fragmented information into a complete and exhaustive datasets, represents a first contribution to a wider aim. Taking advantage of the power of new analytical approaches in investigating genetic diversity, population differentiation and evolutionary backgrounds I analysed the merged datasets and I tested four main hypotheses regarding the Brown skate species boundaries along the African and NE Atlantic-Mediterranean Coasts, its phylogeography and demographic history.
In many cases, combining nuDNA and mtDNA markers improved the power of molecular data to test population structure and phylogeographic hypotheses and highlighted the incongruence of studies using only mtDNA rather than only nuDNA markers. As a matter of fact, in the past decade, many conflicting geographic patterns between mitochondrial and nuclear genetic markers have been identified (i.e. mito-nuclear discordance; Toews and Brelsford, 2012). In most cases, this incongruence is attributed to adaptive introgression of mtDNA, demographic disparities and sex-biased asymmetries, since the mitochondrial genome is haploid and uniparentally inherited in most animals. Given the ability for high-resolution nuclear genetic markers (i.e. microsatellites) to detect very slight and potentially very recent reductions in gene flow, it is becoming increasingly difficult to determine whether mtDNA homogeneity between groups, but divergent in nuDNA is a result of by male-biased dispersal, mating behaviour, sex-biased offspring production or of the high power of multi-locus nuclear data sets to detect differentiation (Edwards & Bensch 2009). In the present study, the combined analysis of nuDNA and mtDNA data indicated high levels of genetic diversity over all samples and the presence of at least two main clades characterized by different levels of connectivity within them.