Lancet Oncol 2017; 18: 1022–39 Published Online
July 4, 2017 http://dx.doi.org/10.1016/ S1470-2045(17)30445-X This online publication has been corrected. The corrected version first appeared at thelancet.com/oncology on July 26, 2017 See Comment page 983 *Members of the RARECARENet Working Group are listed in the appendix Evaluative Epidemiology Unit, Fondazione IRCCS, Istituto Nazionale dei Tumori, Milan, Italy (G Gatta MD, R Capocaccia MSc, L Botta MSc, A Trama PhD); Centro Nazionale Prevenzione delle malattie e Promozione della Salute (CNAPPS) Istituto Superiore di Sanità, Rome, Italy (S Mallone MSc); Dipartimento di Oncologia e Medicina Molecolare, Istituto Superiore di Sanità, Rome, Italy (R De Angelis MSc); CIBER de Epidemiología y Salud Pública (CIBERESP), Spain (Eva Ardanaz PhD); Instituto de Salud Pública de Navarra, Pamplona, Spain (Eva Ardanaz); National Cancer Registry Ireland, Cork, Ireland (H Comber PhD); Bulgarian National Cancer Registry, Sofia, Bulgaria (N Dimitrova PhD); Cancer Society of Finland, Finnish Cancer Registry, Helsinki, Finland (M K Leinonen PhD); Department of Research, Netherlands Comprehensive Cancer Organisation (IKNL), Utrecht, the Netherlands (S Siesling PhD, J M van der Zwan PhD); Belgian Cancer Registry, Brussels, Belgium (L Van Eycken MD); Netherlands Comprehensive Cancer Organisation (IKNL), Utrecht, the Netherlands (O Visser PhD); Institute of Oncology Ljubljana, Epidemiology and Cancer Registry, Ljubljana, Slovenia
Burden and centralised treatment in Europe of rare tumours:
results of RARECAREnet—a population-based study
Gemma Gatta, Riccardo Capocaccia, Laura Botta, Sandra Mallone, Roberta De Angelis, Eva Ardanaz, Harry Comber, Nadya Dimitrova,
Maarit K Leinonen, Sabine Siesling, Jan M van der Zwan, Liesbet Van Eycken, Otto Visser, Maja P Žakelj , Lesley A Anderson, Francesca Bella,
Kaire Innos, Renée Otter, Charles A Stiller, Annalisa Trama, for the RARECAREnet working group*
Summary
Background
Rare cancers pose challenges for diagnosis, treatments, and clinical decision making. Information about rare
cancers is scant. The RARECARE project defined rare cancers as those with an annual incidence of less than six per
100 000 people in European Union (EU). We updated the estimates of the burden of rare cancers in Europe, their time
trends in incidence and survival, and provide information about centralisation of treatments in seven European countries.
Methods
We analysed data from 94 cancer registries for more than 2 million rare cancer diagnoses, to estimate
European incidence and survival in 2000–07 and the corresponding time trends during 1995–2007. Incidence was
calculated as the number of new cases divided by the corresponding total person-years in the population. 5-year
relative survival was calculated by the Ederer-2 method. Seven registries (Belgium, Bulgaria, Finland, Ireland, the
Netherlands, Slovenia, and the Navarra region in Spain) provided additional data for hospitals treating about
220 000 cases diagnosed in 2000–07. We also calculated hospital volume admission as the number of treatments
provided by each hospital rare cancer group sharing the same referral pattern.
Findings
Rare cancers accounted for 24% of all cancers diagnosed in the EU during 2000–07. The overall incidence
rose annually by 0.5% (99·8% CI 0·3–0·8). 5-year relative survival for all rare cancers was 48·5% (95% CI 48·4 to 48·6),
compared with 63·4% (95% CI 63·3 to 63·4) for all common cancers. 5-year relative survival increased (overall 2·9%,
95% CI 2·7 to 3·2), from 1999–2001 to 2007–09, and for most rare cancers, with the largest increases for haematological
tumours and sarcomas. The amount of centralisation of rare cancer treatment varied widely between cancers and
between countries. The Netherlands and Slovenia had the highest treatment volumes.
Interpretation
Our study benefits from the largest pool of population-based registries to estimate incidence and
survival of about 200 rare cancers. Incidence trends can be explained by changes in known risk factors, improved
diagnosis, and registration problems. Survival could be improved by early diagnosis, new treatments, and improved
case management. The centralisation of treatment could be improved in the seven European countries we studied.
Funding
The European Commission (Chafea).
Introduction
The RARECARE project
1defined rare cancers as those
with an annual incidence of less than six per 100 000
people in the European Union (EU), and showed that
about one in five cancers diagnosed in the EU were rare
and slightly more than 4 million people with a rare
cancer diagnosis were living in the EU population.
Because of their low numbers, the almost 200 rare
cancers listed by RARECARE pose challenges for
diagnosis, treatments, and clinical decision making.
Clinical trials into such cancers are rare too, and it is
hard to build up new knowledge and expertise.
The broad consensus suggests that diagnostic
pathological confirmation and primary treatment of rare
cancers, in particular, should be centralised in reference
centres, collaborative networks, or both, with multi
disciplinary approaches
2and very specific expertise.
Additionally, clinical and translational research calls for a
high level of centralisation and international collaboration.
To what extent appropriate policies for patients with rare
cancer are implemented at the country level has seldom
been studied. As a consequence, information for policy
makers and stakeholders is scarce for many of these rare
tumours.
The project Information Network on Rare Cancers
(RARECAREnet) is designed to update epidemiological
information about rare cancers in the EU,
3to provide
indicators at the country level, time trends, and to study
to what extent treatment is centralised in Europe.
In this study, we provide current incidence and survival
estimates based on data collected from 94 population
based cancer registries, for 198 rare cancers diagnosed in
2000–07 and for 12 major families of rare cancers. We also
present data for the levels of centralisation for rare cancers
in selected European countries.
Methods
Patients
We extracted data from two databases. The first, the
descriptive analysis database, is a subset of the
EUROCARE5 database,
4which includes incidence and
(M P Žakelj DSc); Centre for Public Health, School of Medicine, Dentistry and Biomedical Science, Queen’s University Belfast, Belfast, UK (L A Anderson PhD); Integrated Cancer Registry of Catania-Messina-Siracusa-Enna, Azienda Ospedaliero-Universitaria Policlinico-Vittorio Emanuale, Catania, Italy (F Bella MD); Department of Epidemiology and Biostatistics, National Institute for Health Development, Tallinn, Estonia (K Innos PhD); Belgian Cancer Center, Department of Public Health and
Surveillance,Scientific Institute of Public Health, Brussels, Belgium (R Otter PhD); and National Cancer Registration and Analysis Service, Public Health England, Oxford, UK (C A Stiller MSc) Correspondence to: Gemma Gatta, Evaluative Epidemiology Unit, Fondazione IRCCS, Istituto Nazionale dei Tumori, Milan 20133, Italy gemma.gatta@istitutotumori. mi.it
cancer registries for patients with cancer diagnosed
between Jan 1, 1978, and Dec 31, 2007. Vital status was
updated to Dec 31, 2008. From the 117 cancer registries
participating in EUROCARE5, we excluded specialised
paediatric cancer registries, the Swedish and Turin
cancer registries, because they did not participate in the
RARECAREnet study, and the Danish cancer registry,
because it did not provide the morphology detail needed
to define rare cancers. Details of the RARECAREnet
database can be found in the report on the project
website.
5To analyse incidence, we excluded 11 anatomical
sitespecific cancer registries to avoid incomplete
coverage of some cancer entities affecting multiple sites
such as neuroendocrine tumours. We excluded cases
identified only by death certificate or incidentally
discovered at autopsy from the analysis because they do
not report time of survival. Cases lost to followup were
considered as censored at the date of last contact.
We included multiple primaries in the same patient.
The second database was used for the study of hospitals
of treatment and hospital volume, which includes data
from seven European cancer registries: the national
cancer registries of Belgium, Bulgaria, Finland, Ireland,
the Netherlands, Slovenia, and the regional cancer
Research in context
Evidence before the study
The surveillance of rare cancer in Europe (RARECARE) project
provided data from European population-based cancer registries
to provide for the first time the burden of rare cancers in Europe.
The RARECARE definition of rare cancer was an incidence of less
than six cases per 100 000 people per year. A list of rare cancers
was created, combining the topography and morphology codes
from the International Classification of Diseases for Oncology
(ICD-O-3). The list was produced after consultations by a group
of pathologists, clinicians and epidemiologists, and was
endorsed by the main European cancer organisations. The
definition and the list were employed in several European and
extra-European countries. The European Commission (EC) based
the recent launch of the Joint Action on Rare Cancer in line with
this definition. Estimates indicated that about one in five new
cancers were rare and slightly more than 4 million people
diagnosed with rare cancers lived in Europe. Outcomes (5-year
relative survival) were worse for patients with rare cancers than
for patients with common cancers.
There is general agreement that treatment of rare cancers should
be concentrated in specialised multidisciplinary centres, and that
international collaboration is needed for research on these
cancers. However, there is no knowledge about the extent of
centralisation of rare cancer treatment at the population level.
Added value of this study
With the new project ‘Information network on rare cancer’
(RARECAREnet), we updated the burden of rare cancer and
provided indicators of the centralisation of patients with rare
cancer in seven European countries. We estimated about
650 000 new diagnoses of rare cancers occur yearly in Europe,
with an incidence of 115 of 100 000 per year. The incidence rose
by 0·5% annually, due to overdiagnosis (eg, thyroid carcinoma)
or improved diagnosis (eg, neuroendocrine tumours [NET],
gastrointestinal stromal tumour [GIST]) or increases in
exposure to risk factors (such as HPV). 5-year survival for rare
cancers (49%) is still lower than for common cancers (63%), but
has risen, from 46% in 1999–2001 to 49% in 2005–07.
Significant progress was reported for some poor-prognosis
cancers, such as chronic myeloid leukaemia,
gastroenteropancreatic tumours (GEP), soft tissue sarcoma of
viscera, plasmocytoma or multiple myeloma, and oesophageal
cancers. Seven European countries provided data to study the
extent of hospital centralisation for rare cancers and these data
showed that, overall, centralisation of rare cancer treatment
varied widely between countries and was generally low.
Implication of all the evidence
Rare cancers are a specific group of rare diseases requiring,
compared with other rare diseases, the largest expenditure for
drugs. The rare disease community has strongly lobbied the EC
to increase investment in research, management, and social
support for these diseases. This very large population-based
study on rare cancers thus provides useful information for
public health. The EC recognised the results of RARECARE and
RARECAREnet and launched a European Joint Action for Rare
Cancers in 2016 aiming to help member states with their
national health plans. The EC also recently approved
two specific rare cancer European Reference Networks (ERN),
for childhood and solid cancers, to exchange management of
very rare cancers or to treat patients from small countries. Both
initiatives can use these data, with national and European
health-care institutions, to address the issue of rare cancers
better.
Lower survival of patients with rare cancer might be explained
by difficulties in clinical research, as well as their specific
biological characteristics, and our results have shown that
non-optimal organisation of care can have a role too. There is
ample room for improving the levels of centralisation of
treatment and clinical expertise in seven European countries.
These results were discussed in national meetings, and
confirmed the need for improving the centralisation of rare
cancer treatment in fewer, more specialised hospitals. Our data
offer a starting point to measure the effects of new policies on
rare cancers.
Data provided by cancer registries are essential, but their quality
has to improve, especially on morphology, hospital and treatment
definitions. Basic information on stage and the determinants of
stage needs to be collected routinely. The European network of
cancer registries should work to boost these improvements and
make wider use of the data on rare cancers.
registry of Navarra (Spain). The Navarra cancer registry,
although regional, was added because of the regional
organisation of the Spanish healthcare system. These
cancer registries were selected to reflect the variability of
incidence and survival in Europe,
1,5and because they
could provide detailed data for all 198 rare cancers
included in the RARECAREnet list. Variables included in
the database were: sex, date of birth, date of diagnosis,
topography and morphology codes from the International
Classification of Disease for Oncology version 3 (ICDO3)
grading, pathological and clinical TNM Classification of
Malignant Tumours (TNM) staging, simplified stage
(localised, regional extension, metastatic), treatment
(surgery, radiotherapy, systemic, other, or none), vital
status, date of last followup or death, hospital of
diagnosis, and hospital of treatment. The hospital of
diagnosis was defined as the hospital where the pathology
examination was done or requested. The hospital of
treatment(s) was defined as the hospital where a specific
treatment (eg, surgery) or the first course of systemic
therapy (eg, chemotherapy) was given. Up to five different
types of treatment within 1 year from the date of diagnosis
were considered as a primary treatment. Vital status was
further updated in this second database, with respect to
the first descriptive analysis database, to Dec 31, 2012.
Analysis
The rationale for the definition of rare cancer entities and
their classification in terms of ICDO codes are reported
elsewhere.
1,2,5Classification was structured to avoid any
overlap among rare entities. For example, gastro entero
hepatic neuroendocrine tumours and gastro intestinal
stromal tumours were under the families of neuro
endocrine tumours and sarcomas, but not also in
digestive rare cancers.
From the first database, we estimated incidence as the
number of new cases arising in 2000–07 divided by the
corresponding total personyears (male and female) in
the general population. The European standard
population was used for direct age standardisation. New
cases in 2013 in EU28 (28 member states of EU)
were
calculated by multiplying agespecific and sexspecific
incidence rates in 2000–07 by the corresponding
European population classified in 5year age classes on
Jan 1, 2013.
We estimated incidence variation by restricting
the analysis to cases diagnosed in the two subperiods
1999–2002 and 2003–07, and presented the results in a
funnel plot. Annual percentage change was calculated as
the ratio between incidence rates for the two subperiods
to the power of 1 over 4·5, the inverse of the mean
difference in time between the two subperiods.
We estimated 5year relative survival as the ratio of
observed to expected survival in the general population,
matched by age, sex, calendar year, and geographical
area, and calculated by the Ederer2 method.
6We estimated relative survival time trends using the
period approach and considering three followup periods:
1999–2001 (cohorts diagnosed in Jan 1, 1995, to
Dec 31, 2001), 2002–04 (cohorts diagnosed in Jan 1,1998 to
Dec 31, 2004), and 2005–07 (cohorts diagnosed in
Jan 1, 2001, to Dec 31, 2007). We presented relative
survival changes as a funnel plot.
The volume (number) of treatments provided by each
hospital was calculated from the second database for
major cancer groups, defined by aggregating all the solid
rare cancers into 38 groups sharing the same referral
pattern. For example, all seven head and neck tumours
identified as clinically distinct rare entities
1are usually
referred to head and neck specialised services, and we
considered these as a single group. Haematological rare
tumours do not always require hospitalisation and we
did not consider these in the volume analysis. We then
computed hospital volume for each of the 38 groups as
the annual number of any treatment delivered by the
hospital, for all the cancers in that group. We regarded
repeated admissions to the same hospital for the same
cancer and the same treatment type (ie, surgery,
radiotherapy, or systemic therapy) as a single admission
and counted as one treatment in the analyses. Repeated
admissions for several treatment types (such as
radiotherapy and subsequent surgery) given to a patient
in the same hospital were counted as separate treatments.
Untreated patients were assigned to the hospital of
diagnosis. The total number of treatments provided by
each hospital for a given group of rare cancers was then
divided by the number of years of observation to provide
its mean annual hospital volume. Pearson’s correlation
coefficient was used to evaluate the association, across
cancers, between mean admission volume and incidence.
Finally, for each patient we calculated the mean annual
volume of the hospital(s) where they were treated to
obtain a patientspecific measure with a much less
skewed distribution with respect to the hospitalspecific
volume. The mean value of
this measure for all the
patients diagnosed with a given group of rare cancers in
a certain country gives a cancerspecific and country
specific measure of the level of expertise that patients can
expect for the treatment of their tumour. We called this
calculation the mean admission volume indicator.
Role of the funding source
The funders had no role in study design, collection,
analysis or interpretation of data, or writing of the report.
The corresponding author had full access to all the data
and had final responsibility for the decision to submit for
publication.
Results
Survival estimates in 2000–07 for all rare cancers were
based on 1 994 346 diagnoses,
observed by 94 cancer
registries. 1 984 147 rare cancer diagnoses were considered
for incidence estimates in 2000–07, collected by 83 cancer
registries from 1566 million personyears of observation.
62 828 (3%) of 1 984 147 cases were identified by death
certificate only or incidentally at autopsy ranging from a
maximum of 4412 (10%) of 44 755 cases in Slovakia, to
265 (<1%) of 60 377 cases in Scotland. Data for incidence
time trends came from 42 cancer registries for 1995–2007,
and included 2 268 602 cases, and 1900 million person
years of observation. Survival time trend analysis was
based on 1 649 309 rare cancer diagnoses from 45 cancer
registries providing uninterrupted data from at least
Jan 1, 1995, to Dec 31, 2007.
For the study of hospitals of treatment and hospital
volume, we received data for about 348 000 rare cancers
diagnosed in the period 2000–07. However, national data
from Belgium were limited to 2004–07, and those from
Navarra to 2000–05. Cases diagnosed in Bulgaria and the
Netherlands during 2000–04 were removed on account of
incomplete national coverage of hospital information.
223 081 rare cancer cases were included in the hospital
volume study database. Nonspecific morphologies
(8000, 8001, 8010, 8800, 9800, 9590) were found in 4588
(2%), with the highest proportion in Finland (1268 [4%]
of 30 740 cases). 37 959 (17%) of 223 081 cases were
removed because hospital information was missing.
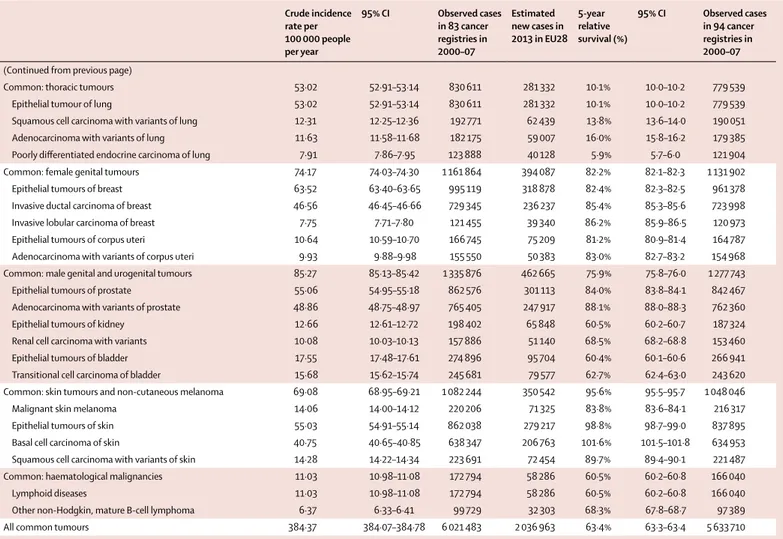
Table 1 shows the incidence and survival estimates for
each of the 198 rare cancers, for 63 groups of rare
cancers, for the 12 wider families in which rare cancers
are hierarchically grouped, and for six common cancer
groups. Haematological malignancies, rare cancers
of female genital organs and of the digestive tract,
and head and neck cancers were families with the
highest overall incidence rates (from 19 to 28
per 100 000 people per year). Thoracic cancers, male
Crude incidence rate per 100 000 people per year 95% CI Observed cases in 83 cancer registries in 2000–07 Estimated new cases in 2013 in EU28 5-year relative survival (%) 95% CI Observed cases in 94 cancer registries in 2000–07
Rare: head and neck cancers 18·82 16·76–16·89 263 565 84 989 52·1% 51·8–52·3 254 563 Epithelial tumours of nasal cavity and sinuses 0·45 0·44–0·46 7046 2282 47·3% 45·8–48·8 6867
Squamous cell carcinoma with variants of nasal cavity and
sinuses 0·35 0·34–0·36 5465 1770 49·5% 47·8–51·2 5444
Lymphoepithelial carcinoma of nasal cavity and sinuses 0·00 0·00–0·00 31 10 70·8% 50·7–99·0 31 Undifferentiated carcinoma of nasal cavity and sinuses 0·02 0·02–0·02 286 93 30·5% 24·3–38·2 283 Intestinal-type adenocarcinoma of nasal cavity and sinuses 0·00 0·00–0·00 42 14 65·0% 48·9–86·4 42
Epithelial tumours of nasopharynx 0·47 0·46–0·49 7439 2580 48·9% 47·5–50·2 7276
Squamous cell carcinoma with variants of nasopharynx 0·36 0·35–0·37 5613 1941 48·5% 47·0–50·1 5589 Papillary adenocarcinoma of nasopharynx 0·00 0·00–0·00 17 6 58·7% 36·2–95·3 17 Epithelial tumours of major salivary glands and
salivary-gland-type tumours 1·39 1·37–1·41 21 794 7059 62·8% 62·0–63·7 21 364
Epithelial tumours of major salivary glands 0·96 0·95–0·98 15 053 4876 60·8% 59·8–61·8 14 703 Salivary-gland-type tumours of head and neck 0·43 0·42–0·44 6741 2183 67·1% 65·7–68·6 6683 Epithelial tumours of hypopharynx and larynx 6·33 6·29–6·37 99 176 31 545 52·0% 51·6–52·4 96 793 Squamous cell carcinoma with variants of hypopharynx 1·27 1·25–1·28 19 828 6422 25·1% 24·4–25·9 19 878 Squamous cell carcinoma with variants of larynx 4·61 4·58–4·64 72 210 23 389 60·5% 60·1–61·0 71 928 Epithelial tumours of oropharynx 3·32 3·29–3·35 52 017 16 848 40·9% 40·4–41·4 50 843 Squamous cell carcinoma with variants of oropharynx 3·12 3·09–3·14 48 812 15 810 41·3% 40·8–41·8 48 401 Epithelial tumours of oral cavity and lip 4·78 4·75–4·81 74 890 24 257 56·7% 56·2–57·1 73 101 Squamous cell carcinoma with variants of oral cavity 3·51 3·48–3·54 54 931 17 792 48·0% 47·5–48·6 54 229 Squamous cell carcinoma with variants of lip 1·02 1·00–1·04 15 984 5177 89·5% 88·5–90·5 15 899
Epithelial tumours of eye and adnexa 0·04 0·04–0·05 679 247 80·6% 75·9–85·6 673
Squamous cell carcinoma with variants of eye and adnexa 0·03 0·02–0·03 421 136 88·9% 83·0–95·2 422 Adenocarcinoma with variants of eye and adnexa 0·01 0·01–0·01 134 43 58·7% 49·1–70·1 134
Epithelial tumours of middle ear 0·03 0·03–0·04 524 170 44·1% 38·5–49·6 488
Squamous cell carcinoma with variants of middle ear 0·02 0·02–0·03 377 122 37·6% 31·8–44·4 370 Adenocarcinoma with variants of middle ear 0·00 0·00–0·00 50 16 83·8% 70·5–99·5 50 Rare: digestive cancers 21·94 21·86–22·01 343 635 112 351 15·3% 15·2–15·5 321 375 Epithelial tumours of oesophagus 7·81 7·77–7·85 122 344 40 068 12·0% 11·8–12·2 119 522 Squamous cell carcinoma with variants of oesophagus 3·36 3·33–3·39 52 597 17 036 11·7% 11·3–12·0 53 225 Adenocarcinoma with variants of oesophagus 3·26 3·24–3·29 51 138 16 564 13·9% 13·5–14·2 51 250 Salivary-gland-type tumours of oesophagus 0·00 0·00–0·01 63 20 13·7% 6·4–29·0 64 Undifferentiated carcinoma of oesophagus 0·04 0·04–0·05 695 225 6·8% 4·9–9·4 712
Crude incidence rate per 100 000 people per year 95% CI Observed cases in 83 cancer registries in 2000–07 Estimated new cases in 2013 in EU28 5-year relative survival (%) 95% CI Observed cases in 94 cancer registries in 2000–07
(Continued from previous page)
Rare epithelial tumours of stomach 0·33 0·32–0·34 5146 1886 15·9% 14·7–17·1 5157 Squamous cell carcinoma with variants of stomach 0·12 0·11–0·12 1807 585 17·5% 15·6–19·7 1800 Salivary-gland-type tumours of stomach 0·00 0·00–0·00 39 13 25·1% 12·7–49·9 40 Undifferentiated carcinoma of stomach 0·21 0·20–0·22 3300 1069 14·9% 13·5–16·4 3317 Epithelial tumours of small intestine 0·77 0·76–0·79 12 132 3930 27·3% 26·3–28·3 11 544 Adenocarcinoma with variants of small intestine 0·59 0·58–0·60 9219 2986 27·9% 26·8–29·0 9193 Squamous cell carcinoma with variants of small intestine 0·01 0·01–0·01 133 43 34·8% 26·8–45·3 133
Rare epithelial tumour of colon 0·13 0·13–0·14 2074 737 54·8% 52·0–57·7 2075
Squamous cell carcinoma with variants of colon 0·03 0·02–0·03 400 130 37·1% 31·8–43·4 395 Fibromixoma and low-grade mucinous adenocarcinoma of the
appendix 0·11 0·10–0·11 1674 542 58·8% 55·7–62·1 1680
Rare epithelial tumours of rectum 0·11 0·11–0·12 1764 635 47·2% 44·4–50·2 1777
Squamous cell carcinoma with variants of rectum 0·11 0·11–0·12 1764 571 47·2% 44·4–50·2 1777 Epithelial tumours of anal canal 1·16 1·14–1·18 18 155 5880 56·5% 55·5–57·4 18 020 Squamous cell carcinoma with variants of anal canal 0·81 0·80–0·82 12 691 4111 63·0% 61·9–64·1 12 847 Adenocarcinoma with variants of anal canal 0·25 0·25–0·26 3970 1286 41·9% 39·9–43·9 3945
Paget’s disease of anal canal 0·00 0·00–0·00 21 7 62·9% 38·0–104·0 21
Rare epithelial tumours of pancreas 0·07 0·07–0·08 1159 414 20·2% 17·4–23·3 1116 Squamous cell carcinoma with variants of pancreas 0·02 0·02–0·03 361 117 5·9% 3·6–9·6 347
Acinar cell carcinoma of pancreas 0·03 0·03–0·03 449 145 19·0% 14·8–24·3 427
Mucinous cystadenocarcinoma of pancreas 0·01 0·01–0·01 109 35 35·9% 26·3–49·0 106 Intraductal papillary mucinous carcinoma invasive of pancreas 0·01 0·01–0·01 173 56 31·8% 23·6–42·9 171 Solid pseudopapillary carcinoma of pancreas 0·00 0·00–0·00 44 14 67·7% 52·8–86·8 42
Serous cystadenocarcinoma of pancreas 0·00 0·00–0·00 4 1 NE NE 4
Carcinoma with osteoclast-like giant cells of pancreas 0·00 0·00–0·00 19 6 NE NE 19 Epithelial tumours of liver and intrahepatic bile tract 7·10 7·06–7·14 111 271 36 261 10·1% 9·9–10·3 98 765 Hepatocellular carcinoma of liver and intrahepatic bile tract 3·22 3·19–3·25 50 461 16 344 14·0% 13·7–14·4 46 896 Hepatocellular carcinoma, fibrolamellar of liver and
intrahepatic bile tract 0·02 0·02–0·03 387 125 28·1% 23·3–33·8 390
Cholangiocarcinoma of intrahepatic bile tract 0·97 0·95–0·99 15 201 4924 6·0% 5·6–6·6 13 845 Adenocarcinoma with variants of liver and intrahepatic bile
tract 0·41 0·40–0·42 6457 2091 6·6% 5·9–7·4 6311
Undifferentiated carcinoma of liver and intrahepatic bile tract 0·02 0·01–0·02 240 78 2·7% 1·2–6·4 219 Squamous cell carcinoma with variants of liver and
intrahepatic bile tract 0·01 0·01–0·01 147 48 14·6% 9·1–23·4 143
Bile duct cystadenocarcinoma of intrahepatic bile tract 0·00 0·00–0·00 38 12 23·6% 11·5–48·5 34 Epithelial tumours of gallbladder and extrahepatic biliary tract 4·44 4·41–4·48 69 590 22 540 13·6% 13·2–13·9 63 889 Adenocarcinoma with variants of gallbladder 1·35 1·33–1·36 21 085 6830 14·5% 14·0–15·1 20 338 Adenocarcinoma with variants of extrahepatic biliary tract 1·44 1·42–1·46 22 510 7291 19·2% 18·6–19·8 22 234 Squamous cell carcinoma of gallbladder and extrahepatic
biliary tract 0·03 0·03–0·03 496 161 8·8% 6·3–12·3 476
Rare: thoracic cancers 6·80 6·76–6·84 106 573 37 277 13·4% 13·1–13·6 104 670
Epithelial tumour of trachea 0·11 0·11–0·12 1771 574 18·0% 16·0–20·3 1697
Squamous cell carcinoma with variants of trachea 0·06 0·06–0·07 1017 329 12·2% 10·0–14·9 1008 Adenocarcinoma with variants of trachea 0·01 0·01–0·01 164 53 15·7% 10·3–24·0 158 Salivary-gland-type tumours of trachea 0·01 0·01–0·01 175 57 70·1% 62·0–79·2 174 Rare epithelial tumour of lung 4·37 4·34–4·40 68 452 24 930 14·9% 14·6–15·2 67 936
Adenosquamous carcinoma of lung 0·29 0·29–0·30 4607 1492 21·9% 20·5–23·4 4566
Large-cell carcinoma of lung 3·81 3·78–3·84 59 714 19 342 13·9% 13·5–14·2 59 332 Salivary-gland-type tumours of lung 0·06 0·05–0·06 879 285 40·4% 36·8–44·4 866
Sarcomatoid carcinoma of lung 0·21 0·20–0·22 3255 1054 17·5% 16·0–19·2 3183
Crude incidence rate per 100 000 people per year 95% CI Observed cases in 83 cancer registries in 2000–07 Estimated new cases in 2013 in EU28 5-year relative survival (%) 95% CI Observed cases in 94 cancer registries in 2000–07
(Continued from previous page)
Epithelial tumours of thymus 0·18 0·17–0·19 2795 905 64·3% 62·1–66·6 2729
Malignant thymoma 0·14 0·14–0·15 2268 735 69·3% 67·0–71·8 2248
Squamous cell carcinoma of thymus 0·01 0·01–0·01 114 37 40·4% 30·4–53·7 112
Undifferentiated carcinoma of thymus 0·00 0·00–0·00 36 12 13·3% 5·1–34·8 36
Lymphoepithelial carcinoma of thymus 0·00 0·00–0·00 12 4 55·0% 29·2–103·6 11
Adenocarcinoma with variants of thymus 0·00 0·00–0·00 45 15 37·3% 21·7–64·1 44
Malignant mesothelioma 2·14 2·12–2·16 33 552 10 868 5·3% 4·9–5·6 32 330
Mesothelioma of pleura and pericardium 1·83 1·81–1·85 28 676 9288 4·6% 4·2–4·9 27 893 Mesothelioma of peritoneum and tunica vaginalis 0·13 0·13–0·14 2065 669 13·2% 11·5–15·1 1965 Rare: female genital cancers 22·73 22·66–22·81 356 151 113 796 57·7% 57·5–57·9 347 015 Rare epithelial tumours of breast 4·12 4·09–4·16 64 605 22 980 91·4% 91·0–91·8 64 368 Mammary Paget’s disease of breast 0·41 0·40–0·42 6488 2101 85·9% 84·6–87·3 6508 Special types of adenocarcinoma of breast 3·06 3·04–3·09 48 012 15 551 95·2% 94·8–95·6 47 974
Metaplastic carcinoma of breast 0·10 0·10–0·11 1576 510 65·0% 61·9–68·3 1583
Salivary-gland-type tumours of breast 0·06 0·05–0·06 868 281 90·9% 87·6–94·2 870 Epithelial tumour of male breast 0·52 0·51–0·53 8098 5376 77·0% 75·5–78·5 7882 Rare epithelial tumours of corpus uteri 0·70 0·69–0·72 11 038 3932 44·3% 43·2–45·5 11 013 Squamous cell carcinoma with variants of corpus uteri 0·06 0·06–0·07 1003 325 58·2% 54·6–62·1 989 Adenoid cystic carcinoma of corpus uteri 0·00 0·00–0·00 5 2 64·1% 31·3–131·1 5 Clear cell adenocarcinoma, not otherwise specified of corpus
uteri 0·16 0·16–0·17 2527 819 58·6% 56·2–61·2 2532
Serous (papillary) carcinoma of corpus uteri 0·08 0·07–0·08 1227 397 40·0% 36·5–43·9 1225 Mullerian mixed tumour of corpus uteri 0·40 0·39–0·41 6276 2033 36·9% 35·5–38·4 6263 Epithelial tumours of cervix uteri 6·28 6·24–6·32 98 321 28 898 65·4% 65·1–65·8 96 821 Squamous cell carcinoma with variants of cervix uteri 4·73 4·70–4·76 74 105 24 003 66·8% 66·5–67·2 73 810 Adenocarcinoma with variants of cervix uteri 0·91 0·89–0·92 14 252 4616 67·4% 66·5–68·3 14 221 Undifferentiated carcinoma of cervix uteri 0·03 0·03–0·03 480 155 35·3% 30·9–40·4 478 Mullerian mixed tumour of cervix uteri 0·02 0·01–0·02 257 83 34·3% 28·1–41·7 256 Epithelial tumour of ovary and fallopian tube 9·38 9·33–9·43 146 908 45 382 37·5% 37·2–37·8 141 240 Adenocarcinoma with variants of ovary 5·95 5·92–5·99 93 263 30 208 38·7% 38·3–39·1 92 814 Mucinous adenocarcinoma of ovary 0·77 0·76–0·78 12 066 3908 59·9% 58·9–60·9 12 010 Clear cell adenocarcinoma of ovary 0·30 0·29–0·31 4753 1540 55·5% 53·8–57·2 4761 Primary peritoneal serous or papillary carcinoma of ovary 0·08 0·08–0·09 1280 415 21·9% 19·1–25·2 1280
Mullerian mixed tumour of ovary 0·14 0·14–0·15 2255 730 21·4% 19·5–23·6 2242
Adenocarcinoma with variant of fallopian tube 0·17 0·16–0·18 2683 869 59·1% 56·8–61·6 2672
Non-epithelial tumours of ovary 0·25 0·25–0·26 3977 1288 82·0% 80·6–83·5 3970
Sex cord tumours of ovary 0·13 0·12–0·13 2006 650 78·8% 76·5–81·1 1998
Malignant or immature teratomas of ovary 0·05 0·05–0·06 833 270 83·4% 80·6–86·3 829
Germ cell tumour of ovary 0·07 0·07–0·08 1138 369 86·6% 84·4–88·8 1143
Epithelial tumours of vulva and vagina 1·97 1·95–2·00 30 938 11 215 58·1% 57·3–58·8 30 238 Squamous cell carcinoma with variants of vulva and vagina 1·69 1·67–1·71 26 422 8558 59·8% 59·0–60·7 26 277 Adenocarcinoma with variants of vulva and vagina 0·07 0·07–0·08 1120 363 45·8% 42·3–49·6 1112 Paget’s disease of vulva and vagina 0·05 0·04–0·05 746 242 88·0% 83·7–92·6 744 Undifferentiated carcinoma of vulva and vagina 0·01 0·00–0·01 85 28 25·6% 15·8–41·6 85
Trophoblastic tumour of placenta 0·02 0·02–0·03 363 100 89·3% 85·3–92·2 361
Choriocarcinoma of placenta 0·02 0·02–0·02 352 114 89·8% 86·5–93·3 350
Crude incidence rate per 100 000 people per year 95% CI Observed cases in 83 cancer registries in 2000–07 Estimated new cases in 2013 in EU28 5-year relative survival (%) 95% CI Observed cases in 94 cancer registries in 2000–07
(Continued from previous page)
Rare: male genital and urogenital cancers 7·09 7·05–7·14 111 128 38 138 73·6% 73·3–74·0 109 102 Rare epithelial tumours of prostate 0·60 0·59–0·61 9437 3563 75·4% 74·0–76·9 9291 Squamous cell carcinoma with variants of prostate 0·02 0·02–0·02 291 94 41·1% 34·1–49·5 287 Infiltrating duct carcinoma of prostate 0·51 0·50–0·53 8064 2612 78·7% 77·2–80·3 7945 Transitional cell carcinoma of prostate 0·06 0·06–0·07 960 311 57·7% 53·4–62·4 941 Salivary-gland-type tumours of prostate 0·01 0·01–0·01 122 40 78·5% 64·4–95·7 118 Testicular and paratesticular cancers 3·29 3·27–3·32 51 605 16 061 94·9% 94·7–95·2 51 011 Paratesticular adenocarcinoma with variants 0·00 0·00–0·00 22 7 82·5% 65·3–104·1 22 Non-seminomatous testicular cancer 1·27 1·25–1·28 19 835 6425 92·9% 92·5–93·3 19 714 Seminomatous testicular cancer 1·82 1·80–1·84 28 516 9236 97·5% 97·3–97·8 28 326
Spermatocytic seminoma 0·03 0·03–0·03 502 163 95·3% 91·8–99·0 502
Teratoma with malignant transformation 0·00 0·00–0·00 20 6 91·4% 78·6–106·2 20
Testicular sex cord cancer 0·02 0·02–0·02 340 110 82·3% 77·3–87·6 337
Epithelial tumours of penis 0·66 0·65–0·67 10 368 3887 67·5% 66·2–68·9 10 210
Squamous cell carcinoma with variants of penis 0·62 0·60–0·63 9646 3124 68·9% 67·5–70·2 9621
Adenocarcinoma with variants of penis 0·01 0·00–0·01 88 29 49·0% 36·2–66·4 86
Rare epithelial tumours of kidney 0·05 0·04–0·05 723 261 18·8% 15·8–22·4 704
Squamous cell carcinoma spindle cell type of kidney 0·01 0·01–0·01 190 62 22·0% 16·0–30·2 190 Squamous cell carcinoma with variants of kidney 0·03 0·03–0·04 533 173 17·7% 14·4–21·7 514 Epithelial tumours of pelvis and ureter 1·58 1·57–1·60 24 826 9187 48·8% 48·0–49·7 24 017 Transitional cell carcinoma of pelvis and ureter 1·41 1·39–1·43 22 099 7158 51·3% 50·4–52·2 21 607 Squamous cell carcinoma with variants of pelvis and ureter 0·02 0·02–0·03 372 121 15·0% 11·2–20·2 366 Adenocarcinoma with variants of pelvis and ureter 0·02 0·02–0·02 326 106 43·0% 36·7–50·5 320
Epithelial tumours of urethra 0·13 0·13–0·14 2077 784 44·5% 41·6–47·5 2050
Transitional cell carcinoma of urethra 0·09 0·08–0·09 1390 450 42·9% 39·5–46·7 1387 Squamous cell carcinoma with variants of urethra 0·02 0·02–0·02 329 107 51·1% 44·6–58·5 329 Adenocarcinoma with variants of urethra 0·01 0·01–0·01 190 62 52·0% 43·2–62·6 189 Rare epithelial tumours of bladder 0·65 0·64–0·67 10 226 3819 32·3% 31·2–33·5 10 152 Squamous cell carcinoma with variants of bladder 0·36 0·35–0·36 5566 1803 24·3 22·9–25·7 5534 Adenocarcinoma with variants of bladder 0·30 0·29–0·31 4653 1507 41·9% 40·1–43·8 4614
Salivary-gland-type tumours of bladder 0·00 0·00–0·00 7 2 NE NE 7
Extragonadal germ cell tumours 0·12 0·11–0·12 1862 576 69·6% 67·3–71·8 1851
Non-seminomatous germ cell tumours 0·06 0·05–0·06 915 296 62·5% 59·2–66·0 909
Seminomatous germ cell tumours 0·01 0·01–0·01 130 42 85·9% 79·1–93·3 130
Germ cell tumours of CNS 0·04 0·03–0·04 574 186 82·5% 79·2–85·9 572
Rare: neuroendocrine tumours 3·51 3·43–3·58 54 942 19 587 53·5% 53·0–54·1 54 331
GEP, well differentiated not functioning endocrine carcinoma of
pancreas and digestive tract 1·01 1·00–1·03 15 852 5134 72·0% 71·1–73·0 15 656
GEP, well differentiated functioning endocrine carcinoma of
pancreas and digestive tract 0·03 0·02–0·03 411 133 61·3% 55·9–67·3 407
GEP, poorly differentiated endocrine carcinoma 0·67 0·65–0·68 10 421 3375 35·0% 33·9–36·2 10 456 GEP, mixed endocrine–exocrine carcinoma 0·01 0·01–0·01 147 48 25·9% 18·2–37·0 141 Endocrine carcinoma of thyroid gland 0·24 0·23–0·25 3796 1230 83·6% 82·1–85·2 3793
Neuroendocrine carcinoma of skin 0·19 0·19–0·20 3024 979 55·9% 53·2–58·7 2997
Typical and atypical carcinoid of the lung 0·39 0·38–0·40 6160 1995 81·1% 79·9–82·5 6058 Neuroendocrine carcinoma of other sites 0·90 0·89–0·92 14 120 4573 23·9% 23·0–24·8 13 958
Pheochromocytoma, malignant 0·04 0·04–0·04 650 211 70·1% 65·9–74·5 612
Paraganglioma 0·02 0·02–0·02 347 112 56·3% 50·6–62·6 342
Crude incidence rate per 100 000 people per year 95% CI Observed cases in 83 cancer registries in 2000–07 Estimated new cases in 2013 in EU28 5-year relative survival (%) 95% CI Observed cases in 94 cancer registries in 2000–07
(Continued from previous page)
Rare: cancers of the endocrine organs 5·35 5·32–5·39 83 836 28 322 88·1% 87·8–88·4 82 523
Carcinomas of pituitary gland 0·04 0·03–0·04 582 206 63·7% 58·9–69·0 511
Carcinomas of thyroid gland 5·07 5·03–5·10 79 418 26 768 90·5% 90·2–90·8 78 533
Carcinomas of parathyroid gland 0·03 0·02–0·03 410 143 80·8% 75·8–86·2 395
Carcinomas of adrenal gland 0·22 0·21–0·23 3424 1205 32·1% 30·2–34·0 3103
Rare: sarcomas 5·86 5·83–6·00 91 878 31 916 59·5% 57·4–58·2 90 568
Soft tissue sarcoma 4·71 4·68–4·74 73 795 25 851 56·7% 56·3–57·1 72 696
Soft tissue sarcoma of head and neck 0·26 0·25–0·27 4087 1324 59·8% 57·7–61·8 4062 Soft tissue sarcoma of limbs 1·10 1·08–1·11 17 178 5564 67·7% 66·8–68·6 17 094 Soft tissue sarcoma of superficial trunk 0·50 0·49–0·51 7813 2531 48·1% 46·8–49·5 7723
Soft tissue sarcoma of mediastinum 0·03 0·03–0·03 465 151 23·4% 19·3–28·3 457
Soft tissue sarcoma of heart 0·01 0·01–0·02 216 70 14·4% 9·8–21·0 203
Soft tissue sarcoma of breast 0·18 0·18–0·19 2865 928 74·5% 72·5–76·5 2864
Soft tissue sarcoma of uterus 0·55 0·54–0·56 8657 2804 52·0% 50·8–53·2 8568
Other soft tissue sarcomas of genitourinary tract 0·20 0·19–0·21 3160 1024 50·4% 48·3–52·5 3107
Soft tissue sarcoma of viscera 0·38 0·37–0·39 6004 1945 42·1% 40·6–43·6 5915
Soft tissue sarcoma of paratestis 0·03 0·03–0·04 510 165 87·2% 82·2–92·4 510
Soft tissue sarcoma of retroperitoneum and peritoneum 0·31 0·30–0·32 4911 1591 38·8% 37·1–40·5 4854
Soft tissue sarcoma of pelvis 0·20 0·19–0·20 3090 1001 47·4% 45·3–49·6 3064
Soft tissue sarcoma of skin 0·30 0·29–0·31 4737 1534 90·2% 88·8–91·7 4728
Soft tissue sarcoma of paraorbit 0·01 0·01–0·01 117 38 63·3% 52·9–75·7 115
Soft tissue sarcoma of brain and other parts of nervous system 0·17 0·17–0·18 2723 882 54·5% 52·3–56·7 2695 Embryonal rhabdomyosarcoma of soft tissue 0·05 0·05–0·06 836 271 66·2% 62·8–69·8 825 Alveolar rhabdomyosarcoma of soft tissue 0·03 0·03–0·04 519 168 36·0% 31·7–40·8 515
Ewing’s sarcoma of soft tissue 0·06 0·06–0·07 998 323 44·9% 41·5–48·5 992
Bone sarcoma 0·85 0·84–0·87 13 376 4382 58·6% 57·6–59·6 13 216
Osteogenic sarcoma 0·21 0·21–0·22 3330 1079 51·4% 49·5–53·4 3282
Chondrogenic sarcomas 0·26 0·25–0·27 4107 1330 70·0% 68·2–71·7 4060
Notochordal sarcomas, chordoma 0·07 0·07–0·08 1145 371 62·5% 58·2–67·2 755
Vascular sarcomas 0·01 0·01–0·01 129 42 45·1% 36·4–55·9 129
Ewing’s sarcoma 0·12 0·12–0·13 1943 629 52·8% 50·4–55·3 1932
Epithelial tumours, adamantinoma 0·01 0·01–0·02 213 69 87·2% 81·0–93·9 210
Other high grade sarcomas (fibrosarcoma, malignant fibrous
histiocytoma) 0·02 0·02–0·02 304 98 46·2% 40·1–53·1 302
Gastrointestinal stromal sarcoma 0·30 0·29–0·31 4706 1683 72·3% 70·4–74·1 4781
Rare: cancers of the CNS 7·56 7·51–8·00 118 391 36 343 21·3% 21·0–21·6 111 838
Tumours of CNS 7·36 7·32–7·40 115 289 35 339 20·3% 20·0–20·6 108 752
Astrocytic tumours of CNS 4·99 4·95–5·02 78 118 25 303 15·0% 14·8–15·3 77 195
Oligodendroglial tumours of CNS 0·39 0·38–0·40 6148 1991 51·8% 50·4–53·3 6124
Ependymal tumours of CNS 0·21 0·20–0·21 3212 1040 72·7% 71·0–74·5 3190
Choroid plexus carcinoma of CNS 0·01 0·01–0·01 98 32 57·7% 48·3–68·8 95
Malignant meningiomas 0·16 0·16–0·17 2564 830 61·1% 58·8–63·4 2509
Embryonal tumours of CNS 0·20 0·19–0·21 3102 1005 56·1% 54·2–58·1 3092
Rare: skin cancers and non-cutaneous melanoma 1·22 1·18–1·25 21 878 7086 70·2% 69·3–71·1 21 637
Malignant melanoma of mucosa 0·15 0·14–0·15 2279 738 20·3% 18·3–22·6 2277
Malignant melanoma of uvea 0·70 0·69–0·72 11 022 3570 71·0% 69·8–72·2 10 872
Adnexal carcinoma of skin 0·30 0·29–0·31 4684 1517 86·1% 83·9–88·0 4661
Kaposi’s sarcoma 0·25 0·24–0·26 3893 1261 78·9% 77·1–80·8 3830
Crude incidence rate per 100 000 people per year 95% CI Observed cases in 83 cancer registries in 2000–07 Estimated new cases in 2013 in EU28 5-year relative survival (%) 95% CI Observed cases in 94 cancer registries in 2000–07
(Continued from previous page)
Rare: embryonal tumours 0·34 0·33–0·35 5363 1822 78·6% 77·4–79·8 5239
Neuroblastoma and ganglioneuroblastoma 0·10 0·10–0·11 1566 507 64·6% 62·1–67·3 1553
Nephroblastoma 0·13 0·12–0·13 1965 636 88·2% 86·6–89·7 1936 Retinoblastoma 0·05 0·05–0·06 860 279 96·5% 95·1–97·9 801 Hepatoblastoma 0·02 0·02–0·03 357 116 76·8% 72·2–81·7 352 Pleuropulmonary blastoma 0·00 0·00–0·00 9 3 53·5% 28·3–101·1 9 Pancreatoblastoma 0·00 0·00–0·00 39 13 34·3% 20·7–56·9 35 Olfactory neuroblastoma 0·03 0·03–0·03 498 161 64·0% 59·2–69·2 489
Odontogenic malignant tumours 0·00 0·00–0·01 69 22 61·6% 49·0–77·5 69
Rare: haematological malignancies 27·73 27·65–27·82 434 469 156 099 50·5% 50·3–50·7 423 741 Rare lymphoid diseases 18·09 18·02–18·16 283 399 100 343 55·8% 55·5–56·0 279 794 Hodgkin’s lymphoma, classical 2·46 2·44–2·49 38 588 12 499 81·4% 80·9–81·8 38 389 Hodgkin’s lymphoma nodular lymphocyte predominance 0·09 0·09–0·10 1483 480 93·6% 91·8–95·3 1507 Precursor B-cell or T-cell lymphoblastic leukaemia or
lymphoma (and Burkitt’s leukaemia or lymphoma) 1·46 1·44–1·47 22 795 7383 58·1% 57·4–58·8 22 496 T-cell cutaneous lymphoma (Sezary syndrome, mycosis
fungoides) 0·35 0·34–0·36 5526 1790 81·5% 80·0–83·1 5482
Other T-cell lymphomas and natural killer cell neoplasms 0·62 0·60–0·63 9656 3128 39·0% 37·9–40·2 9635
Diffuse B-cell lymphoma 4·32 4·29–4·35 67 645 21 910 53·4% 52·9–53·9 67 907
Follicular B-cell lymphoma 2·19 2·17–2·22 34 346 11 125 77·0% 76·4–77·6 34 545
Hairy cell leukaemia 0·28 0·27–0·29 4375 1417 89·8% 88·3–91·3 4387
Plasmacytoma or multiple myeloma (and heavy chain diseases) 5·71 5·67–5·75 89 440 28 970 35·3% 34·8–35·7 86 496
Mantle cell lymphoma 0·56 0·55–0·57 8748 2834 44·0% 42·6–45·4 8797
Prolymphocytic leukaemia, B cell 0·05 0·05–0·06 804 260 30·8% 26·9–35·2 788
Acute myeloid leukaemia and related precursor neoplasms 3·81 3·77–3·84 59 608 21 557 19·2% 18·8–19·6 56 709 Acute promyelocytic leukaemia with t(15;17) with variants 0·12 0·11–0·13 1876 608 63·2% 60·8–65·7 1880
Acute myeloid leukaemia 3·50 3·47–3·53 54 789 17 746 17·5% 17·1–17·8 52 305
Myeloproliferative neoplasms 3·31 3·28–3·34 51 888 18 805 68·3% 67·7–68·9 50 624
Chronic myeloid leukaemia 1·12 1·10–1·13 17 473 5660 54·9% 54·0–55·9 16 599
Other myeloproliferative neoplasms 2·17 2·14–2·19 33 954 10 998 75·0% 74·3–75·7 33 599
Mast cell tumour 0·03 0·03–0·03 461 149 71·4% 66·2–77·1 454
Myelodysplastic syndrome and myelodysplastic or
myeloproliferative diseases 2·47 2·45–2·50 38 738 15 116 31·1% 30·5–31·8 37 792
Myelodysplastic syndrome with 5q syndrome 0·01 0·01–0·01 156 51 48·0% 38·3–60·3 178 Other myelodysplastic syndrome 2·14 2·12–2·16 33 542 10 864 32·2% 31·5–32·9 32 576 Chronic myelomonocytic leukaemia 0·29 0·28–0·30 4542 1471 21·3% 19·8–23·0 4575 Atypical chronic myeloid leukaemia BCR/ABL negative 0·02 0·01–0·02 239 77 28·2% 21·7–36·5 248 Histiocytic and dendritic cell neoplasms 0·05 0·05–0·06 828 278 59·9% 56·1–63·9 817
Histiocytic malignancies 0·04 0·04–0·05 656 212 63·4% 59·4–67·8 645
Lymph-node accessory cell tumours 0·01 0·01–0·01 172 56 45·6% 37·1–56·0 172
All rare tier 2 tumours 114·99 114·82–115·16 1 801 443 636 753 48·5% 48·4–48·6 1 751 601 Common: digestive tumours 91·80 91·65–91·95 1 438 094 490 051 41·4% 41·3–45·8 1 365 575 Epithelial tumours of stomach 17·10 17·03–17·16 267 832 92 067 21·2% 21·0–21·4 253 439 Adenocarcinoma with variants of stomach 14·18 14·12–14·24 222 145 71 954 22·7% 22·5–22·9 221 604 Epithelial tumours of colon 43·88 43·77–43·98 687 386 234 319 54·2% 54·0–54·4 664 118 Adenocarcinoma with variants of colon 38·85 38·75–38·95 608 637 197 139 57·9% 57·7–58·0 604 459 Epithelial tumours of rectum 17·98 17·92–18·05 281 697 95 187 53·8% 53·6–54·1 276 024 Adenocarcinoma with variants of rectum 16·45 16·39–16·52 257 723 83 477 55·8% 55·6–56·1 258 469 Epithelial tumours of pancreas 12·84 12·79–12·90 201 179 68 478 4·1% 4·0–4·2 182 579 Adenocarcinoma with variants of pancreas 7·96 7·92–8·01 124 744 40 405 4·1% 4·0–4·2 119 154
genital and urological tumours, endocrine organ
tumours, CNS tumours, and sarcomas had overall
incidences from 4 to 8 per 100 000 people per year. Rare
skin cancers and noncutaneous melanoma, and
embryonal cancers were the families with the lowest
incidences (1·22 and 0·34 per 100 000). Overall, rare
cancers accounted for 24% of all cancers diagnosed in
EU28 during 2000–07; the majority were solid
cancers (76%). For sexspecific rare cancers, we also
provide sexspecific incidence (appendix p 4).
5year relative survival of all rare cancers was 48·5%
(95% CI 48·4–48·6), compared with 63·4% (95% CI
63·3–63·4) for all common cancers. Rare cancers also
had lower survival within the families of digestive cancers
(15·3% [95% CI 15·2–15·5] for rare cancers vs 41·4%
[41·3–41·5] for common cancers), female genital cancers
(57·7% [57·5–57·9] vs 82·2% [82·1–82·3]), male genital
and urological cancers (73·6% [73·3–74·0] vs 75·9%
[75·8–76·0]), skin cancers (70·2% [69·3–71·1] vs 95·6%
[95% CI 95·5–95·7]), and haematological tumours
(50·5% [50·3–50·7] vs 60·5% [60·2–60·8]). The only
exception was the thoracic cancer family (13·4%
[13·1–13·6] vs 10·1% [10·0–10·2]), for which common
cancers included poorly differentiated endocrine
carcinoma of the lung with a very poor prognosis (5·9%
[5·7–6·0] after 5 years. Families including only rare
cancers had 5year relative survival ranging from high, as
for embryonal tumours (78·6% [95% CI 77·4–79·8]) and
endocrine organ tumours (88·1% [87·8–88·4]), to
intermediate, for sarcomas (59·5% [57·4–58·2]), neuro
endocrine tumours (53·5% [53·0–54·1]), and head and
neck tumours (52·1% [51·8–52·3]), and low for CNS
tumours (21·3% [21·0–21·6]).
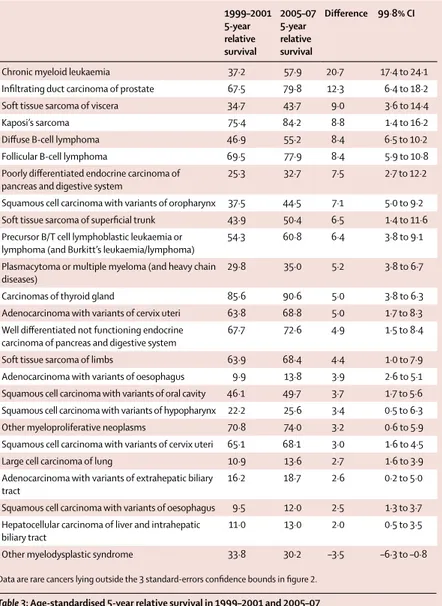
Time trends of incidence and survival for rare cancers
are in figures 1 and 2. Cancers whose incidence variation
fell outside the confidence interval shown in figure 1 are
listed in table 2, with the agestandardised incidence
estimates for 1999–2002 and 2003–07, the corresponding
annual percentage change and 3 standarderror confidence
intervals. Rare cancer dots in the plot seem to be
Crude incidence rate per 100 000 people per year 95% CI Observed cases in 83 cancer registries in 2000–07 Estimated new cases in 2013 in EU28 5-year relative survival (%) 95% CI Observed cases in 94 cancer registries in 2000–07
(Continued from previous page)
Common: thoracic tumours 53·02 52·91–53·14 830 611 281 332 10·1% 10·0–10·2 779 539 Epithelial tumour of lung 53·02 52·91–53·14 830 611 281 332 10·1% 10·0–10·2 779 539 Squamous cell carcinoma with variants of lung 12·31 12·25–12·36 192 771 62 439 13·8% 13·6–14·0 190 051 Adenocarcinoma with variants of lung 11·63 11·58–11·68 182 175 59 007 16·0% 15·8–16·2 179 385 Poorly differentiated endocrine carcinoma of lung 7·91 7·86–7·95 123 888 40 128 5·9% 5·7–6·0 121 904 Common: female genital tumours 74·17 74·03–74·30 1 161 864 394 087 82·2% 82·1–82·3 1 131 902 Epithelial tumours of breast 63·52 63·40–63·65 995 119 318 878 82·4% 82·3–82·5 961 378 Invasive ductal carcinoma of breast 46·56 46·45–46·66 729 345 236 237 85·4% 85·3–85·6 723 998 Invasive lobular carcinoma of breast 7·75 7·71–7·80 121 455 39 340 86·2% 85·9–86·5 120 973 Epithelial tumours of corpus uteri 10·64 10·59–10·70 166 745 75 209 81·2% 80·9–81·4 164 787 Adenocarcinoma with variants of corpus uteri 9·93 9·88–9·98 155 550 50 383 83·0% 82·7–83·2 154 968 Common: male genital and urogenital tumours 85·27 85·13–85·42 1 335 876 462 665 75·9% 75·8–76·0 1 277 743 Epithelial tumours of prostate 55·06 54·95–55·18 862 576 301 113 84·0% 83·8–84·1 842 467 Adenocarcinoma with variants of prostate 48·86 48·75–48·97 765 405 247 917 88·1% 88·0–88·3 762 360 Epithelial tumours of kidney 12·66 12·61–12·72 198 402 65 848 60·5% 60·2–60·7 187 324 Renal cell carcinoma with variants 10·08 10·03–10·13 157 886 51 140 68·5% 68·2–68·8 153 460 Epithelial tumours of bladder 17·55 17·48–17·61 274 896 95 704 60·4% 60·1–60·6 266 941 Transitional cell carcinoma of bladder 15·68 15·62–15·74 245 681 79 577 62·7% 62·4–63·0 243 620 Common: skin tumours and non-cutaneous melanoma 69·08 68·95–69·21 1 082 244 350 542 95·6% 95·5–95·7 1 048 046 Malignant skin melanoma 14·06 14·00–14·12 220 206 71 325 83·8% 83·6–84·1 216 317 Epithelial tumours of skin 55·03 54·91–55·14 862 038 279 217 98·8% 98·7–99·0 837 895 Basal cell carcinoma of skin 40·75 40·65–40·85 638 347 206 763 101·6% 101·5–101·8 634 953 Squamous cell carcinoma with variants of skin 14·28 14·22–14·34 223 691 72 454 89·7% 89·4–90·1 221 487 Common: haematological malignancies 11·03 10·98–11·08 172 794 58 286 60·5% 60·2–60·8 166 040
Lymphoid diseases 11·03 10·98–11·08 172 794 58 286 60·5% 60·2–60·8 166 040
Other non-Hodgkin, mature B-cell lymphoma 6·37 6·33–6·41 99 729 32 303 68·3% 67·8–68·7 97 389 All common tumours 384·37 384·07–384·78 6 021 483 2 036 963 63·4% 63·3–63·4 5 633 710
The first tier entities are not a sum of the second tiers included because of the not otherwise specified entities. EU28=European Union (28 member states). GEP=gastroenteric-pancreatic tumour. NE=not estimable.
Table 1: Estimates of incidence and survival for rare and common cancers
distributed fairly symmetrically around the zerochange
line, indicating no major systematic shifts in incidence.
The average annual percentage change of all rare cancers
was 0·5% (99·8% CI 0·3–0·8). Incidence increased for 16
rare cancers and incidence decreased for 10 rare cancers,
but with changes falling outside the 99·8% confidence
limits. Time trends of rare cancers did not substantially
differ from those of common cancers (data not shown),
whose average annual change was 0·9%. Only prostate
and skin cancers had an annual percentage change of
more than 2%, while only epithelial cancers of the
stomach decreased more than 2% (data not shown).
Survival increased from 1999–2001 to 2005–07 for most
rare cancers. The cloud of points in figure 2 is skewed
upward from the zero line, corresponding to a mean
increase in survival, averaged over all the entities, of
2·9% (95% CI 2·7–3·2). Survival for 24 rare cancers was
significantly increased (table 3), whereas survival was
significantly reduced for only one cancer (other
myelodysplastic syndromes). Rare cancers with the
largest survival increases were mainly haematological:
chronic myeloid leukaemia, diffuse B cell lymphoma,
follicular lym phoma, precursor B/T cell lymphoblastic
leukaemia or lymphoma, and multiple myeloma.
Sarcomas were well represented among the top tumours
with increasing survival, specifically of the viscera,
trunk, and Kaposi’s sarcoma. Survival increases higher
than 5 percentage points were also observed for
infiltrating ductal carcinoma of the prostate
(12·3 percentage points [99·8% CI 6·4–18·2]), poorly
differentiated endocrine carcinoma of the digestive
system (7·5 percentage points [2·7–12·2]), and
squamous cell carcinoma of the oropharynx
(7·1 percentage points [5·0–9·2]). There were no major
improvements in survival for rare cancers of the colon,
rectum, breast, or kidney, differently from the
corresponding groups of common cancers.
8The extent of centralisation of rare cancer treatment
is presented in figures 3 and 4 presenting mean admission
volume, overall and by country, for 38 cancer groups
ranked by decreasing incidence. We used a logarithmic
scale for the xaxis to make the graph readable despite
large mean admission volume variability (from 0·2 to 82·6
treatments per year) across the considered cancers. The
mean number of admissions is in the appendix (p 3–4).
Pooled mean admission volume (figures 3 and 4) ranged
from a maximum of 82·6 treatments per year for head
and neck tumours to less than 0·5 treatments per year for
placenta (choriocarcinoma), and some embryonal and
endocrine tumours. The higher the incidence, the larger
the mean admission volume of treating hospitals. The
association between cancer incidence and mean
admission volume in the pool of countries was very
strong (Pearson’s correlation coefficient 0·88), although
there are several outliers. For example, epithelial tumours
of the ovary had a higher incidence but a lower mean
admission volume than CNS tumours (35 vs 20 cases
treated per year). Treatment of patients with epithelial
tumours of the ovary was thus
spread among a larger
number of hospitals compared with CNS tumours.
Similarly, the incidence of soft tissue sarcomas was
5 times higher than bone sarcomas, but soft tissue
sarcomas were treated centrally less than bone sarcoma.
Treatment for thyroid cancers, uveal melanoma, and
several embryonal tumours appeared to be fairly
concentrated in a few hospitals with relatively
high volumes. By contrast, tumours of the urinary tract,
gastro entero pancreatic
neuroendocrine
tumours,
small intestine, nonepithelial ovary cancers, and
Figure 1: Annual percentage changes in age-adjusted incidence rates of rare
cancers (1999–2007)
Funnel plot in which each dot represents a single rare cancer, the y-axis displays the estimated difference in terms of annual percentage change of age-adjusted incidence, and the x-axis the corresponding precision in terms of the inverse of its standard error. 3 standard-error confidence bounds for estimated zero changes7 are represented by two symmetrical lines progressively approaching
the x-axis with increasing x values. Dots lying above or below the area between them correspond respectively to tumours with 99·8% significantly higher or lower incidence rates.
–50 –40 –30 –20 –10 0 10 20 30 40 50 0·05 0·50 5·00 Annual pe rcentage chan ge Precision
Single rare cancer
Figure 2: Difference in 5-year relative survival for rare cancers (1999–2001 vs
2005–07)
Funnel plot in which each dot represents a single rare cancer, the y-axis displays the estimated difference between 5-year relative survival in 2005–07and 1999–2001, and the x-axis the corresponding precision in terms of the inverse of its standard error.3 standard-error confidence bounds for estimated zero changes7 are represented by two symmetrical lines progressively approaching the
x-axis with increasing x values. Dots lying above or below the area between them correspond respectively to tumours with 99·8% significantly higher or lower incidence rates. Precision –100 –80 –60 –40 –20 0 20 40 60 80 100 0 0·3 2·5 Su rv iv al differenc e
neuroendocrine tumours of the skin were treated in
centres with an even lower mean admission volume than
would be expected because of their very low occurrence.
With some exceptions, countryspecific patterns of
mean admission volume were similar to the pooled data.
By contrast with what was found in the other countries,
the management of epithelial ovarian cancers was highly
centralised in Bulgaria and Slovenia. Patients with CNS
tumours were treated in highly centralised structures in
all countries except Finland and Navarra. Treatment for
uveal melanoma and retinoblastoma was not centralised
in Bulgaria or in Navarra. Slovenia and the Netherlands
had the highest centralisation patterns, whereas mean
admission volume for the majority of cancers was very
low in Navarra due also to the small population size.
Table 4 shows the annual number of cases diagnosed,
the number of topvolume hospitals treating at least 75%
of national cases, and the average annual numbers of
treatments provided for each country and for 29 rare
cancers. For head and neck cancers, 75% of patients
were centralised in two top hospitals in Slovenia
(2 million population, 266 treatments per hospital per
year), and 12 top hospitals in the Netherlands (17 million
population, 201 treatments per hospital per year). The
level of centralisation was lower in the other countries,
resulting in a caseload of 145 in the ten Bulgarian top
hospitals, 106 in the 29 Belgian hospitals, and 83 in the
six
hospitals in Finland, 77 in the two
hospitals in
Navarra, and 63 in the seven
hospitals in Ireland. The
Netherlands and Slovenia had the highest treatment
volume for 12 of 29 cancers.
Discussion
Rare cancers make up one quarter of all malignancies.
They are a very heterogeneous group of almost
200 cancers, mostly solid, constituting from 2% of all
skin cancers up to 32% of all female genital cancers.
We confirmed that 5year survival is lower for rare
cancers than common cancers (49% vs 63%), and for all
rare cancer families compared with their more common
counterparts, except thoracic cancers. The disadvantage
persisted even after excluding common cancers with
good prognosis, such as
prostate, breast, and skin cancer.
Several factors help explain these differences: the biology
1999–2002 age-standardised incidence 2003–07 age-standardised incidence Annual percentage change 99·8% CI
Gastrointestinal stromal sarcoma 0·098 0·258 24·1% 12·0 to 36·2
Gastroenteric-pancreatic tumour, poorly differentiated endocrine
carcinoma of pancreas and digestive system 0·361 0·618 12·7% 7·7 to 17·8 Other T-cell lymphomas and natural killer cell neoplasms 0·395 0·555 7·8% 3·3 to 12·4
Diffuse B-cell lymphoma 2·837 3·894 7·3% 5·7 to 8·9
Other myeloproliferative neoplasms 1·530 2·092 7·2% 5·0 to 9·4
Mantle cell lymphoma 0·367 0·477 6·0% 1·6 to 10·4
Carcinomas of thyroid gland 3·470 4·353 5·2% 3·7 to 6·6
Other myelodysplastic syndrome 1·395 1·738 5·0% 3·0 to 7·1
Squamous cell carcinoma with variants of anal canal 0·595 0·728 4·6% 1·2 to 8·0
Follicular B-cell lymphoma 1·676 2·021 4·2% 2·2 to 6·3
Cholangiocarcinoma of intrahepatic bile tract 0·685 0·816 4·0% 0·9 to 7·0 Neuroendocrine carcinoma of other sites 0·683 0·801 3·6% 0·5 to 6·7 Adenocarcinoma with variants of oesophagus 2·725 3·153 3·3% 1·8 to 4·8 Squamous cell carcinoma with variants of oropharynx 2·412 2·732 2·8% 1·1 to 4·5 Adenocarcinoma with variants of extrahepatic biliary tract 0·969 1·088 2·6 0·1 to 5·1 Hepatocellular carcinoma of liver and intrahepatic bile tract 2·068 2·273 2·1% 0·4 to 3·8 Squamous cell carcinoma with variants of cervix uteri 4·536 4·287 –1·2% –2·4 to –0·1 Adenocarcinoma with variants of ovary 5·351 5·053 –1·3% –2·3 to –0·2 Squamous cell carcinoma with variants of larynx 3·853 3·578 –1·6% –2·8 to –0·4
Chronic myeloid leukaemia 0·991 0·854 –3·2% –5·5 to –0·9
Infiltrating duct carcinoma of prostate 0·412 0·343 –4·0% –7·4 to –0·6 Squamous cell carcinoma with variants of lip 0·838 0·693 –4·1% –6·5 to –1·8
Large cell carcinoma of lung 3·440 2·806 –4·4% –5·6 to –3·2
Mucinous adenocarcinoma of ovary 0·813 0·657 –4·6% –7·2 to –2·1
Adenocarcinoma with variants of bladder 0·265 0·213 –4·7% –8·9 to –0·5 Undifferentiated carcinoma of stomach 0·189 0·123 –9·2% –13·9 to –4·5
Data are rare cancers lying outside the 3 standard-error confidence bounds in figure 1.