volume 2/2012
SAP Società Archeologica s.r.l.
p
c
a
postclassicalarchaeologies
EDITOrS
Gian Pietro Brogiolo (chief editor) Università degli Studi di Padova [email protected]
Alexandra Chavarría (executive editor) Università degli Studi di Padova [email protected]
ADVISOrY bOArD
Giuliano Volpe (Università degli Studi di Foggia) Marco Valenti (Università degli Studi di Siena) ASSISTANT EDITOr
Francesca Benetti (Università degli Studi di Padova)
p
c
a
EDITOrIAl bOArD
Andrea Breda (Soprintendenza bb.AA. della lombardia) Alessandro Canci (Università degli Studi di Padova) Jose M. Martin Civantos (Universidad de Granada) Girolamo Fiorentino (Università del Salento)
Caterina Giostra (Università Cattolica del Sacro Cuore di Milano) Susanne Hakenbeck (University of Southhampton)
Vasco La Salvia (Università degli Studi G. D’Annunzio di Chieti e Pescara) Bastien Lefebvre (Université de Toulouse II le Mirail)
Alberto León (Universidad de Córdoba)
Tamara Lewit (Trinity College - University of Melbourne)
Federico Marazzi (Università degli Studi Suor Orsola benincasa di Napoli) Dieter Quast (römisch-Germanisches Zentralmuseum Mainz) Andrew Reynolds (University College london)
Mauro Rottoli (laboratorio di archeobiologia dei Musei Civici di Como)
Post-Classical Archaeologies (PCA) is an independent, international, peer-reviewed journal devoted to the communication of post-classical research. PCA publishes a variety of manuscript types, including original research, discussions and re-view articles. Topics of interest include all subjects that relate to the science and practice of archaeology, particularly mul-tidisciplinary research which use specialist methodologies, such as zooarchaeology, paleobotanics, archeometallurgy, archeometry, spatial analysis, as well as other experimental methodologies applied to the archaeology of post-classical Europe.
Submission of a manuscript implies that the work has not been published before, that it is not under consideration for publica-tion elsewhere and that it has been approved by all co-authors. Each author must clear reproducpublica-tion rights for any photos or illustration, credited to a third party that he wishes to use (including content found on the Internet). Post-Classical Archaeolo-gies is published once a year in May, starting in 2011. Manuscripts should be submitted to [email protected] accor-dance to the guidelines for contributors in the webpage http://www.postclassical.it
For subscription and all other information visit the web site http://www.postclassical.it
DESIGN
Paolo Vedovetto (Università degli Studi di Padova)
PUblIShEr
SAP Società Archeologica s.r.l. Viale risorgimento 14 - 46100 Mantova www.archeologica.it
PrINTED bY
la Serenissima, Contrà Santa Corona 5, Vicenza
PAGES
EDITORIAL
RESEARCH
G. Dean GIS, archaeology and neighbourhood assemblages in Medieval York
É. Jean-Curret SIG, morphologie et archives foncières médiévales: dynamiques spatiales d’un quartier de Bordeaux aux XIVeet XVes.
B. Lefebvre The study of urban fabric dynamics in long time spans. Modelling, analysis and representation of spatio-temporal transformations
T. Bisschops It is all about location: GIS, property records and the role of space in shaping late medieval urban life. The case of Antwerp around 1400
A. Nardini Siena: un ‘prototipo’ di GIS di fine millennio a dieci anni dalla creazione
V. Valente Space syntax and urban form: the case of late medieval Padua
C. Citter Townscape-Landscape. The shaping of the medieval town of Grosseto and its territory (AD 600-1400)
K.D. Lilley Mapping truth? Spatial technologies and the medieval city: a critical cartography
BEYOND THE THEME
V. Caracuta, G. Fiorentino, M. Turchiano, G. Volpe Processi di forma-zione di due discariche altomedievali del sito di Faragola: il contributo dell’analisi archeobotanica
P. Forlin Airborne LiDAR Data analysis of Trentino Alpine land-scapes: a methodological approach
p
c
a
postclassicalarchaeologies
5 7 31 65 83 107 147 167 201 225 247 volume 2/2012CONTENTS
DOSSIER - PUBLIC ARCHAEOLOGY IN EUROPE G.P. Brogiolo Archeologia pubblica in Italia: quale futuro?
J. Flatman The past, present and future of rescue archaeology in England
F. Iversen The land of milk and honey? Rescue archaeology in Norway I. Catteddu, M.A. Baillieu, P. Depaepe, A. Roffignon L’archéologie
pré-ventive en France: un service public original
A. León Public administration of archaeology in Spain. Notes on the current situation and future prospects
RETROSPECT
A. Buko Early Medieval archaeology in Poland: the beginnings and development stages
PROJECT
P. Chevalier Le Corpus architecturae religiosae europeae, saec. IV-X, en France et la base de données Wikibridge CARE
REVIEWS
G. Bertelli, G. Lepore, Masseria Seppannibale Grande in agro di Fasano (BR). Indagini in un sito rurale (aa. 2003-2006) - by M. Valenti
E. Vaccaro, Sites and Pots. Settlement and Economy in Southern Tuscany (AD 300-900) - by M. Valenti
S. Hakenbeck, Local, Regional and Ethnic Identities in Early Medieval Ceme-teries in Bavaria - by F. Benetti
J. Buckberry, A. Cherryson, Burial in Later Anglo-Saxon England c.650-1100 AD - by A. Chavarria Arnau
N. Christie, P. Stamper (eds), Medieval Rural Settlement. Britain and Ireland, AD 800-1600 - by C. Citter
A.J. Boas, Domestic Settings. Sources on Domestic Architecture and Day-to-day Activities in the Crusader States - by F. Benetti
A. Plata Montero, Génesis de una villa medieval. Arqueología, paisaje y arqui-tectura del valle salado de Añana (Álava) - by J. Sarabia
J.D. Bodenhamer, J. Corrigan, T.M. Harris (eds), The Spatial Humanities. GIS and the future of humanities scholarship - by P. Marcato
F. Cambi, Manuale di archeologia dei paesaggi. Metodologie, fonti, contesti -by M. Valenti
N.Marquez Grant, L. Fibiger (eds), The Routledge Handbook of Archaeological Human Remains and Legislation - by M. Marinato
V. Pace (ed), L’VIII secolo: un secolo inquieto - by M. Camerin
G. Pantò (ed), Archeologia a Chieri. Da Carreum Potentia al Comune basso-medievale - by M. Smanio
I. Ahumada Silva, La collina di San Mauro a Cividale del Friuli. Dalla necropoli longobarda alla chiesetta bassomedievale - by M. Valenti
269 279 299 319 337 361 379 385
PCA 2 (2012) ISSN: 2039-7895 (pp. 167-200) P o s t - C l a s s i c a l A r c h a e o l o g i e s
CATERINA G I O S T R A
Università di Chieti, Dipartimento di Studi ClassiciVia dei Vestini 3, Chieti, [email protected]
research
Università di Siena, Dipartimento di Archeologia e Sto-ria delle Arti, via Vinzaglio 27, Grosseto, [email protected]
The intense archaeological researches within the town center of Grosseto and its sur-rounding territory raised many questions. An economic crisis, whose end is still far, make the fund raising for new researches – i.e. diggings, archaeometric and bioarchaeological investigations – very difficult. Therefore, it is necessary to adopt new tools to minimize the areas to investigate. Hereafter we propose some spatial analysis we made on the town and the territory, which provide interesting suggestions.
Keywords: spatial analysis, kriging, landscape archaeology, GIS, Grosseto
Le intense indagini archeologiche condotte a Grosseto e nel territorio circostante hanno su-scitato molti interrogativi. Una crisi economica di cui non si vede la fine si ripercuote nella difficoltà di accedere a finanziamenti adeguati per rispondere in modo esaustivo (scavi e ana-lisi archeometriche e bioarcheologiche), perciò è necessario dotarsi di nuovi strumenti che consentano di ridurre al minimo le aree da indagare. Di seguito proponiamo alcune analisi spa-ziali effettuate sulla città e il territorio, che costituiscono interessanti spunti di riflessione. Parole chiave: analisi spaziali, kriging, archeologia del paesaggio, GIS, Grosseto
CARLO CITTER
Townscape – Landscape.
The shaping of the medieval town
of Grosseto and its territory
(AD 600-1400)
1I wish to thank Antonia Arnoldus-Huyzendveld, Michelle Hobart and Giancarlo Macchi who read
the draft of this paper. The final version owes much to their suggestions and criticism.
1. Preface1
The goal of this contribute is to describe the most recent updates of a project focused on the birth and the development of Grosseto - a small medieval town in Tuscany (central Italy) – and on the transformations which occurred in the surrounding territory (fig. 1). The project began in 1997, being the main question to study the relationship between Rusel-laeand Grosseto. They are, respectively, the central place of the region
– i.e. the lower Ombrone valley – from the Etruscans till the end of the Roman Empire, and the late medieval to contemporary bishop site. They are also close to each other: Rusellaelays some 7 Km NE from Grosseto. Thanks to the ne-cessity of public works within the 16th century city walls - new
pipelines, cables and pavements – it was possible to excavate the 11% of the open areas of the very centre of the town from 1998 to 2005. They gathered new data about the origin and the development of this rather unusual city, which does not have Roman origins (see Citter, Arnoldus-Huzendveld 2007; Citter 2007). The excavations produced no evidence of a permanent settlement in the town centre before ca. AD 600. In the same time the last late Roman villas (and in particular that of St. Martino which lies 2 Km east-wards) were going to be abandoned, though the lower Ombrone valley still used to be settled by scattered farmsteads. However, as yet, the only excavated Roman rural sites of the region have no phases dating after AD 500. Therefore, this statement deserves further attention, in order to understand what kind of sites they were. Grosseto’s excava-tions helped to understand the rapid and continuous growing of this rather small village from – say – AD 800 up to AD 1200. They also gave precious information about the townscape: a wooden features’ village until ca. AD 1150, when a substantial rebuilding of the bishop’s town substituted the wood with stones and bricks. The development and the expansion took place from a small top flat area toward a gentle slope fac-ing the river Ombrone. We have only a handful of quotations in the liter-ary sources from the origins of the village up to the shifting of the bish-op site (AD 1138). However, they do fit well with the results of the ex-cavations. The material culture, mostly pottery, suggests that the town had been under the influence of the Papacy until ca. AD 1050, when a brand new scenario can be related to the rapidly growth of the Aldobran-deschi lordship (it is noteworthy that in the same time they promoted the process of incastellamento). This family came from Lucca (the most pow-erful town of early medieval Tuscany) around the end of the 8th century. Fig. 1. Grosseto and Tuscany in the Italian
Townscape – landscape. The shaping of the medieval town of Grosseto and its territory (AD 600-1400)
They became Earls of Rusellae under the Carolingians and had always strong interests in Grosseto. As yet, we have no more than a rapid sketch of the surrounding landscape in the crucial period of the town making. The available data suggest that it was settled by few villages (both on plain and on the hilltops) and some – as yet to be defined – sites on the plain, that sometimes reoccupy former Roman ones. The shaping of the bishop and communal town between AD 1150 and 1300 produced the bases of the contemporary townscape by establishing some still standing relevant public buildings, and, later, the curtain wall. The pow-erful town of Siena established a permanent rule upon Grosseto from ca. AD 1340 to AD 1554, when most of Tuscany came under the control of Florence. By that date the town had gone under a deep crisis, which lasted only in the 20thcentury.
The geoarchaeological researches proved that the river Ombrone changed its course many times, from a stream very close to the town to a more distant one. They also sketched a draft of the lagoon from the Roman period, when it had connections with the sea, up to the present little marsh. They also gave a preliminary evaluation of the potential productivity of the plain soils. However, as one can argue, both the excavations in Gros-seto and the researches in the region arose new questions, which deserve attention. In particular, it seems crucial to draw with more accuracy the container – i.e. the landscape - where this small village grew and developed. It is important to understand its potential, its features and how did the town related to it. Did the relationship change from the Aldobrandeschi to the Comune? And how did it change? Did the new rulers of the late Middle Ages up to the 19th century - Siena and Florence – make new landscapes
or did they just left what they found? Which role the exploitation of special resources like the salt works and the lagoon played over time?
2. The GIS: base questions – analyses – new questions
All the data from this project have been stored in a GIS platform (Ar-cGis 9.3) at two different scale levels: town and landscape. In the fol-lowing, after a brief summary of the work that has been done, we shall try to answer to some of the above questions working with available data and GIS-based spatial analyses. To ease the reading, each step will be explained in details. However, one can find useful help in ArchGis help (http://webhelp.esri.com/arcgisdesktop/9.3/index.cfm).
New questions and a wider scale need to focus a detailed strategy. It is unlikely that a new long lasting project which involves some 33,000 hectares of mostly reclaimed land could be financed. So it is highly
probable that new public works involving the archaeological sediment of the town centre will occur in the next decades and private enterprises could only give the opportunity for a rescue sample. We can hope to dig some of the known rural settlements, though most of them could be very badly preserved. Therefore, the remote sensing techniques and the field walking seem to be the only strategy to get data, at least in the eastern portion of the plain, where the geological terrace is covered by no more than 70-100 cm of arable soil.
In order to prevent a waste of resources and time, we started with a first evaluation of the available data (archaeological finds, ancient maps and cadastres, literary sources) within a GIS platform (a first detailed report in Citter, Arnoldus-Huyzendveld 2011). This paper is a step for-ward in a single direction. Can GIS-based spatial analyses help to answer to some of these new questions? Do they produce new suggestions for old issues? Do they help to reduce a vast plain to smaller areas where to make trenches and samples in order to uncover information about the changing field systems, the water management (channels, ditches and streams) and the salt works from the Romans up to the Modern age (good rules in Verhagen, Borsboom 2009)? Do they help to improve the interpretation of the development’s rhythm of the town?
2.1. The town
The contract we made with the county’s administrators focused only on open – i.e. public – areas within the town walls. We had the opportu-nity to dig inside the 12thcentury church of St. Peter, whose sequence,
spanning from AD 600 to AD 1600, played a great role in creating a general picture of the town’s development. However, it was an exception to have access to such a site. Typically, we had to follow the public works project and excavate only contemporary streets and squares, where for-mer pipelines had already removed a portion of the stratigraphy. There-fore, we hardly found a fully preserved sequence or building in either tim-ber or masonry. However, this did not prevent us from sketching the main phases of Grosseto’s history and to answer to some basic ques-tions as shown briefly in the preface. The possibility to have 14C dating
for 13 crucial layers allowed to calibrate the chronology of the early and high medieval coarse and fine wares found in the town and in the sur-roundings, where we had collected potsherds from many sites during field-walking campaigns in the ‘80s.
Based on this research, new questions soon came to the fore. How fast did the village grow? Did it develop from a single point or from a sparse settlement? Did it grow without any break? How did it relate to
Townscape – landscape. The shaping of the medieval town of Grosseto and its territory (AD 600-1400)
the countryside? Did this crucial relationship change from, say, AD 800 to AD 1200?
2.1.1. From the village to the town: overlaying and questioning the ar-chaeological and the geoarar-chaeological data with interpolation methods
The first urgent question was to gain more data about the early village, whose beginning, around AD 600, is only known from very scant evidence. On the contrary, one can hardly make a shovel test within the town walls without finding a sequence dating from the 10th to 12th century AD.
Therefore, it is quite easy to say that the village grew up between AD 600 and AD 1000. However, this is a very unspecific assertion, which one could make without digging. The seven charts preserved in the archives from AD 803 and 1138 lead to the same conclusion with less work.
In order to search for new paths, we asked whether spatial analyses could be helpful. In 2007 we only made a first attempt by drawing provi-sional maps from the available data with the Krigingtool, which is one of the most used interpolation methods. Hereafter, we shall start from this point in order to challenge the potential of these tool for archaeology. The topic of predictive modelling is not brand new (a beautiful, detailed fresco of this fascinating topic is in Verhagen, Witley 2011, see also van Leusen 2002, chapters 5, 6) and it is somehow related to the debate between processualists and post-processualists, or, rather, to the pos-sibility to forecast unknown data from available ones. In particular, the kriging interpolation calculates the presumed value of a given variable in a given spatial location, starting from its known value in other nearby lo-cations. The result is usually visualised as a contour map where each contour line encloses all the points that have, or are presumed to have, the same value. Therefore, the kriging, as all the interpolation methods, evaluates data in relationship with their environment (for the general the-ory see Haining 2003, pp. 167-173, 327-333; also useful Bohling 2005). Usually, the geostatistical methods are very common in other fields than archaeology. However, we can find some references about the krigingin archaeology too (as Lloyd, Atkinson 2004, p. 152 pointed out; see also Wheatley, Gillings 2002, pp. 174-176). The kriging has been used to produce a DEM (Digital Terrain Model; Wescott, Brandon 2000) or to chart the distribution of a given pottery (Herzog 2007). More common its use to evaluate chemical analyses like the phosphate concentrations (Cavanagh, Hirst, Litton 1988). Finally we find it in the 3D modelling of stratigraphical sequence (Robinson 2010). Therefore, krigingis not unknown to archaeologists, though it has never been used
in a urban context, and, in particular, to investigate the rhythm of the ex-pansion of a settlement.
The main critique to the use of interpolation methods in archaeology is that we cannot forecast a specific behaviour of a given variable. This statement is true only if we think that interpolations should produce the truth. On the contrary, they only evaluate real data by adding a percent-age of impreciseness. Once we are fully aware of what interpolations do not do, we can use them properly, also in archaeology. To make a simple example, it is obvious that the pollution of a lake has a more determined cause than the choices of a community to expand a village over time. However, there is a percentage of unreliable factors in a pollution process too. And pre-industrial societies behave with a more determined outlook than contemporary archaeologists are willing to accept. No water means no settlement (excepting some Roman sites). No cultivable land means no permanent settlement either. Finally, ease of movement through a landscape raises of which path is suitable for travel on foot or with a donkey or a chariot. This is true at least from the Neolithic up to the 20th century.
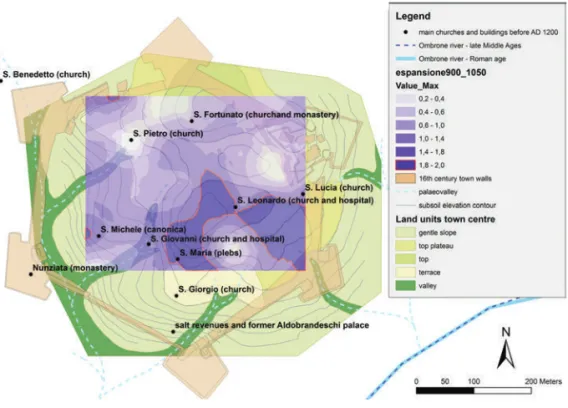
Another critique, as said, is that we are going to add an unknown per-centage of uncertainty to a data set, which has solid archaeological bases. This is true and that’s way it is highly recommendable to avoid any further interpolation. To rest upon the result of a kriging, or any other similar method, as if it was the original data set would take far away. Each interpolation must have its own dataset, coming from fresh and controlled data. In 2007, at the very end of the edition of the urban ex-cavations, we paid little attention to calibrate all the steps of the process and the final result was a simple overlay of three different layers of knowledge: the town centre land units map (elaborated by Antonia Arnoldus-Huyzendveld), the historical buildings (both existing and known by literary sources) and the archaeological record (fig. 2).
The interpolation we shall make hereafter starts from this first eval-uation, in order to ask whether these techniques can help archaeologists involved in studying a town and its development. Therefore, we shall pay more attention to each step, its significance and its role in the whole process.
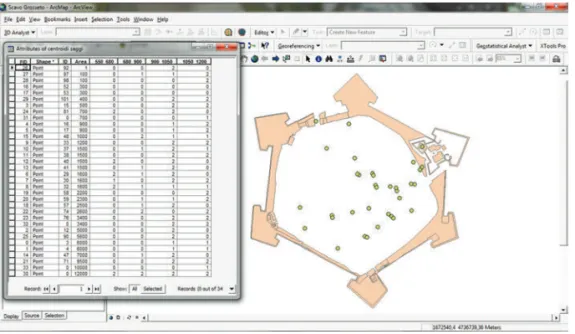
The first step is to ask how can we map the rhythm of the expansion of a town. In 2007 we chose to think at the excavation areas as points in a space, each of them having a fix value, i.e. a number indicating the presence-absence of stratigraphy of a given period. This is a very simple calculation, it does not manipulate the original dataset, and it allows the use of the krigingby reducing the sample areas to points. In ArcGis one can easily get the centroids of the polygons (i.e. the excavations area)
Townscape – Landscape. The shaping of the medieval town of Grosseto and its territory (AD 600-1400)
with the extension Xtools. The computer will generate a point shapefile. The centroid represents both an abstraction and a reduction of the sig-nificance of a surface. However, at a wider scale an excavation area can be represented by a point without loosing much.
The second step is to create a field within the attribute table of the type short integer to allow the kriging evaluation, which needs dots and numeric values. In particular, we need a numeric field for each period we wish to investigate. In 2007, we decided to create four fields, one for each phase of the period V – i.e. AD 550-680, 680-900 and 900-1150. The latter was divided in two more phases – AD 900-1050 and 1050-1150. This allows to see, whether changes occurred in the archaeologi-cal record by the time the ruling family of Aldobrandeschi started a more aggressive struggle against the former powerful institutions of the region.
The third step is to chose the range of values. Because the thresh-old is “yes” or “no”, values like “0” and “1” could fit well. In addition, we put a third value, in order to maintain a certain percentage of uncertain-ty of the archaeological record, which is never yes or no, true or false.
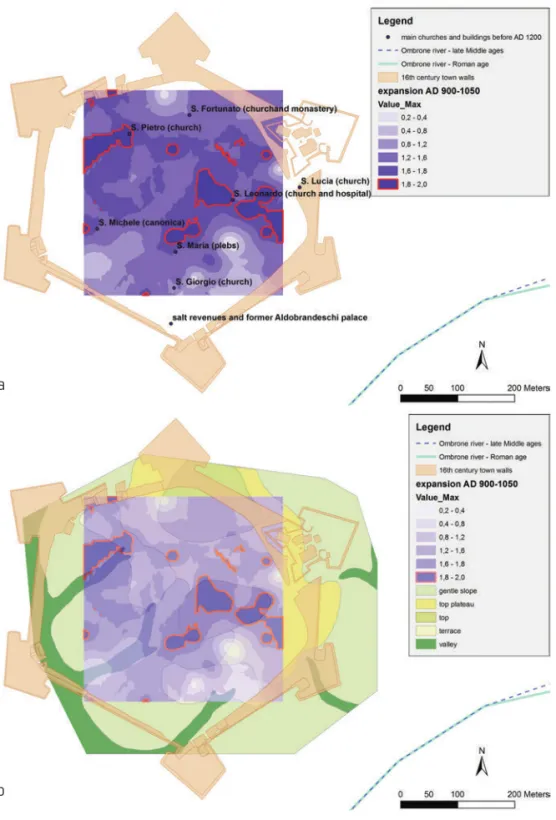
Fig. 2. The land units map of the town centre overlying the churches and buildings which are attested to or presumably already existed before AD 1200. The blue mask is the forecast expansion trend between AD 900-1050 (the red line marks the more inten-sive areas). The kriging’s values indicates the prediction of the presence of a stratig-raphy of this specific period (values around 2) or its absence (values around 0).
Therefore, a value 0 means no stratigraphy in the given phase, a value 1 means that there is a questionable stratigraphy (it could fluctuate be-tween two phases), and a value 2 means that there was a precisely dated stratigraphy (usually 14C dating or well preserved pottery
con-texts). The result is shown in fig. 3.
Based on these data, which do not cover the whole town centre with the same density, the interpolation produced by the kriging method pro-vides a coloured contour map for each phase as shown in fig. 2. The pe-culiarity of this map is that the dark blue area enclosed by the red line is signed as that with the highest possibility to find a well datable sequence of that particular time span, or, according to our values, the area where it is more likely to find a sequence with the value 2.
There is a large range of choices among the krigings and, obviously, each of them produces a rather different map. The first group is consti-tuted by the simple, ordinary, universal and indicator kriging, the second by probability, disjunctive and cokriging. Because the latter introduces a higher degree of uncertainty, for this case, the former seems more suit-able. Among them, the ordinary krigingis better than the simple kriging, because we can assume that the situation of the stratigraphical se-quence is similar in the proximity of each measured point instead of the whole town centre (we should remember that the point are centroids of excavations areas. Therefore, this does fit in well). To interpolate with
Fig. 3. The centroids of the excavations areas within the town walls of Grosseto. On the left the table of contents with the values for each period.
Townscape – landscape. The shaping of the medieval town of Grosseto and its territory (AD 600-1400)
more attention to the measured value reduces the percentage of uncer-tainty. We can choose ordinary krigingamong the choices in ArcGis-Geo-statistical analyst-geoArcGis-Geo-statistical wizard-kriging and choosing the input dataset (the point shapefile of the excavation areas’ centroids). In this particular case study we do not need to evaluate the distribution of the values themselves. They only depend on where we could excavate. How-ever, other case studies could need this step too.
The fourth step is to choose whether to work with an isotropic or anisotropic ordinary kriging. The former assumes that the data are dis-tributed without any trend, and the latter assumes that there is a trend. This is a very simple choice for a toxicologist. But it can be a hard one for an archaeologist. Sometimes our data suggest a direction – for in-stance the slope of a hill, or a river – sometimes they do not. Therefore, we had better to make both the isotropicand the anisotropic kriging, and then to compare the results. However, we also analysed the values to see whether there is a trend or not.
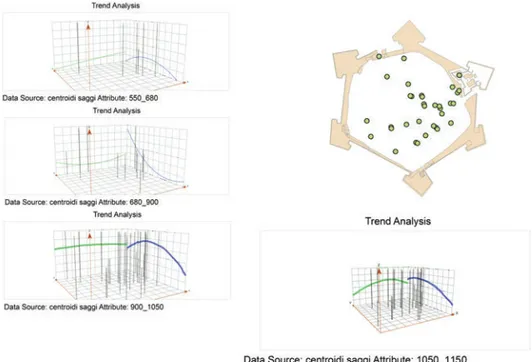
To evaluate whether there is a trend in the Grosseto dataset (fifth step), one can use geostatistical analyst-explore data-trend analysis. There is an E-W trend in the preserved stratigraphy of the period AD 900-1050 (fig. 4, blue line), while in the following period AD 1050-1150
Fig. 4. The trend analysis of the dot matrix reveals a different behaviour from AD 900-1050 and AD 900-1050-1150. The former shows a sharp E-W trend, the latter a trend both E-W and N-S.
the trend seems to be uniform in any direction (fig. 4, the blue and the green line almost coincide). The location of the diggings was random, but the stratigraphy we recorded is always well datable. Therefore, this graph suggests that, despite the location of the samples, there is a real trend. In addition, the U shape of both blue lines in the last two charts suggests that it is a second level polynomial trend.
This is a very important assessment and we shall take it into ac-count. Usually, we remove the trend when we run the kriging. On the contrary, in this case we should leave it, because it mirrors real data.
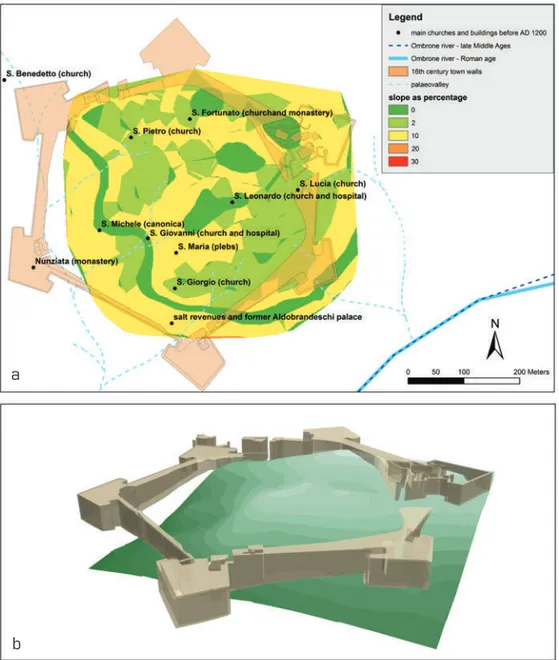
Is there a link between this datum and the elevation’s trend of the subsoil surface? Figure 5a and b show, respectively, the slopes map and a 3D modelling of the elevations contour map with an emphasized z value. It is noteworthy that the elevation trend of the plain where Grosseto was found and the town centre have roughly the same NE-SW direction. According to the map, it should be easier to develop the village along a N-S route, instead of an E-W one. Moreover, the land units map shows clearly that the most ancient churches of S. Pietro and S. Giorgio, both existing by AD 800, lay on a comfortable terrace, and that the most an-cient features of the small village – say from AD 600 to AD 800 – lay on the top or on the terrace. On the other hand, one can notice that the plebsof S. Maria (later the cathedral) and the salt revenue storage (later the Aldobrandeschi palace) lay in worse morphological conditions (fig. 2). The main question that these evaluations generate is whether a rather compulsory phase of urban development after the end of the Car-olingians (roughly speaking the 10th century) could have been
undertak-en, regardless of the morphological conditions, because of the need for space. In fact, after AD 1050, when the Aldobrandeschi family had es-tablished a stronger and more efficient ruling structure, the development seems to fill in the space left by the previous phase in almost every di-rection. Thus, this first analysis suggests that the threshold we put around AD 1050 in 2007 was a good starting point. According to these hypotheses, we worked with an ordinary kriging, without removing the trend and choosing a simple predictive map. The other two choices can be applied to special datasets. The last one, prediction standard error, is very useful for us and we shall talk of it later.
The sixth step is to choose which kind of semivariogrammis more indi-cated for this case study. The semivariogram is a crucial feature of the kriging, because it represents the spatial self-correlation among the val-ues. In fact, the final contour map depends both on the values and on their spatial location. There are several available choices. In general, one can as-sume that closer data can behave more similarly than distant ones. How-ever, archaeologists know very well that this is not true on excavations:
Townscape – landscape. The shaping of the medieval town of Grosseto and its territory (AD 600-1400)
closer diggings can produce different sequences. That’s why the kriging cannot be the final solution. On the contrary, it produces a forecast that must be related with other original datasets in order to help the interpre-tation. For this case study an exponential semivariogram, which produces a more similar curve to the ideal one, seems more efficient than other ones and prevent us to exceed the threshold of the mathematical formalism, which, for our case study, would take us too far away. Our dataset do not
Fig. 5. a) The slope of the subsoil visualized as percentage; b) The elevation contour map with the emphasized z value show a NE-SW direction.
a b
need a very smooth surface. Therefore, it is better to avoid the K-Bessel model, which is one of the available choices among the semivariograms. On the contrary, it is very useful when working with LIDAR datasets.
In the semivariogram box one can also profit of some other tools. In particular the lag size and the number of lags, which influence the final result, because they diminish or increase the spatial correlation among the values. The theory suggests that
Ls * nL = Dmax/2
where Ls = lag size, nL= number of lags and Dmax is the maximum distance between two among the observed values. Therefore, in the case study we could chose, respectively, 20 and 12. However, to increment the correlation we applied a lag size of 30 and a number of lags of 15. We tried the both and the difference is irrelevant. According to the good practice to avoid excess of formalism, we did not change the default val-ues of therange (the distance to the point where the semivariogram be-comes horizontal), the sill (the value that it has in that point) and the nugget (the difference between 0 and a point close to it where the semi-variogramhas no more value 0, though very close to it).
The result of the ordinary isotropic krigingis shown in fig. 6, along with the shapefileof the main buildings (fig. 6a) and that of the land units (fig. 6b). A first look at the picture we produced in 2007 shows some differ-ences. However, the two maps seem to be relative to each other. If we want to evaluate the map’s confidence, we can have a look at the values in the final report. In this case the mean is 0.1, very close to the expected value 0; the standardized root mean square is 1.048, which is very close to the expected 1. Finally, the root mean square and the average standard error are, respectively, 0.77 and 0.70 (approximations at the last deci-mal). We expected that they should be very similar.
The map predicting error is a helpful tool, which deserves further elaboration. It does not show where the forecast is true or false; it shows where the given dataset is good for that kind of evaluation and where it is not. It is more common to have a major error at the border of the mask, where it is hard to calibrate and spatially relate the values to each other, than at the core of it. In fact, if we compare the error map with the expansion predictive map, we notice that the major error seems to occur in the most western portion of the town centre, where we had the opportunity to dig less than everywhere else (fig. 7). There-fore, it is an area with less data. The same thing occurs in the small south-western and south-eastern parts. The north-eastern corner was
Townscape – landscape. The shaping of the medieval town of Grosseto and its territory (AD 600-1400)
Fig. 6. The ordinary kriging of the stratigraphic evidence for the period AD 900-1050 and the main buildings and churches attested before AD 1200 (a). The ordinary krig-ing and the land units map (b).
a
b
settled around the 13thcentury by Franciscans monks, who, besides the
previously abandoned Benedictine monastery of S. Fortunato, usually built their cloisters in the periphery of the late medieval Italian towns. Moreover, we think that all these parts of the town played only margin-al role until the building of the 16th century curtain wall. What this map
does show is that in the centre of the town the error is low. Moreover, the error is calculated on the dots’ values, which is independent of the type of kriging applied.
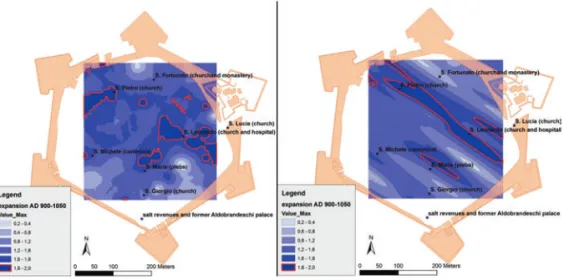
We repeated the process, choosing an anisotropic ordinary kriging, leaving the rest without any change (fig. 8). According to a preferred di-rection E-W, it seems that the most relevant development of the village between AD 900-1050 occurred in the very core of the early medieval one. It is close to the important church of S. Leonardo, which was built along a W-E route from the salt works to the inland. A little lower inten-sity is recorded in the central portion of the town centre. The two krig-ingsproduce rather different maps.
However, they both demonstrate a higher probability to find a well datable sequence to the period AD 900-1050 in the centre of the early medieval village, where the estimated error is lower. In other words these two maps also show the areas of the town centre where a more intense development in that period could be more likely to have occurred. The main differences are related to the direction of this process. If we do not follow the dots’ values E-W trend, it seems that the kriging dark-er areas is more uniformly distributed. If we assume that the trend means something, we must look at the anisotropic kriging.
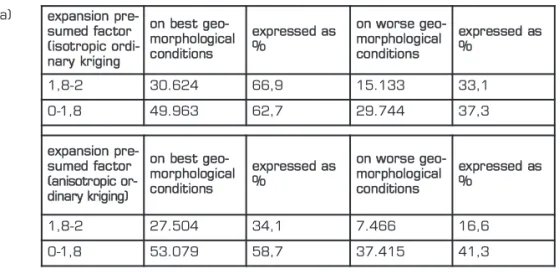
Is there any way to chose which of the two could be the most likely picture of the making of the town in the crucial period AD 900-1050? If we compare the two maps with the land units (as shown in fig. 6b for the isotropic ordinary kriging), and we intersect the two evaluated sur-faces, we notice that the 67% of the best geomorphological background seems to be affected by the developing village from AD 900-1050, against the 33% of the less favourable background. Therefore, in the first phase of expansion, people did not seem to care much where to build. Actually, a flat terrace is really more favourable than a gentle slope or a small valley, which is touched by seasonal streams.
We repeated the process for theanisotropic ordinary krigingmap (fig. 9). Despite a different geographical disposition of the presumed most in-tense expansion, these evaluations show that it is likely that it occurred both on better and on worse geomorphological conditions, for at least a third of the whole town centre. Therefore, we can be more confident about the result we gained, although the question as to whether it had a privileged direction or not is still unanswered.
Townscape – landscape. The shaping of the medieval town of Grosseto and its territory (AD 600-1400)
Fig. 7. The ordinary kriging of the presumed expansion intensity AD 900-1050 (left) and of the related error (right).
Fig. 8. The isotropic (left) and anisotropic (right) ordinary kriging compared.
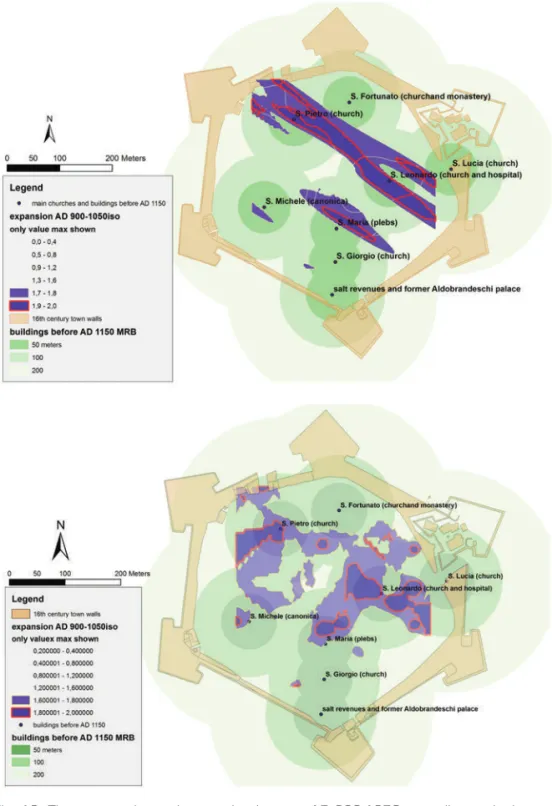
We can try to get more data by analysing the expansion predictive map in relationship with the known churches and buildings; we only take into account those existing before AD 1150 (fig. 10). The pictures sug-gest that the most intense development has been focused on the churches.
In fact, there is an evident match between the most intense develop-ment areas and the closer ring buffer, which is of just 50 meters, that we don’t need any chart to prove this relationship.
Fig 9. The absolute values and the percentages of the presumed most and least intense expansion of the village between AD 900-1050 in relationship with the more and less favourable geomorphological conditions, according with the land units map eval-uated by Antonia Arnoldus-Huyzendveld (a). The same data visualized as charts: left – isotropic ordinary kriging, right – anisotropic ordinary kriging (b). The most in-tense presumed expansion AD 900-1050 overlaying the land units map according to, respectively, the isotropic (c) and anisotropic (d) ordinary kriging.
expansion pre-sumed factor (isotropic ordi-nary kriging on best geo-morphological conditions expressed as % on worse geo-morphological conditions expressed as % 1,8-2 30.624 66,9 15.133 33,1 0-1,8 49.963 62,7 29.744 37,3 expansion pre-sumed factor (anisotropic or-dinary kriging) on best geo-morphological conditions expressed as % on worse geo-morphological conditions expressed as % 1,8-2 27.504 34,1 7.466 16,6 0-1,8 53.079 58,7 37.415 41,3 (a) (b) (c) (d)
Townscape – landscape. The shaping of the medieval town of Grosseto and its territory (AD 600-1400)
Actually, we can test the isotropic ordinary kriging for the second phase of the urban development (AD 1050-1150). From the results it is clear that there is a less intense expansion and that it is scattered, rather than being centred on the main buildings (fig. 11). In the conclu-sion I shall briefly discuss the potential historical significance of these analyses.
2.2. The landscape
Let’s make a jump, both in space and time, to the countryside sur-rounding the well- established town of Grosseto around AD 1200.
2.2.1. Why Grosseto did not become a major town? Analysing the site catchment
Despite the rapid growth of the new townscape, which took place around AD 1150-1200, with masonry buildings (both public and private) arising almost everywhere, and the translation of the bishop site from Rusellae, Grosseto did not become a major town in Tuscany.
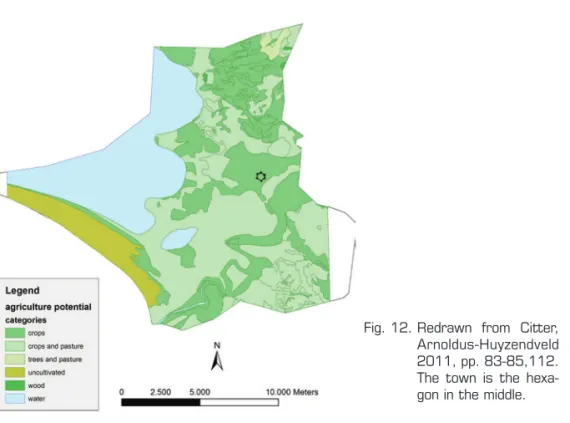
This fact has always fascinated local scholars. Analysing the geograph-ical context can help to search for new answers (Citter, Arnoldus-Huyzend-veld 2011). At first, we turned the land units map of the countryside into an agricultural potential map. Then we draw the presumed district of Gros-seto at the end of 13thcentury, according to the literary sources. Finally,
we overlaid the two maps and we evaluated how much land really could have been cultivated by the community in the period of its maximum power. We decided not to work with calories consumption, which seems to pro-duce better outputs in the cost weighted analysis (Gietl, Doneus, Fera 2008; Verhagen, Whitley 2011, p. 26). The result (fig. 12) clearly shows that this territory could feed at best no more than 8.000 people.
This number presumes that each single field with a high potential for crops was always cultivated and produced a very good harvest each year. Of course, this is unlikely. We concluded that the number of peo-ple living in the town district at the end of the 13th century was
prob-ably closer to 4.000, as derived from the literary sources. What does this mean for the history of Grosseto? The main conclusion is that this town had grown enough to be a central placein southern Tuscany, even though it was not large enough to compete with more populated and de-veloped towns of the region like Siena and Pisa, which had more than four times the population of Grosseto in the same period. Around the middle of the following 14th century the town had already gone under
the rule of Siena. It is noteworthy that the potential site catchment of
Fig. 10. The presumed most intense development AD 900-1050 according to the isotrop-ic kriging map and the multiple buffer ring centred on the existing buildings by AD 1150 (a). The presumed most intense development AD 900-1050 according to the anisotropic kriging map and the multiple buffer ring centred on the existing buildings by AD 1150 (b).
Townscape – landscape. The shaping of the medieval town of Grosseto and its territory (AD 600-1400)
Fig. 11. Isotropic ordinary kriging of the presumed most intense expansion AD 1050-1150, overlaying the multiple buffer ring centred on the main buildings and churches attested before AD 1150.
Fig. 12. Redrawn from Citter, Arnoldus-Huyzendveld 2011, pp. 83-85,112. The town is the hexa-gon in the middle.
2A good example of this kind of analysis is in POIRIER2007 and VERMUELEN, ANTROP2001, though
they both did not evaluate further these data with other ones.
the village was much smaller than the town district (a good example of calibrating Voronoi maps is in Arthur, Gravili 2006). I shall discuss in the conclusions a possible explanation of this stop, which was as rapid as its previous growth.
2.2.2. The making of a new landscape? Hypotheses about a commu-nal field system
The excavation in the town centre generated many questions, one of which is more puzzling than the others.
Can we see in the district of Grosseto the same process we record-ed within the walls between ca. AD 1150-1300?
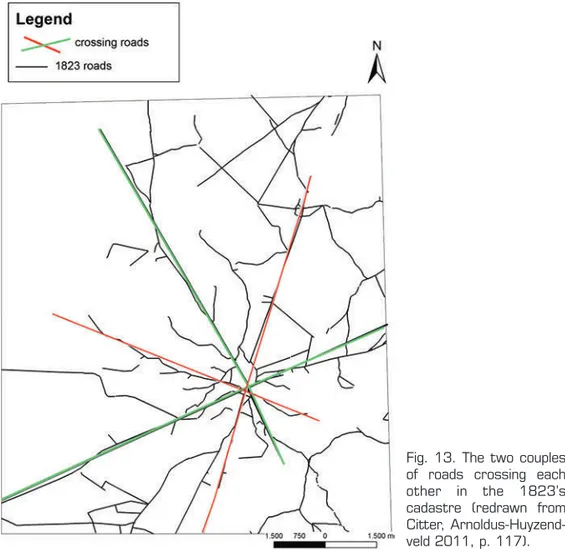
We assumed that the field system recorded in the cadastre of 1823 in a scale of 1:5.000 was a palimpsest of a long lasting process of adding new traces and erasing some of the former. Comparing this map with more ancient ones, it is clear that there are some features that do not seem to change at all: the main roads and the channels. This net had already been drawn on the landscape by the end of the 16th century.
Therefore, it is likely that it could preserve something of the period we wish to examine. Fig. 13 shows the main roads that seem to draw two crosses, intersecting each other and rotated ca. 45°.
According to this hypotheses, we digitized a portion of the cadastreas polylines, each segment being a single feature. We measured them and dis-carded those shorter than 30 m, which we assume reduces a potential distortion factor. Then we calculated the orientation of each segment and tried to solve the puzzle by looking at possible similarities among them. In other words: if there occurred a planning before AD 1823, whenever it happened, it must have left a coherent set of traces in the picture.
We started with the segments aligned with the two groups of perpen-dicular roads, which already existed in AD 1594. We only left ± 1° of tol-erance to prevent a distortion of the sample, thus calibrating the error within the digitizing process and the georeferencing of the maps2(fig. 14).
Then we can examine how many segments could be related to both, the distance from Grosseto and the cultivating potential of the soils. One can chose to work with linearand kernel density, instead of simple num-bers, because the density is a more accurate value. In fact, it produces a relationship between a population and a surface. It is obvious that 4 is more than 3. It is less obvious that if 4 people live in a 4 square meters room, and 3 people live in a 3 square meters room, they have the same
Townscape – landscape. The shaping of the medieval town of Grosseto and its territory (AD 600-1400)
density. The tool density is in ArcGis-arctoolbox-spatial analyst tools. Measuring the surfaces, both of the most productive land units and of the buffer rings centred on Grosseto, provided comparable numbers (figs. 15-16). This shows that the field boundaries aligned NW-SE have a closer relationship, in terms of density, with the more productive soils and with the proximity to Grosseto. On the contrary, those aligned with NE-SW behave in a different manner. If they both reflect planning, then they were different projects. The first was centred on the best land and on the proximity to Grosseto, the second on less favourable land and in-different to proximity. In fact, the density of segments within the buffers is almost the half in this second set.
This does not mean that each single segment of the NW-SE set was drawn on the ground in the same period. On the contrary, it is likely that this situation mirrors a long lasting process of sedimentation on the land-scape, whose beginning cannot be dated after AD 1594, when the roads
Fig. 13. The two couples of roads crossing each other in the 1823’s cadastre (redrawn from Citter, Arnoldus-Huyzend-veld 2011, p. 117).
already existed. However, the spread between the two density values is so great that one can hardly explain it other than to say that they had different origins. It is also clear that the roads cross at Grosseto. There-fore, they cannot be dated before AD 900 or 1000, when the relative-ly small village started growing. One possible answer to the question is that this palimpsest could hide a part of a project run by the community of Grosseto between AD 1150 and 1300. At the same time they con-structed a new town, with stone and brick buildings, streets and squares, the community could have taken the opportunity (a necessary one) to project its status in the rural district, by planning two crossing roads and a coherent field system. On the other hand, the second set, oriented NE-SW, could be earlier or even later. One can suppose an in-tervention by Siena as a clear sign of its rule over Grosseto, after its conquest in AD 1341.
We must always take into account Chouquer’s warning about the
Fig. 14. The two couples of perpendicular roads ex-tracted from the 1823’s cadastre and related to the field boundaries orient-ed in the same way.
Townscape – landscape. The shaping of the medieval town of Grosseto and its territory (AD 600-1400)
Fig. 15. The field boundaries aligned with Rusellae (NE-SW) and with Ve-tulonia (NW-SE) in relationship with the distance from the town centre (a), the same data as a chart of the densities (15b - top left) (b) and the soils’ potential related to the seg-ments aligned NW-SE (c). Both are overlain by the linear density map of the latter. ! ! /< 9+ ! * ! ! ! ! 8 + . 5726 : % & # a b c
Roman centuriation: what we see in our contemporary maps and aerial photographs does not reflect the project recorded by the literary sources (Chouquer 2007). All those streets, ditches and channels are contemporary. Moreover, it is unlikely that both a Roman centuriation and a Medieval field system could be planned and executed in a short span of time, without any change. It is no more than a hope that it had only partial changes without any revival.
Fig. 16. The model used to build the watershed and the streams of the Grosseto’s plain. The input dataset is the blue oval on the left. The green ovals are the re-sults of each working process (yellow rectan-gle). The blank ovals are optional processes that we decided not to acti-vate in this model.
Townscape – landscape. The shaping of the medieval town of Grosseto and its territory (AD 600-1400)
It is noteworthy to mention that the new Siena’s land system based on the so called dogana dei paschi, a sort of revenue from the breeding of sheep and goats. A new political system could deserve a new visible field system, oriented toward the new centre: Siena. There is no need to think at the Romans, because we have indications that also during the Middle Ages there occurred regular plannings. Fig. 15a in particular shows the changing relationship between the multiple ring buffer centred on Grosseto and the density of the segments within each of them.
It is noteworthy that the linear densityof the segments aligned NW-SE indicates a precise direction: the road from Grosseto to the salt works, which we know were the main resource of the region, exploited until ca. AD 1350 (fig. 15c).
2.2.3. Managing the water in an alluvial plain: working with the hydrology tools3
Managing the water in an alluvial plain that is frequently affected by flooding and potentially full of small marches is a matter of survival. We can study the environment thanks to the ArcGis extension spatial ana-lyst – hydrology tools. The first step is to get a DEM of the selected area, which is now a very simple process. We used the point shapefile of the plain elevations, which we elaborated in 2007 to draw the lagoon in the Roman period. The shape comes from the elevations of the Regional 1976 vector cartography of the province of Grosseto. We took off all the points that lay upon a roof of a building, a ditch’s ridge and the likes, in order to avoid any distortion. After this, we subtracted an elevation of 3,5 m. in the area of the lagoon close to the Ombrone river and 2,5 m farther away from it, i.e. out of the geological terrace. Finally, we set in the view all the points with an elevation higher than 30 meters above the sea level to 30 (fig. 16). This produces a more detailed map of the lower elevations, though they are still preserved for further calculations. Ar-cGis allows to build a model, which is a very helpful tool when the goal is to create a standardized process that differs from the input dataset.
The process starts with ArcGis toolbox-spatial analyst tools-interpo-lation-topo to raster, which creates the DEM. This process usually has some weak points that are sinksin the raster. Therefore, it is better to fill the sinks. Then the flow direction and the flow accumulation may be evaluated. After this, the process follows two different paths: one pro-duces the watersheds; the other the streams. To get the watershed
3I wish to thank Antonia Arnoldus-Huyzendveld for her help to produce this paragraph. PCA 2 font puliti_gao 6 17/05/12 09.48 Pagina 191
map, Arcgis needs the flow direction raster, which comes from the DEM without sinks and the pour points shapefile, which is a matter of choice. The result is shown in fig. 17.
To get a better map, it is suggested (http://istgeo.ist.supsi.ch/site /node/13) to emphasize the preferred water flow direction assuming with mapalgebrathat flowacc > 100, 1. One can also obtain this with raster calculator. In other words: we force ArcGis to evaluate only two poten-tial classes: the first one is composed by all cells that have more than 100 cells flowing into them, being the rest set to null. This calculation forces the stream network to come out of the map. This is very useful
Fig. 17. The watersheds of Grosseto’s plain in the Roman period and the presumed coast line and Ombrone flow. The watersheds starts with the higher levels, i.e. brown colour, and go on with yellow and green, which are the intermediate levels.
Townscape – landscape. The shaping of the medieval town of Grosseto and its territory (AD 600-1400)
in this case, because we need to draw the potential water flow during a particularly severe rainy season in a plain. This situation would have greatly affected the choice to build a farm, a villa, a salt-work or a road. The model ends with the creation of the stream link and, finally, the stream order. The last step is to transform this raster to a shapefile with the tool stream to feature. This is the potential map of all the streams of the plain, both seasonal and permanent (fig. 18).
This process did not consider the presence of the Ombrone river. We are going to improve this part of the evaluation by adding the weight of a major permanent river and run the model again (more details in Citter fc). However, it does not change much the map in the crucial area of the ancient lagoon NW of Grosseto.
Fig. 18. The potential stream network of the plain during the Roman period. The eleva-tions used for the DEM cover an area larger than that of the Roman presumed coastline. Therefore, to ease the understanding of the picture, the stream net-work has been overlain by the extension of the lagoon and the sea (blue area).
If we visualize all together, it is crystal clear that Grosseto was found-ed on a very special area, which was surroundfound-ed but not affectfound-ed by water (fig. 19). In particular, it is noteworthy that this network almost perfect overlays with the streams network evaluated by Antonia Arnoldus-Huyzendveld in 2007 for the town centre, according to the el-evations recorded during the excavations. Thus, the area where Grosse-to was found appears Grosse-to have been a small height surrounded by season-al streams, though we cannot exclude that some of them would be per-manent. They brought the water away from the plateau in at least two directions: the first one leads to the Ombrone, the second to the low-land SW of the village, where in 2007 we guessed that the most ancient salt works were positioned.
The Roman period salt works position is a potential weak point and a puzzling question. However, we can summarize our evaluations by isolat-ing a rather small area in the plain (fig. 20) to investigate with geophysics, trenches and, possibly, larger excavations, in order to answer to a spe-cific question: was this the area of the salt works before those recorded in the 13thcentury on the opposite side of the geological terrace? Is this
the potentially most likely position of the salt works from the Etruscans
Fig. 19. The streams around the town centre of Grosseto evaluated in 2007 (red) ac-cording to elevations recorded during the excavations and those evaluated with the hydrology tools according to the presumed elevations of the plain in the Roman period (light blue).
Townscape – landscape. The shaping of the medieval town of Grosseto and its territory (AD 600-1400)
(or earlier) to the early Middle Ages? We went on with the model by choosing a pour point (a point where all the water flows into the system) at the rivers crossing closest to the presumed Roman age coastline. The choice was not that easy, but, the salt works did not need a deep basin, as it was presumably positioned nearly at the sea level. The chosen pour point is at -0,89 cm. After, we assumed an artificial dam of about 75 cm above the pour point (this is what they found in Maccarese near Rome, see Arnoldus-Huyzendveld et alii 2009) and we evaluated the potential basin (fig. 20, red line). Finally, we assumed a normal 40 cm deep basin for salt working at the bottom of the larger one (fig. 20, cross-hatched). Both of these calculations are easy within the model with map algebra. The dam should be no longer than 230 meters (very small compared to the nearly 1000 meters line of amphorae found in Maccarese).
The result is a potential basin of ca. 7,8 hectares of which just ca. 3,2 hectares is the lower portion. If we evaluate the potential salt pro-duction for the whole basin according to a standard formula area (in hectares) * 10,000 (area in square metres) * 1,200 (mean salt grams per square metre) * / 1,000,000 (grams in a ton) = 94 tons. Otherwise, the marginal area could produce some 55 tons and the inner area 39 tons. We tried the same process for other areas, closer to Grosseto, but the elevations do not allow to get a basin, excepting one hundreds of
Fig. 20. The most interesting area to investigate according to the above evaluations.
hectares in dimension, which seems unlikely. It is noteworthy to say that this location is close to two Iron Age tombs, well known in the literature, which could give some indications about the chronology.
The calculation based upon a 10 m cell size DEM is even too fine for the given elevations dataset. In fact, the nearest neighbour mean is 108 m. Therefore, we run the model changing the cell size from 10 m to 50. However, the result quite perfectly overlaps the previous one.
3. Conclusions: rem tene, verba sequentur
Spatial analyses in archaeology do not always produce answers, but, they do help to ask new questions. The starting point, which makes this approach similar, though not identical, to that of a geographer, is the his-torical question (a detailed history of the debate in Verhagen, Whitley 2011). We had no chance of understanding the growing process of Grosseto according to the archaeological record as a chronological se-quence of walls, living spaces, dumps and pottery. In 2007, we could re-late the making of a town to the transformations of the landscape. This is not that common in Italian archaeology, whose site-centred approach is a far cry of its idealistic root. As yet, for many Italian archaeologists, landscape means settlements within an empty space, and the main goal seems to find the most ancient or the most recent potsherd of a given class to draw a point on a blank sheet with a fixed chronology. Thus, the transformation of the landscape is just a series of blank maps, each of them showing a certain number of dots.
Spatial analysis do not tell us the truth, but they give us suggestions as to how to relate our data in different, sometimes unexpected, ways. The use of these tools has allowed to sketch another, more detailed story of Grosseto and its neighbouring territory, which I’m going to sum-marize hereafter4.
The transformations that occurred in Grosseto and its community seem to have taken place in a crucial period of European and Italian his-tory. After the end of the Carolingians, new rulers came to the fore. Among them, a family (in the broadest sense) called Aldobrandeschi. They appear in the sources at the beginning of the Carolingian period, as private proprietors in the region of Grosseto. By the end of the same pe-riod they were already playing a public role. The spatial analyses made within the town centre suggest that the growth was rapid, somehow
4In CITTER, ARNOLDUS-HUYzENDVELD2011 we provided a detailed and updated literature on the
Townscape – landscape. The shaping of the medieval town of Grosseto and its territory (AD 600-1400)
chaotic, starting from the core of the former small village. It seems to have ended by AD 1050, when the Aldobrandeschi changed their behav-iour, starting a more intensive struggle with the former Lombard and Carolingian rulers (in this region the bishop of Rusellae). By the same time they also developed a more structured method of ruling. The growth of Grosseto may not have been so chaotic as it seems, as the close re-lationship of the kriging‘s map with the churches suggests. Whether they were the foci of the developing community or its result, is still a puzzling question. However, it seems that the altered approach of the Aldobran-deschi affected the growing town. It is noteworthy to mention a failed at-tempt to stop the increasing importance of the town’s community with the foundation of a new Grosseto in a very unfavourable position in AD 1179 on the highest hill of the region, which has no water and not much space to develop a town.
Moving from the town centre to the landscape new questions arise, thanks to the spatial analyses. Did the growth stop by AD 1050 be-cause the Aldobrandeschi put a halt on it, or bebe-cause the territory had already reached its maximum population? Were the Aldobrandeschi ac-tors in the development of the town or did they simply stop its growth by protecting the surrounding settlements? We know that at least two sites were abandoned after the bishop came to Grosseto. Actually, the only one we excavated – Poggio Cavolo - does not seem to have been a major village in the 12th century. Poggio Cavolo is a very intriguing site.
Founded in AD 800 (possibly by the bishop of Rusellae in order to pro-tect the weak southern portion of his bishopric) as a church with a sur-rounding enclosure, it was transformed into a small castle in the same period in which Grosseto had finished its compulsory growth, as sug-gested by these analyses. Are the two events related to each other? Were the Aldobrandeschi the promoter of the castle? Was it part of a project to root their rule in this region?
The Aldobrandeschi failed to stop Grosseto, at least its economic de-velopment. The abandonment of Poggio Cavolo, Poggio Calvella, Rachalete, the failed foundation on the hilltop of Moscona and the salt revenues’ agreement seem more than coincidences. Moreover, they all occur in a time span of ca. 50 years and they are all settlements sur-rounding Grosseto.
At the beginning of the 13thcentury Grosseto was a communal town
that started to behave as the more powerful and rooted towns of the re-gion, but on a more local scale. The rulers produced written sources and monuments, and they planned a new townscape which shifted the core from the high flat area of the former village to a less favourable, though larger, space in the SW portion of the later walled town. Somehow,
tween the ancient village and the Aldobrandeschi’s palace, the new com-munity of Grosseto developed and left us little more than a trace.
Did they plan to transform the district too? It is not unusual to find medieval regular planning in both Italy and Europe. The spatial analyses suggest that they started to shape a field system aligned to the major roads, which had developed over time, but after Grosseto had become a central place. How and, even, whether these roads echoed former routes, is an open question. As it is another query: did they just begin a planning, or did they continue until Siena had taken control of Grosseto? An answer to these questions can only come out of a series of sample excavations in crucial points, aimed to get stratigraphical sequences of field boundaries, fences, channels, and so on.
It would be tempting to say that the planning project started, but was stopped by Siena who planned a new landscape, rotating the main axes of 45°, to align the fields to the new road, that lead from Siena to the harbour of Talamone, via Paganico and Grosseto. The first system privi-leges the more productive soils and the proximity to the town. The sec-ond does the opposite.
The position and the production capacity of the salt works is another intriguing issue. Did they place the salt works in the area that these analyses indicate from the Iron Age until AD 1000, so as to shift to the opposite part of the terrace until they had to make new efforts closer to the new coastline in the late Middle Ages? New tools raise new ques-tions and allow a new digging strategy to be deployed. It would hardly have started if we were only equipped with the tools of the past gener-ation’s historical archaeologists.
Townscape – landscape. The shaping of the medieval town of Grosseto and its territory (AD 600-1400)
References
ment: Comparison of Different Cost Surface Modules, in A. POSLUSCHNY, K. LAMBERS, I. HERzOG(eds) 2008, Layers of Perception, Proceedings of the 35th
International Conference on Computer Applications and Quantitative Methods in Archaeology, (Berlin, 2007), Bonn, pp. 342-350.
R. HAINING 2003, Spatial data. Theory and practice, Cambridge.
I. HERzOG 2007, Testing GIS Methods by Means of Simulation. Detecting and Describing Find Spot Densities, 11 Workshop Archaeologie und Computer, pp. 1-16.
C.D. LLOYD, P.M. ATKINSON2004, Archaeology and geostatistics, “Journal of Archaeo-logical Science”, 31, pp. 151-165. N. POIRIER 2007, Un espace rural en berry
dans la longue duree: experience de micro analyse des dynamiques spatio-temporelles du paysage et du peuple-ment dans la region de sancergues (Cher), PhD Thesis, University of Tours. P.M. VAN LEUSEN 2002, Pattern to process: methodological investigations into the for-mation and interpretation of spatial pat-terns in archaeological landscapes, PhD Thesis, University of Groningen (NL). F. VERMUELEN, M. ANTROP(eds) 2001, Ancient
lines in the landscape. A geo-archaeo-logical study of Protohistoric and Roman roads and field systems in north-western Gaul, Leuwen-Paris. P. VERHAGEN, A. BORSBOOM2009, The design
of effective and efficient trial trenching strategies for discovering archaeologi-cal sites, “Journal of Archaeologiarchaeologi-cal Science”, 36, pp. 1807-1815. P. VERHAGEN, T.G. WITLEY 2011, Integrating
Archaeological Theory and Predictive Modeling: a Live Report from the Scene, “Journal of Archaeological Method and Theory”, february 2011. K.L. WESCOTT, R.J. BRANDON (eds) 2000,
Practical applications of GIS for ar-chaeologists: A predictive modeling kit, London.
D. WHEATLEY, M. GILLINGS2002, Spatial Tech-nology and Archaeology: The Archaeo-logical Applications of GIS, London. A. ARNOLDUS-HUYzENDVELD, D. CITRO, A. FACCIO
-LO, M. GALA, M.C. GROSSI, C. MORELLI, M.L. RINALDI, D. RUGGERI, S. SIVILLI
2009, The Lagoon of Maccarese (Rome-Fiumicino): environmental and archaeo-logical developments over the last 3000 years, Poster presented to the confer-ence Wetlands as archives of the cultur-al landscapes: from research to manage-ment (Genova, 29-30 gennaio 2009). A. ARTHUR, G. GRAVILI2006, Approcci
all’ana-lisi degli insediamenti e loro confini ter-ritoriali nel medioevo, in R. FRANCOVICH, M. VALENTI(eds),IV congresso naziona-le di archeologia medievanaziona-le (Chiusdino-Siena, 26-30 settembre 2006), Firen-ze, pp. 31-36.
G. BOHLING2005, Kriging. Online in: http:// people.ku.edu/~gbohling/cpe940/ (ac-cessed 26 February 2012)
W.G. CAVANAGH, S. HIRST, C.D. LITTON1988, Soil Phosphate, Site Boundaries, and Change Point Analysis, “Journal of Field Archaeology”, 15.1, pp. 67-83. G. CHOUQUER 2007, Quels scénarios pour
l’histoire du paysage? Orientations de recherche pour l’archéogéographie, Coimbra-Porto.
C. CITTER (ed) 2007, Archeologia urbana a Grosseto. Origine e sviluppo di una città medievale nella “Toscana delle città deboli”. Le ricerche 1997-2005. II: edizione degli scavi urbani 1998-2005, Firenze.
C. CITTERfc, Archeologia delle città toscane nel medioevo (V-XV secolo). Fotogram-mi di una complessità, Mantova. C. CITTER, A. ARNOLDUS-HUYzENDVELD (eds)
2007, Archeologia urbana a Grosseto. Origine e sviluppo di una città medieva-le nella “Toscana delmedieva-le città deboli”. Le ricerche 1997 – 2005. I: la città di Grosseto nel contesto geografico della bassa valle dell’Ombrone, Firenze. C. CITTER, A. ARNOLDUS-HUYzENDVELD 2011,
Uso del suolo e sfruttamento delle ri-sorse nella pianura grossetana nel me-dioevo verso una storia del parcellario e del paesaggio agrario, Roma.
R. GIETL, M. DONEUS, M. FERA 2008, Cost Distance Analysis in an Alpine