Global J. Environ. Sci. Manage., 2(2): 95-104, Spring 2016
AB ST RA CT: During the last years, several exceedances of PM10 and benzo(a)pyrene limit values exceedances were
recorded in Taranto, a city in southern Italy included in so-called areas at high risk of environmental crisis because of the presence of a heavy industrial district including the largest steel factory in Europe. A study of these critical pollution events showed a close correlation with the wind coming from the industrial site to the adjacent urban area. During 2011, at monitoring sites closes to the industrial area, at least the 65% of PM10 exceedances were related to wind day conditions (characterized by at least 3 consecutive hours of wind coming from 270-360±2deg with an associated speed higher than 7 m/s). For this reason, in 2012 an integrated environmental permit and a regional air quality plan were enacted to reduce pollutant emissions from industrial plants. A study of PM10 levels registered during windy days was
performed during critical episodes of pollution highlighting that the difference between windy days and no windy days’
concentrations reduces from 2012 to 2014 in industrial site. False negative events (verified ex-post by observed meteorological data) not identified by the forecast model - did not show a significant influence on PM concentration: PM10 values were comparable and sometimes lower than windy days levels. It is reasonable that the new scenario with a relevant reduction emissions form Ilva plant reduced the pollutants contribution from industrial area, contributing to PM10 levels decrease, also in false negative events.
KEYWORDS:Air pollution; Benzo(a)Pyrene (B(a)P); Mitigation policies; Particulate matter (PM); Steel plant Global J. Environ. Sci. Manage., 2(2): 95-104, Spring 2016
DOI: 10.7508/gjesm.2016.02.001
*Corresponding Author Email:[email protected] Tel.: +39 0805 060 602; Fax: +39 0805 060 111 Note. Discussion period for this manuscript open until June 1, 2016 on GJESM website at the “Show Article”
Effect of the Apulia air quality plan on PM
10and benzo(a)pyrene
exceedances
L. Trizio1,*, L. Angiuli1, M. Menegotto1, F. Fedele1, R. Giua1, F. Mazzone1, A.G.C. Carducci1, R. Bellotti2,3, G. Assennato1
1Arpa Puglia, C.so Trieste 27 IT-70126 Bari, Italy
2Dipartimento di Fisica, Universita degli Studi di Bari, via Orabona 4- IT-70125 Bari, Italy 3Istituto Nazionale di Fisica Nucleare, Via Orabona 4, IT-70125 Bari, Italy
INTRODUCTION
The industrial city of Taranto is located in Apulia, a southern Italian region. Due to the numerous and highly impacting industrial activities, Taranto is included in the so-called areas at high risk of environmental crisis. The town hosts a heavy industrial district,
unfavourably positioned towards nearby residential areas, including the largest steel factory in Europe (Ilva), an oil refinery (Eni) and a kiln factory (Cementir). Among these industrial plants, particular attention is turned to the steelworks. Ilva plant is extended on a surface of 15.000.000 m2 with 200 Km of railway tracks, 50 Km of roads, 190 Km of conveyor belts, 5 blast furnaces and 5 converters. Coke ovens are one of the most relevant emissions’ sources. Here coal is pyrolysed at 1100 °C to produce coke and pyrolytic
ORIGINAL RESEARCH PAPER
gas. Fugitive emissions mainly occur from leaks at the closed openings of the coke oven batteries or can be caused by non-captured emissions during coke pushing and coal charging. Even closure facilities according to the state of the art in technology and under best state of maintenance might be not enough to avoid these emissions. As most relevant components they contain suspended particle matter, polycyclic aromatic hydrocarbon compounds (PAHs) and benzene (US EPA, 2001; Fisher, 2001; Fisher and Hein, 2001). Storage and handling of primary materials in the stockyards and transportation of materials are the major sources of particulate. The industry contributes about 70% for air pollution in Taranto city, as reported in Regional Atmospheric Emissions Inventory (Arpa, 2010). The most critical neighbourhood of Taranto is
called Tamburi. It is located at less than 1 km from the stockyard, downwind from North-West quadrant to industrial area. Some authors have shown the relevance of atmospheric particulate matter and micro pollutants monitoring for air quality management studies (Khalili et al., 1995; Fisher 2001; Yang et al., 2002; Sai et al., 2007). Particulate matter pollution is currently under intensive research owing to the effects of these atmospheric constituents in human health, climate, visibility and ecosystems, among others. It is proven that increased exposure to PM10 (suspended particles with diameter under 10 µ m) is associated with adverse health effects (Brunekreef and Holgate, 2002; Perez et al., 2008, Perrone et al., 2010, Polichetti et al., 2009). In individuals with pre-existing lung disease, inhalation of nanoparticles may induce inflammation and Fig. 1: Taranto air quality monitoring network
Global J. Environ. Sci. Manage., 2(2): 95-104, Spring 2016
exacerbate respiratory and cardiovascular effects through the induction of oxidative stress and inflammation (Ferin et al., 1992; Seaton et al., 1995; Utell 2000; Haddow et al., 1937). In terms of air quality, mass concentrations of atmospheric particulate matter under specific particle sizes are currently controlled. The European Air Quality Directive 2008/50/EC regulate the mass concentration of particles under 10 and 2.5 microns (PM10 and PM2.5). PAHs are well known for their carcinogenic properties for some time now. Some PAHs are classified as potent carcinogens. The benzo(a)pyrene (B(a)P) is referred to as one of the most potent carcinogens known. In young rats, a single intraperitoneal injection of 10 mg B(a)P per animal caused an immediate, sustained reduction in the growth rate (Ferin et al., 1992). IARC classified B(a)P as carcinogenic to humans (Group 1) and the major part of the other PAHs as possibly carcinogenic to humans (Group 2B) (IARC, 2010). In order to monitor the impact of industrial emissions on the ambient air in Taranto, an air quality monitoring network was activated since 2004 (Fig. 1).
In this network, PM10 is monitored by two different kind of instruments, both based on ß attenuation method: SWAM 5a monitors (FAI Instruments s.r.l. Rome, Italy) and MP101M (Environnement S. A., Poissy Cedex, France). B(a)P determination is carried out on PM10 filters collected in three Taranto sites, according to UNI EN 15549:2008. PAHs are separated by HRGC on a DB-5 MS capillary column (30m× 0.25mm, 0.25μm film thickness, J&W Scientific, California). Isotope-dilution high-resolution mass-spectrometry (HRMS) determinations are carried out on a DFS High Resolution system (Thermo Fisher, Bremen, Germany) at a resolution of 10,000 operating with electron ionization (EI) at 45 eV in the selected ion monitoring SIM mode. In the last years, several PM10 and B(a)P limit value exceedances were recorded in Tamburi (Amodio et al., 2008). A study of these critical pollution events showed a close correlation with wind conditions, encouraging the pollutants transport from the industrial site to the adjacent urban area (Amodio et al., 2013). Based on the historical statistical analysis of meteorological measurements in a monitoring site on the coastline, a criterion for the daily identification of these events named windy days (WD) was defined: these critical days are characterized by at least 3 consecutive hours of wind coming from N-NW and speed higher than 7 m/s. In 2011, at closest monitoring sites to industrial
area, at least the 65% of PM10 exceedances was related to WD conditions.
Other pollutants, such as NOx and SOx, do not show a correlation with windy days and do not have significative variations along the years and for this reason are not discussed in this paper.
In October 2012 the Italian Environmental Ministry grant the Integrated Environmental Permit to ILVA prescribing the emissions reduction by BAT application. In particular, ILVA had to cover mineral parks and to install fog cannons and a monitoring system including new sensors along the external perimeter of the plant. Moreover ILVA had to draw back raw material stockyards and to guarantee other measures concerning the transportation belts in order to reduce dust emissions, the stoppage of the n. 5 Blast furnace in 2014 and the revamping of various plants (BFs, coke oven batteries, sinter plants). In the same year, in order to improve air quality in Tamburi, Apulia Government adopted the regional air quality plan (Regione, 2012). This act constrained industrial plants to reduce by 10% B(a)P and PM10 emissions by diffuse and point sources respect to mean daily values, during Windy Days. The occurrence of WD is forecasted in advance of 72 hours by means of an appropriately tuning meteorological mesoscale model.
The present work is organized as follow: a preliminary analysis is reported in order to show the performance of currently used criterion for WD classification and the comparison with other possible criteria. PM10 and B(a)P concentration from 2009 to 2014 are analyzed at the aim of valuating the concentrations of these pollutants in the urban area of Taranto before and after the air quality plan. The study has been performed in in Taranto area in Italy since 2012.
MATERIALS AND METHODS
Results of the preliminary analysis performed on 8 years (2005-2012) time series of PM10 and meteorological data from Taranto air quality network are shown in this section. Time series were built in order to identify the best meteorological criterion for the identification of those days characterized by exceedances of regulatory limits among the entire dataset. This analysis focuses on the relation between wind conditions and PM10 concentrations.
An a priori separation according to specific criteria built on meteorological features (wind speed and direction) has been performed, dividing the PM10
Global J. Environ. Sci. Manage., 2(2): 95-104, Spring 2016
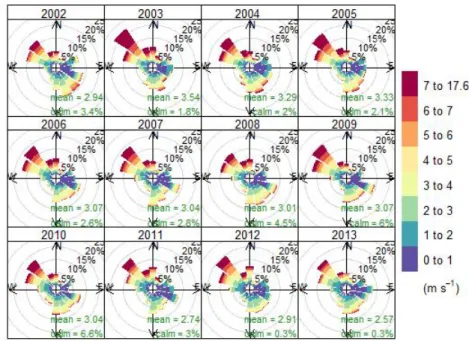
concentration dataset into two classes: windy days (WD) and no windy days (nWD). More in detail, the meteorological criteria was built on the meteorological data from the station named “San Vito”, located in Taranto city, fixing a wind direction quadrant (270° d” θ d” 360°), which is a site-specific factor, and choosing different wind speed thresholds and different numbers of consecutive hours of wind speed above this threshold. For each criteria, that is for each WD/nWD separation, a PM10 concentrations distribution has been built. Observed San Vito annual wind roses for the period 2002-2013 are reported inFig. 2. In Fedele et al., 2014, a complete analysis of several criteria was performed for Tamburi monitoring site, showing that the median values of the PM10 distribution relative to each WD classification had an increasing trend with respect to the chosen wind speed thresholds. In the present study, only higher threshold criteria are considerate (Table 1).
A total number of 2752 days were analyzed for the classification WD/nWD. 98 days of them were deleted
from the dataset because characterized by Saharan dust advection and therefore not linked to industrial pollution (Escudero et al., 2007). In the period of interest 282 exceedance days occurred.
For each criterion ofTable 1 the total number of WD, the number of WD matching with exceedance days and sensibility are reported inTable 2. Sensitivity is calculated according the following equation:
FN TP TP y sensitivit
Where TP is the number of True Positive, that is the number of WD correctly identified, while FN is the number of False Negative, that is the number of WD not identified.
The size of WD set (total number of WD) decreases moving from 7-3 criterion to 9-4 one, being each set a subset of the previous.
As regards the number of WD matching with exceedance days (n. of WD with PM10>50 µg/m3 inTable 1) decreasing values are observed moving from 7-3 to 9-4 criterion. This not obvious result indicates that the meteorological features used to build the criterion are not completely adequate to explain the phenomenology. Some other features would be necessary to obtain a better classification in terms of exceedance days. This aspect will be deepened in future studies.
Fig. 2: Annual wind roses for the period 2002-2013 registered at San Vito station. Table 1: Meteorological criteria for WD classification selected
from Fedele et al., 2014
Wind speed threshold (m/s) =7(m/s) =9(m/s) Persistence (number of hours) Identification Code
3 7-3 9-3
Global J. Environ. Sci. Manage., 2(2): 95-104, Spring 2016
Therefore, according to a precautionary approach, the 7-3 criterion is the more suitable, as it identifies the major number of exceedances without penalizing excessively sensibility. For this reason it is the criterion used operatively in the regional air quality plan. RESULTS AND DISCUSSION
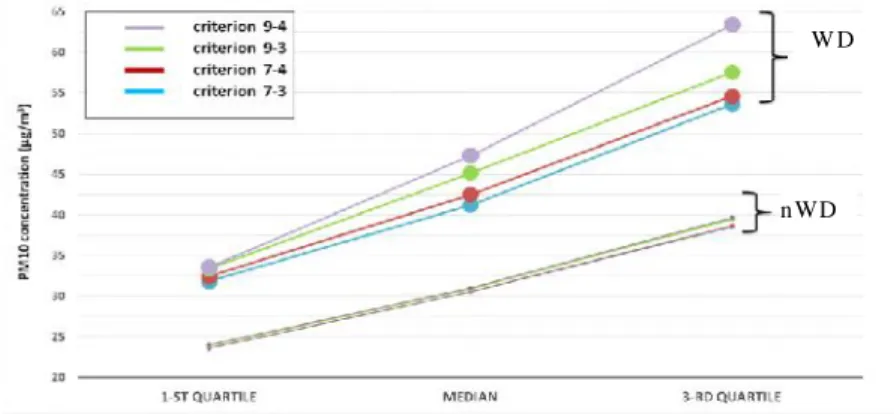
At the aim of a complete quantitative evaluation of the selected criteria in the previous section, main quantiles of the PM10 distributions in Tamburi site in WD and nWD classes are reported inFig. 3. WD class shows concentration values higher than nWD class.
This behavior has been discussed in Fedele et al., 2014 showing that Tamburi area represents a singularity because it is near and downwind during WD to the industrial area. The same evaluation has been performed for a background site named Talsano (a Taranto neighborhood similar to Tamburi in population density and urban morphology but much farther from the stockyard). Results are reported in Fig. 3.1: WD class shows concentration values lower than nWD class as expected because of the diluent effect of intense winds. Furthermore for Tamburi WD class the quantile values increase moving from 7-3 to 9-4 criterion (Fig. 3) meaning that the higher wind speed the higher industrial PM10 fallout. Differently, for Tamburi nWD class the quantile values almost overlap as the industrial area effect becomes negligible. Regarding Talsano WD and nWD classes (Fig. 3.1) no significant increase is observed in both cases meaning that no direct industrial fallout is present.
Criterion 7-3 7-4 9-3 9-4
Total n. of WD 347 299 142 116
N. of WD with
PM10>50µg/m3 106 95 52 47
Sensitivity 30.5% 31.8% 36.6% 40.5%
Table 2: Total number of WD, number of WD matching with exceedance days and sensitivity
Fig. 3: 1st and 3rd quartiles and median values of Tamburi PM10 distributions obtained from WD and nWD classes for each selected criterion.
Fig. 3.1: 1st and 3rd quartiles and median values of Talsano PM10 distributions obtained from WD and nWD classes for each criterion.
W D
n WD
W D n WD
However a small difference in the quantile values is observed in the WD class but in this case the higher value is relative to the lower wind speed criteria (7-3 and 7-4) in line with expectations.
PM10 and BaP trends
Fig. 4 shows PM10 and B(a)P annual mean trend from 2009 to 2014 in three sites: industrial (Tamburi), traffic (Alto Adige), and background (Talsano). A reduction of PM10 concentration is observed, mostly in Tamburi industrial site, where a well-rendered decrease of B(a)P is observed from 2011: in fact, for the first time since monitoring start, in 2012 annual mean was lower than the 1 ng/m3 objective value. It is to highlight that in 2012 ILVA shut down six cove oven (with a consequent emission reduction of B(a)P) and,
Fig. 4: PM10 and benzo(a)pyrene annual mean trend from 2009 to 2014.
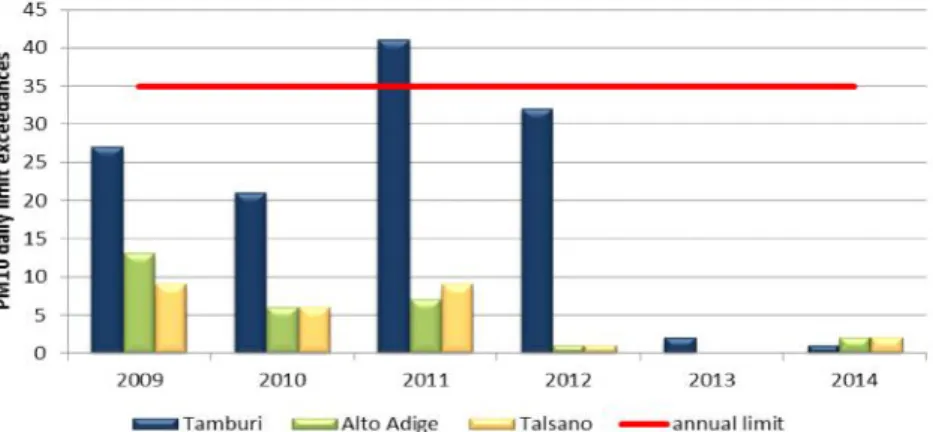
Fig. 5: PM10 daily exceedances from 2009 to 2014
at the same time, moved away from its fence and lowered mineral stockyard
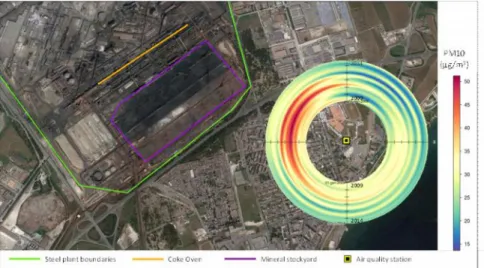
Fig. 5 shows PM10 daily exceedances from 2009 to 2014 in the three sites. In this paper exceedances due to natural causes have not been considered, according to European Directive 2008/50/EC that allows State Members to discount limit exceedances due to natural phenomena such as transport of natural particles from arid regions (Sahara desert). The results highlight an evident reduction of the number of exceedances in industrial site since 2013. In another monitoring site located at Tamburi a bihourly PM10 analyzer is installed. The station, named Archimede, is located to the south-east of the industrial area. In order to confirm the reduction of PM10 levels in that area, a polar annulus plot (Fig. 6) elaborated by Open Air
Global J. Environ. Sci. Manage., 2(2): 95-104, Spring 2016
Package (Carslaw and Ropkins, 2013) was performed from 2009 to 2014. Up to November 2012 data show high PM10 concentrations from N-NW directions,
when the station is downwind of the industrial area. After then, a concentration decrease is observed and it is more difficult to identify a prevalent PM10 source. Fig.6: Archimede Station: PM10 Polar Annulus Plot
Fig. 7a: WD and nWD PM10 concentrations in Tamburi site
Windy days before and after the Regional Air Quality Recovery Plan
A study on levels of PM10 registered during WD was performed in order to evaluate the Regional Plan efficacy during critical episodes of pollution.Fig. 7(a/b) shows the concentration of particulate during WD vs nWD in Tamburi and Talsano background site. Since 2011 there is a decreasing trend in PM10 concentration in both sites, due to a general improvement of quality air in Taranto area. As seen in section 2, in Talsano WD/ PM10 concentrations are lower than in the remaining days because of wind diluent effect, but WD/nWD trend shows to be constant, not being directly influenced by emission sources. On the contrary, since Regional Air Quality Plan enaction (December 2012), the decrease in PM10 concentration in the WD-class in Tamburi is more dramatic. Here the difference between WD and nWD values reduces from 32% in 2012 to 17% in 2014. This behaviour was expected for coarse particulate: the 10% reduction of PM10 emissions by diffuse sources set by
Regional Plan has a strong influence on the handling activities of mineral stockyard that is stored in the part of ILVA plant closer to Tamburi. In addition, the drop in production of the steel industry since 2012 and the improved management of the mineral stockyard could have contributed to PM10 concentration decrease.
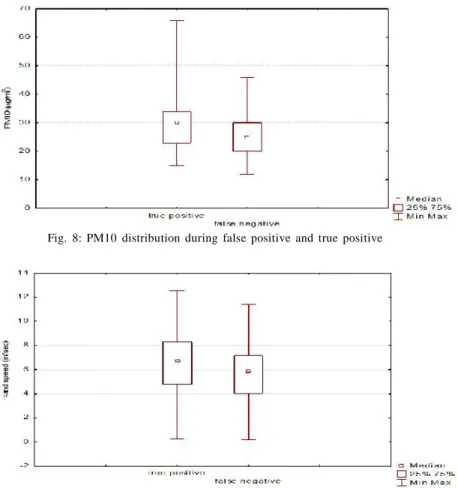
PM10 concentration during WD versus “false negative” days were compared at the aim to verify the effects of the regional plan. In fact, as already mentioned in section 1, the reporting of WD is based on a forecast model and this will have a certain sensitivity to identify the true WD (true positive) but also a not null specificity. The occurred WD (verified ex-post by observed meteorological data) not identified by the forecast model are defined as “false negative” and may help to verify the effectiveness of the plan: in fact during this days no emission mitigation was undertaken.Fig. 8 shows boxplots of PM10 concentration during false negative and true
Fig. 8: PM10 distribution during false positive and true positive
Global J. Environ. Sci. Manage., 2(2): 95-104, Spring 2016
positive events at Tamburi site. False negative events don’t show a significative influence on PM concentration, as unexpected. In these days, PM10 values are comparable and sometimes lower than windy days’ levels. It is reasonable that the new scenario (with a relevant reduction emissions form Ilva plant) has strongly reduced the pollutants contribution from industrial area, contributing to the PM10 levels decrease, also in false negative events. Moreover, most of these false negative events coincide with weather conditions less extreme than those that occur during true positives. This is connected to the inability of the model to identify borderline cases, as reported inFig. 9 (boxplots of wind speed during false negative and true positive events).
CONCLUSION
The study has investigated the efficiency of an air quality plan. The plan was enacted in December 2012 because of several PM10 and Benzo(a)pyrene limit exceed ances reco rd ed in Tamb uri, a d ensely populated neighborhood close to the industrial area of Taranto, a city in southern Italy. The Plan constrains industrial plants to reduce by 10% B(a)P and PM10 emissions by diffuse and point sources during windy days’ (days characterized by at least 3 consecutive hours of wind with an associated speed higher than 7 m/s) when the town is downwind respect to the industrial area. In fact in previous years it was observed that during such days in Tamburi industrial monitoring site PM10 values were higher than in the other sites, with frequent limit exceedances. A statistical complete analysis of several criteria to optimize windy days’ threshold was performed for Tamburi site. Pollution levels have a drastic reduction since 20 12 . In d etails, the numb er o f PM10 exceedances and BaP concentration decreases in industrial site after the plan enaction. Pollutant concentrations were analyzed in relation to wind speed and direction. Talsano background site showed the expected behavior, with of PM10 decrease in the wind day’s respect to no windy days due to the dilution effect of strong winds. Tamburi industrial site showed an opposite behavior and was constantly characterized by higher PM10 concentrations with respect to Talsano. This effect, due to the extreme proximity of emission source, is strengthened by windy days’ conditions. This effect is due both to the Regional Air Quality Plan than to the reduction of
steel production since 2012, the importance of which is stated by the negligible influence of false negative events on PM concentration.
CONFLICT OF INTEREST
The authors declare that there are no conflicts of interest regarding the publication of this manuscript. REFERENCES
Amodio, M.; Andriani, E.; de Gennaro, G.; Di Gilio, A.; Ielpo, P.; Placentino, C.M.; Tutino, M., (2013). How a steel plant affects air quality of a nearby urban area: A study on metals and PAH concentrations. Aerosol Air Qual. Res., 13: 497– 508 (10 pages).
Amodio, M.; Caselli,M.; Daresta, B.E.; de Gennaro, G.; Ielpo, P.; Placentino C.M.;Tutino, M., (2008). Air quality impact for industrial area of Taranto city (south Italy): a multivari-ate statistical analysis application. Chem. Eng. T., 16: 193-200 (8 pages).
Arpa, P., (2010). Regional atmospheric emissions inventory. Available at http://www.inemar.arpa.puglia.it/
Brunekreef, B; Holgate, S.T., (2002). Air pollution and health. Lancet, 360: 1233-1242 (10 pages).
Carslaw, C.; Ropkins, K., (2013). Open air: Open source tools for the analysis of air pollution data. R package version 3.1.2. Escudero, M.; Xerol, X.; Pey, J.; Alastuey, A.; Perez, N.; Ferreira, F.; Alonso, S.; Rodriguez, S.; Cuevas, E., (2007). A methodology for the quantification of the net African dust load in air quality monitoring networks. Atmos. Environ., 41: 5516–5524 (9 pages).
Fedele, F.; Menegotto, M.; Trizio, L.; Angiuli, L.; Guarnieri Calò Carducci, A.; Bellotti, R.; Giua, R.; Assennato, G., (2014). Meteorological effects on Pm10 concentrations in a urban industrial site: a statistical analysis. Conference proceedings: 1st International Conference on Atmospheric Dust 2014. Ferin, J.; Oberdoster, G.; Penney, D.P., (1992). Pulmonary
retention of ultrafine and fine particles in rats. Am. J. Respir. Cell Mol. Biol., 6: 535-542 (8 pages).
Fisher, R.; Hein, M. (2001). Environmental control of European coking plants at the beginning of the 21st century. Coke Making Int., 1: 68-73 (6 pages).
Fisher, R., (2001) Sources, measurement and control of fugitive emissions in the coke making process. In the coke oven manager’s year book, Mexbomugh, UK, 87–105 (18 pages). Haddow, A.; Scott, C.M.; Scott, J.D., (1937). The Influence of certain carcinogenic and other hydrocarbons on body growth in the rat. Proceedings of the Royal Society of London B Biological Science 122: 477.
IARC, (2010). International Agency for Research on Cancer-review of human carcinogens. Monographs 1-100, Lyons, France.
Khalili, N.R.; Scheff, P.A.; Holsen, T.M., (1995). PAH source fingerprints for coke ovens, diesel and gasoline engines, highway tunnels, and wood combustion emissions. Atmos. Environ., 29: 533-542 (10 pages).
Perez, L.; Tobias, A., Kunzli, N.; Pey, J.; Querol, X.; Alastue,y A.; Viana, M.; Valero, N.; Gonzaìlez-Cabre, M.; Sunyer, J. (2008). Coarse particles from Saharan dust and daily mortality. Epidemiol., 19(6): 800–807 (7 pages).
Perrone, M.G.; Gualtieri, M.; Ferrero, L.; Porto, C.L.; Udisti, R.; Bolzacchini, E.; Camatini, M., (2010). Seasonal variations in chemical composition and in vitro biological effects in fine PM from Milan. Chemosphere, 78: 1368 – 1377 (10 pages).
Polichetti, G.; Cocco, S.; Spinali, A.; Trimarco, V.; Nunziata, A., (2009). Effects of particulate matter (PM10, PM2.5 and PM1) on the cardiovascular system. Toxicol., 261: 1-8 (8 pages). Regione, P., (2012). Piano contenente le prime misure di
intervento per il risanamento della qualità dell’aria nel quartiere Tamburi (Ta) per gli inquinanti PM10 e Benzo(a)Pirene ai sensi del D.lgs.155/2010 art. 9 comma 1 e comma 2. Sai, J.H.; Lin, K.H.; Chen, C.Y.; Ding, J.Y.; Choa, C.G.;Chiang
H.L., (2007). Chemical Constituents in Particulate Emissions
from an Integrated Iron and Steel Facility. J Hazard Mater, 147: 111–119 (9 pages).
Seaton, A.; MacNee, W.; Donaldson, K.; Godden D., (1995). Particulate air pollution and acute health effects. Lancet, 345: 176-178 (3 pages).
US EPA, (2001). Emissions factor documentation for ap-42, section 12-2: Coke production. United States Environmental Protection Agency (US EPA), 7D-1554-NALX.
Utell, M.J.; Frampton, M.W., (2000). Acute health effects of ambient air pollution: the ultrafine particle hypothesis. J. Aerosol Med., 13: 355-359 (5 pages).
Yang, H.H.; Lai, S.O.; Hsieh, L.T.; Hsueh, H.J.; Chi T.W., (200 2). Profiles of PAH mi ssi on from steel and iron industries. Chemosphere, 48: 1061–1074 (14 pages).
DOI:10.7508/gjesm.2016.02.001
URL:http://gjesm.net/article_15729_1931.html
How to cite this article:
Trizio, L.; Angiuli, L.; Menegotto, M.; Fedele, F.; Giua, R.; Mazzone, F.; Carducci, A.G.C.; Bellotti, R.; Assennato, G., (2016). Effect of the Apulia air quality plan on PM10 and Benzo(a)pyrene exceedances. Global J. Environ. Sci. Manage., 2(2): 95-104.
AUTHOR (S) BIOSKETCHES
Trizio, L., Ph.D., Assistant Professor, Arpa Puglia, C.so Trieste 27 IT-70126 Bari, Italy. Email:[email protected] Angiuli, L., Ph.D., Assistant Professor, Arpa Puglia, C.so Trieste 27 IT-70126 Bari, Italy. Email:[email protected] Menegotto, M.; Ph.D., Assistant Professor, Arpa Puglia, C.so Trieste 27 IT-70126 Bari, Italy. Email:[email protected] Fedele, F., Ph.D., Ph.D., Assistant Professor, Arpa Puglia, C.so Trieste 27 IT-70126 Bari, Italy. Email:[email protected] Giua, R., Ph.D., Assistant Professor, Arpa Puglia, C.so Trieste 27 IT-70126 Bari, Italy. Email:[email protected] Mazzone, F., Ph.D., Assistant Professor, Arpa Puglia, C.so Trieste 27 IT-70126 Bari, Italy. Email:[email protected] Carducci, A.G.C., Ph.D., Assistant Professor, Arpa Puglia, C.so Trieste 27 IT-70126 Bari, Italy. Email:[email protected] Bellotti, R., Ph.D., Professor, Dipartimento di Fisica, Università degli Studi di Bari, via Orabona 4- IT-70125 Bari, Italy and Istituto