Inferring Temporal Behaviours Through Kernel Tracing
Paolo Rallo, Nicola Manica, Luca Abeni
University of Trento
Trento - Italy
[email protected], [email protected],
[email protected]
Inferring Temporal Behaviours Through Kernel Tracing
author Paolo Rallo, Nicola Manica, Luca Abeni
DISI – University of Trento, Italy
[email protected], [email protected], [email protected]
March 4, 2010
Abstract
In order to provide reliable system support for real-time applications, it is often important to be able to collect statistics about the tasks temporal behaviours (in terms of execution times and inter-arrival times). Such statistics can, for example, be used to provide a-priori schedulability guarantees, or to perform some kind of on-line adaptation of the scheduling parameters (adaptive scheduling, or feedback scheduling). This work in progress shows how the Linux kernel allows to collect such statistics by using an internal function tracer called Ftrace. Based on this feature, tools can be developed to evaluate the real-time performance of a system or an application, to debug real-time applications, and/or to infer the temporal properties (for example, periodicity) of tasks running in the system.
1
Introduction
Real-time systems are designed to respect the temporal constraints (generally expressed as deadlines) of the real-time tasks running in the system. This can be done in different ways, for example by providing a-priori schedulability guarantees (based on mathematical proofs that the temporal constraints will be respected) or by performing some on-line dynamic adaptation of the scheduling parameters. While the first approach requires an a-priori knowledge about important tasks parameters (execution times, inter-arrival times, de-pendencies between tasks, etc...) the second approach generally requires run-time monitoring of the tasks parameters.
This work in progress paper shows how to use a tracing facility provided by the Linux kernel (called Ftrace - function tracer) to collect some statistics about the tasks execution, and how to use such data as an input for the schedulability analysis, or to infer information about the tasks temporal behaviour (for example, about task periodicity). The collected information can also be used for evaluating the performance of a real-time system (in terms of kernel latencies) or of a scheduling algorithm (in terms of tasks’ response times), or to generate graphs describing the tasks’ schedule.
The presented tools and methodology can be used either for collecting data to be analysed off-line (for example, for obtaining data to be used as input for an a-priori schedulability analysis), or for on-line adaptation (for example, for observing the scheduler behaviour in a feedback-scheduling system). These two use-cases will be described in this paper as off-line mode and on-line mode.
When working in off-line mode, the real-time tasks are run during the system design phase to profile them by dumping the scheduler’s activities through the tracer, and extracting information about the execution and arrival times. Such information are saved and used in a second time by some analysis tools that allow to properly design the system, using the correct scheduling algorithm and properly dimensioning the scheduling parameters [BMR93].
2
Tracing Linux Tasks
The key first step for collecting the needed timing information is to obtain a trace of the kernel activities, indicating when the various tasks are activated, deactivated, and scheduled. Since there are various existing tracers (allowing to export the information mentioned above to user space programs) for the Linux kernel, the one used in this paper has been selected according to the following properties:
• correctness: no kernel events should be lost;
• integration: if possible the tool should be directly integrated in the kernel (so that no modifications to the kernel are needed) and must be quite lightweight (to reduce the tracing overhead);
• tracer output: the generated traces should be easy to parse;
• streaming support: the tools must allow the time analysis in real time; • usability: the tracer should be easy to setup, to configure and to use.
The tool which best matches all of our requirements is Ftrace [Ros09], an internal tracer of the Linux kernel introduced in the mainline from version 2.6.28. It uses the debugfs filesystem to hold the control files as well as the output files. Different events can be traced by Ftrace, in particular we are interested in three kind of events: wake up, sleep, and context switch. So our choice in Ftrace is the sched switch tracer.
3
Parsing the Kernel Traces
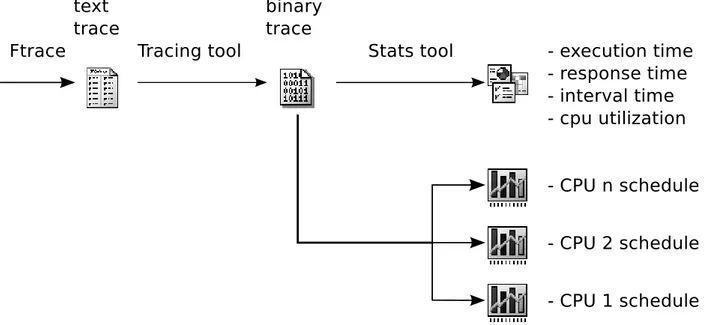
The kernel traces produced by Ftrace can be used to extract all the needed information about the tasks’ timings, so that their temporal behaviour can be inferred. In the proposed approach, this is done through a set of tools organised in a pipeline, as shown in Figure 1.
The first stage of the pipeline (the Trace Parser) transforms the textual traces exported by Ftrace in an internal format, which is used by the other tools in the pipeline. This step is needed because Ftrace exports traces in the form of text files, whose format can change from kernel version to kernel version, containing redundant and unneeded information (this happens because the Ftrace format has been designed to be easily readable by humans). Hence, the textual traces produced by Ftrace are parsed and and transformed in a more compact, kernel-independent, binary format which is used as input by the next stages of the pipeline. Such stages are composed by second set of tools that can:
• parse the internal format to gather statistics about execution times, inter-arrival times, response times, and system utilisation;
• generate a chart displaying the CPU scheduling;
• infer some of the tasks temporal properties, identifying (for example) periodic tasks.
The various tools composing the pipeline communicate through standard Unix FIFOs (named pipes) and can be combined in different ways, to collect different kinds of information. For example, when working in on-line mode, a tool which periodically displays important statistics for selected tasks (similarly to the standard “top” program) can be inserted in the pipeline. When working in off-line mode, the collected values are generally saved to files to be processed in a second time, but they can also be summarised by some statistics that are saved instead of the raw sequence of values, to save some disk space.
Since connecting the different tools in a correctly working pipeline (creating all the needed FIFOs, etc...) can sometimes be difficult, some helper scripts have been developed.
Figure 1: General architecture of the tool
4
Analysing the Output
The final stages of the pipeline shown in Figure 1 generate some useful output from the binary trace produced by the first stage. For example, one of the output modules can transform the trace in an xfig file representing the schedule (this can be useful for visually analysing the scheduler’s behaviour, and can be easily imported in various kinds of documents). Another output module can generate a table of values containing the average, standard deviation, minimum, and maximum values for standard metrics such as the execution time, inter-arrival time, response time, etc... Different output modules have been developed for generating various kinds of statistics, and the Probability Mass Function (PMF) or Cumulative Distribution Function (CDF) of some observed values.
Finally, an output module that can be useful in on-line mode periodically publish some statistics through a Unix socket, and can be used as a server by programs performing dynamic adaptation of the QoS or of the scheduling parameters. Other output modules to be used on on-line mode allow to dynamically identify tasks with a periodic behaviour, or to present some statistics on the screen, similarly to the top program (as previously explained).
5
Examples
The first possible usage of the proposed tools is to visually analyse the scheduler’s behaviour, to check its correctness or to understand the reason for unexpected results. For example, Figure 2 represent a graph of the schedule produced by the proposed tools when running three periodic tasks (with periods 6ms, 3ms, and 8ms) on a dual processor system. Looking at the figure, it is possible to notice that the scheduler is migrating the tasks way too often.
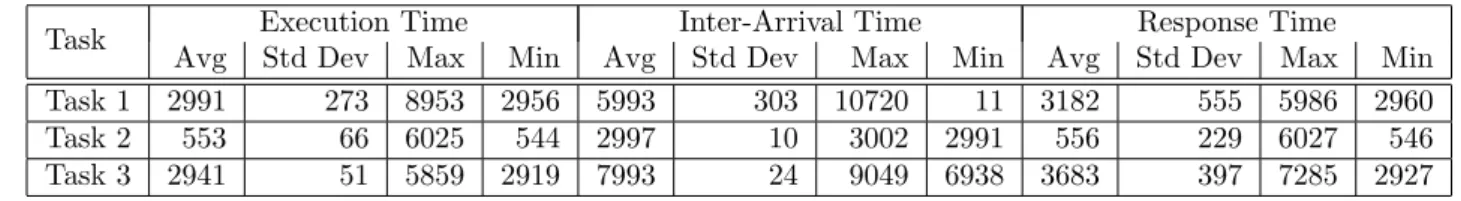
If, instead, statistics modules are used in the last stage of the pipeline, it is possible to collect some information for performance evaluation. For example, some statistics about the three periodic tasks shown in Figure 2 have been collected, and are shown in Table 1.
CPU 1 idle*0 250 500 750 1000 1250 1500 1750 2000 2250 2500 2750 3000 3250 3500 3750 4000 4250 4500 4750 5000 5250 5500 5750 6000 6250 6500 6750 7000 7250 7500 7750 8000 8250 8500 8750 9000 9250 9500 9750 10000 10250 10500 10750 11000 11250 11500 11750 12000 12250 12500 12750 13000 13250 13500 13750 14000 14250 14500 14750 15000 15250 15500 15750 16000 16250 16500 16750 17000 Task 1 Task 2 Task 3 CPU 0 idle*0 Task 2
Figure 2: The Linux scheduler serving 3 periodic tasks.
Task Execution Time Inter-Arrival Time Response Time
Avg Std Dev Max Min Avg Std Dev Max Min Avg Std Dev Max Min
Task 1 2991 273 8953 2956 5993 303 10720 11 3182 555 5986 2960
Task 2 553 66 6025 544 2997 10 3002 2991 556 229 6027 546
Task 3 2941 51 5859 2919 7993 24 9049 6938 3683 397 7285 2927
Table 1: Random statistics. Times are in µs. the latest stage of the processing pipeline.
Test Average Std Dev Max Min
T1 1190 29 1569 1040
T5 5198 22 5278 5058
T10 10195 22 10277 10062
T50 50207 27 50298 50081
T100 100207 25 100290 100093
Table 2: Inter-Packet times as measured in the sender. Times are in µs.
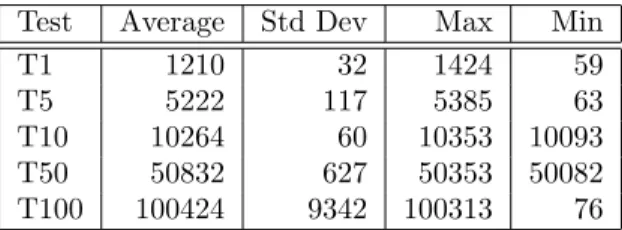
Another possible use case is for collecting timing information about the IRQ threads in Preempt-RT [Ros07], that can be used to properly schedule such threads [MAP10]. The reliability of these information has been tested by sending a stream of periodic UDP packets between two computers, and measuring the inter-packet times in the sender (Table 2) and in the receiver (Table 4). Then, the proposed tools have been used to extract the inter-arrival times of the network IRQ thread, summarised in Table 3. By comparing Table 4 and Table 3, it is possible to verify the correctness of the collected data.
Some information about the IRQ thread execution times (needed to perform some kind of performance analysis of the system) are shown in Table 5.
In the last set of tests, the netperf1tool has been used to produce a huge UDP traffic, and the proposed
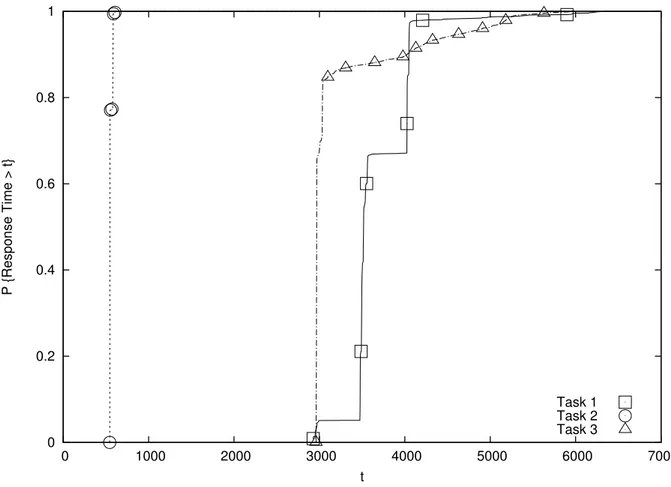
0 0.2 0.4 0.6 0.8 1 0 1000 2000 3000 4000 5000 6000 7000 P {Response Time > t} t Task 1 Task 2 Task 3
Figure 3: CDFs of the response times for 3 periodic tasks.
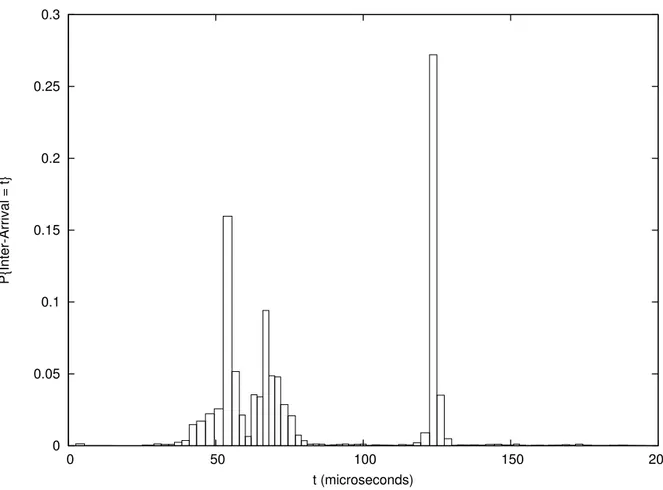
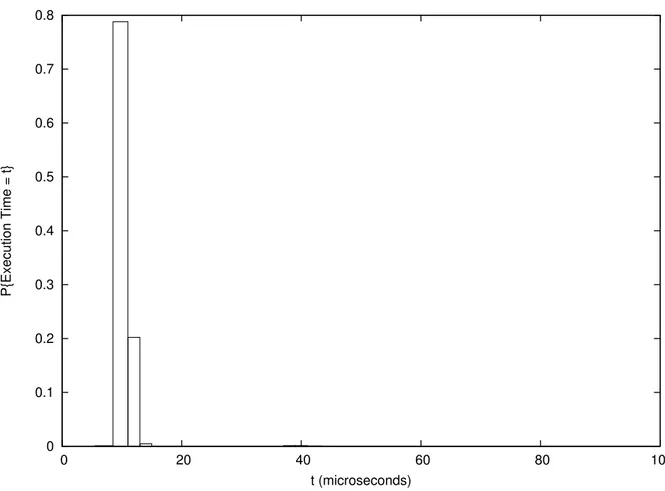
tools have been used to measure the execution times and the inter-arrival times for the network IRQ thread. The Probability Mass Functions for such times are presented in Figures 5 and 4.
6
Future Work
This work in progress describes a set of tools for extracting temporal information from kernel traces. The tools are still under active development: while the first stage of the processing pipeline is reasonably stable, the statistical modules (latest stages of the pipeline) are not complete yet. This paper presented some preliminary results, and more work is needed for classifying tasks according to their periodicity, and for extracting more complex statistics.
References
[BMR93] Sanjoy K. Baruah, Aloysius K. Mok, and Louis E. Rosier. Preemptively scheduling hard-real-time
sporadic tasks on one processor. pages 182–190, 1993.
Test Average Std Dev Max Min T1 1210 32 1424 59 T5 5222 117 5385 63 T10 10264 60 10353 10093 T50 50832 627 50353 50082 T100 100424 9342 100313 76
Table 3: Inter-Arrival times for the network IRQ thread. Times are in µs.
Test Average Std Dev Max Min
T1 1207 1011 14336 0
T5 5212 1019 6144 4096
T10 10210 271 12288 8192
T50 50229 1023 51200 49152
T100 100204 530 100352 98304
Table 4: Inter-Packet times as measured in the receiver. Times are in µs.
[MAP10] Nicola Manica, Luca Abeni, and Luigi Palopoli. Reservation-based interrupt scheduling. In
Proceedings of the 16th IEEE Real-Time and Embedded Technology and Applications Symposium, (RTAS 2010), Stockholm, Sweden, April 2010.
[Ros07] Steven Rostedt. Internals of the rt patch. In Proceedings of the Linux Symposium, Ottawa,
Canada, June 2007.
[Ros09] Steven Rostedt. Finding origins of latencies using ftrace. In Proceedings of the Eleventh Real-Time
Test Average Std Dev Max Min T1 15 5 63 9 T5 19 1 68 18 T10 14 1 29 13 T50 16 2 28 15 T100 21 3 23 12
Table 5: Statistics about the execution times of the IRQ thread. Times are in µs.
0 0.05 0.1 0.15 0.2 0.25 0.3 0 50 100 150 200 P{Inter-Arrival = t} t (microseconds)
0 0.1 0.2 0.3 0.4 0.5 0.6 0.7 0.8 0 20 40 60 80 100 P{Execution Time = t} t (microseconds)