Vol. 16, 2016, pp. 85-115 ISSN: 2340-5058
Submitted August 2016
DOI: 10.4192/1577-8517-v16_4 Accepted October 2016
Financial Reporting in XBRL: First Evidence on
Financial Statement Notes of Italian Unlisted
Companies
Andrea Fradeani. University of Macerata. Italy a.fradeani@unimc.it Davide Panizzolo. University of Trento. Italy davide.panizzolo@unitn.it Eldi Metushi. Canadian Institute of Technology. Albania eldi.metushi@cit.edu.al
Abstract. The new taxonomy 2014-11-17 mandates Italian unlisted companies to codify in XBRL
also the notes to the financial statements. Building on previous literature, the aim of this study is to analyze the impact of mandatory XBRL extension to the financial statements notes on financial reporting quality of the Italian unlisted companies. We focus our analysis on the taxonomy usage and the customizations made by the filers. Our data represents the very first sample of Italian financial statements filed in fully XBRL format. Despite the significant changes affecting the process of financial statement preparation, we find that Italian unlisted companies have accepted and acknowledged the potential benefits and limits of the new taxonomy. When dividing the notes section between textual blocks and tables, we find a clear preference for the filers to use textual blocks for both, standard and abbreviated financial statements. Overall, we find that filers of both financial statement types use extensively the customizations offered by the taxonomy. Moreover, for the filers of abbreviated financial statements, we show that they tend to use not only more table customizations but also tables that are proper for the standard financial statements, thus offering higher voluntary disclosure.
1. INTRODUCTION
The financial statements of Italian unlisted companies1, starting from those submitted as of 31 December 2014 and approved on or after the 3rd march 2015, are deposited in the Business register2 in fully XBRL format: this means that currently, it is mandatory for the Italian unlisted companies to submit in XBRL not only the quantitative statements3 (in this study we will refer to them as face statements), such as the Balance sheet and Income statement, but also the Notes to the financial statements.
Therefore, approximately 1 million companies had to radically change their way of preparing the financial statements: in fact, the structure and the content of the new financial statements should comply, excluding only the cases of “double filing”4
, with the new and non-extensible XBRL taxonomy 2014-11-17 approved recently by the Italian Jurisdiction.
The advent of XBRL does not only represent a new technology but also, depending on the reliability and integrity of the taxonomy, an important tool to improve the quality of financial statements. Thus, the economic and financial information is "filtered" not only by the accounting principles but also by the “dictionary” used for its digital encoding.
According to Hodge et al., (2004) XBRL as a search facilitating tool helps external users in better acquiring information from firms’ financial statement. In
1 The mandatory XBRL adoption concerns all the financial statements prepared in
accordance with the provisions of the Civil Code (derived from the IV Directive EEC), and concerns almost 1,000,000 companies. IFRS adopters are excluded from this provision because the IFRS Taxonomy is not yet legally recognized in Italy.
2 The Business Register is a public database accessible via web
(http://www.registroimprese.it) that collects, under legal requirements, not only the financial statements of all the Italian companies, consolidated and non-consolidated, but also a wide range of information regarding their governance.
3 The face statements were already subject to XBRL filing format starting from reporting
periods ending on or after 16 February 2009. This adoption, however, did not determine big issues given its rigid structure and the analytical content of the schemes mandated by the Italian Civil Code.
4 In Italy, companies have the right, whenever the official taxonomy is unable to make
comprehensible and give a true and fair view of the business situation, to support the financial statements in XBRL also with a PDF/A file, which is created using the traditional methods of preparing the financial statements and has the same legal value as the XBRL file.
addition, the authors suggest that XBRL users make also different investment decisions as compared to non-XBRL users. With regard to the notes, Arnold et al., (2012) point out that tagging the narrative parts of the financial statements has important implications to investors decisions and their search behavior.
Filing year Financial
reports filed % XBRL % double filing % instances with errors 2010 959.950 97,9% 27,0% 2,00% 2011 1.007.470 97,1% 12,5% 0,30% 2012 1.005.650 97,1% 9,9% 0,10% 2013 998.571 99,0% 6,8% 0,07% 2014 982.011 99,2% 6,0% 0,09% 2015 979.297 98,7% 5,4% 0,06% Source: XBRL Italy.
Table1. XBRL implementation in Italy
In table 1 we briefly report the degree of XBRL implementation in Italy during the years. As we may observe from the table, interesting to point out is not the high degree of XBRL adoption by Italian unlisted companies during the years, but the fact that the percentage of financial statements in double filing has been decreasing during the years. In fact, in 2015 only 5,4% of the companies have chosen the double filing method suggesting that only a small number of companies still consider the taxonomy as inadequate in fulfilling their disclosure purposes. In addition, this result is more surprising when considering that 2015 was the first year of adoption of the XBRL extension to the financial statement notes, which represents a more particular and complex activity than that of the face statements also due to the taxonomy limits (covering only the mandatory information required by the Italian Civil Code). Based on this, one would expect a two-digit number of the double filing instances for 2015.
This study constitutes a first analysis on the impact of the new taxonomy 2014-11-17 and in particular the extension of the XBRL to the financial statement notes, on financial reporting quality of the Italian unlisted companies. Because the mandatory financial statement notes in Italy were implemented in 2015, it is of relevant importance to analyze the effects and the quality of the new financial statements in XBRL on a firm level. Tagging the notes to the financial statements is particularly important because of the valuable information contained in the
notes for the investors and the normal functioning of the capital markets (Debreceny et al., 2011). Additionally, it represents a more complicated and challenging activity for the XBRL filers as compared to the other reports of financial statements (Debreceny et al., 2005).
We will focus our analysis, for both types of financial statements, standard and abbreviated, on the level of taxonomy 2014-11-17 usage (for a sample of 600.000 financial statements) and the degree of customizations made by the filers (we will use a sample of 10.000 financial statements) as a proxy of the voluntary disclosure, in order to not only identify the common traits but also to identify the taxonomy’s limits. Our findings suggest a high filing usage for both financial statements suggesting that filers have absorbed the difficulties related with the adoption of the new taxonomy. Analyzing the financial statement notes’ filing percentage divided by sections we report a high tendency of the filers for using textual blocks as compared to the tables, suggesting a potential inadequacy of the tables. We also find a high percentage of table customizations for both financial statement types. Finally, our findings show that filers of the abbreviated financial statements not only use more table customizations but also tend to increase their level of voluntary disclosure by adopting tables that are proper of the standard financial statements.
To the best of our knowledge this is the first study analyzing, on a company level, the effects of the mandatory XBRL extensions to the financial statement notes on the quality and completeness of the financial statements. As mentioned above, the data gathered represents the very first sample of Italian financial statements filed in fully XBRL format. Our findings could be of interest for researchers focusing their attention on the quality and information provided by the financial statements in XBRL of unlisted companies under the new taxonomy 2014-11-17. Because our sample comprises also SME’s, these findings could be useful for researchers focusing their attention on the benefits and opportunities of improving the financial information for SMEs.
This article is organized as follows. After a thorough review of the literature in section two we will focus our attention on the analysis, considering also the characteristics and limits of the taxonomy 2014-11-17 in section three, of the
impact of mandatory XBRL extensions on a sample of standard and abbreviated financial statements. Thus, in section four we will show the results on the taxonomy usage and in section five we show descriptive statistics on the taxonomy customizations. In the last section, the conclusions and the future research directions will follow.
2. LITERATURE REVIEW
XBRL is a business reporting language created with the purpose of minimizing the difficulties and making easier the distribution and exchange of financial information. In addition, XBRL presents a low cost method for financial reporting which helps increase transparency and compliance while potentially decreasing the firm’s cost of capital (Pinsker and Li, 2008). As predicted several years ago, it is now used from various groups of stakeholders to easily operate and automatically analyze the disseminated financial information (Bonsón, 2001; Debreceny and Gray, 2001). According to Perdana et al., (2014) in the recent years there has been an increasing attention among scholars on XBRL topics. The authors suggest that the earlier studies on XBRL were mainly theoretical focusing on the abilities of XBRL to facilitate financial data and information exchange, whereas the most recent studies are mainly empirical focusing on the analysis of the real effects of XBRL implementation.
Empirical research on XBRL is particularly focused on US listed companies. Hence, a considerable number of studies have analyzed the characteristics of early and voluntary XBRL adopters suggesting differences between voluntary and non-voluntary adopters (Premuroso and Bhattacharya, 2008; Callaghan and Nehmer, 2009; Ragothaman, 2012; Boritz and Timoshenko, 2015). According to these studies, variables such as liquidity, firm size and leverage provide a significant explanation of why some companies choose to voluntary adopt XBRL. Boritz and Timoshenko (2015) point out that high voluntary disclosure propensity, stronger corporate governance and better profitability are the main characteristics of voluntary XBRL adopters. Furthermore, corporate governance is significantly related to the firm’s decision to be an early adopter (Premuroso and Bhattacharya, 2008; Ragothaman, 2012). However, contrary to the previous studies, Callaghan and Nehmer (2009) find that early adopters present lower governance ratings than non-adopters. Asking a panel of XBRL experts about the motives that could have
led companies to voluntary adopt XBRL, Bonsón et al., (2009) concluded that reasons such as acquiring deeper knowledge about XBRL, promoting company image as a pioneer in technology and also improving company’s reputation in the capital market were important factors determining the voluntary adoption of XBRL. Kaya (2014) for the XBRL voluntary adopters listed in US analyzed the relationship between firm characteristics and the extent of voluntary disclosure in XBRL. The author constructed a disclosure index to analyze the level of financial and non-financial information disclosed by the voluntary adopters. Consistent with previous studies mentioned above, firm size and firm’s level of innovativeness were found to have a significant impact on the overall level of disclosure in XBRL.
Recently, XBRL impact on information efficiency and asymmetry has received particular attention among scholars. Thus, XBRL is found to improve information efficiency in the capital markets (Efendi et al., 2014). Furthermore, XBRL filings provide greater information content as measured by the investors responsiveness to XBRL reports (Efendi et al., 2010). Nevertheless, studies have been controversial regarding XBRL role on information asymmetry. While Yoon et al., (2011) for a sample of Korean listed companies find a significant and negative association between XBRL adoption and information asymmetry, Blankespoor et al., (2014) when analyzing a sample of US listed companies, find that adverse selection concerns have increased for XBRL adopters during the initial year of adoption. Yet, in contrast with Blankespoor et al., (2014) findings, Kim et al., (2012) suggest that XBRL disclosures increase transparency and thus reduce information risk and asymmetry in the US listed companies. Additionally, controversial results are also found when measuring the impact of XBRL adoption on analysts’ forecast accuracy. In US, Cho et al., (2014) find that smaller analysts and institutions gain greater benefits from XBRL reports as compared to their large counterparts but on the other side, for a sample of Chinese listed firms Liu et al., (2014) show that the analysts forecast accuracy decreased during the early XBRL adoption period.
Of particular interest is also the research analyzing XBRL taxonomy and its extensions. Scholars suggest that XBRL filings should be object of quality control and assurance to certify the reliability of documents (Boritz and No, 2008;
Plumlee and Plumlee, 2008). Moreover, XBRL filings and the taxonomy extensions used by the filers present issues that could negatively impact the quality of information provided and the level of comparability among XBRL filings (Bartley et al., 2010; Debreceny et al., 2011). However, as Du et al., (2013) point out, XBRL filers experience a learning curve over time which decreases the filing errors as their experience increases. In the Italian setting, many studies have focused their attention on XBRL taxonomy, mainly analyzing the degree of taxonomy fit between XBRL taxonomies and actual financial reporting practices (Valentinetti and Rea, 2011, 2012; Fradeani et al., 2016).
This study considers the discussions related to the financial statement notes in XBRL. With regard to the financial statements notes in XBRL scholars have pointed out the issues and difficulties associated with the process (Debreceny et al., 2011; Boritz and No, 2008; Janvrin and No, 2012). However, the studies above mentioned are focused on the US setting and consider listed companies. In addition, these studies focus their attention mostly on the extensions made by the filers (Debreceny et al., 2011), the quality of XBRL filings (Boritz and No, 2008) and on XBRL implementation issues (Janvrin and No, 2012), and consider only in part the issues related to the financial statement notes. In the Italian setting, scholars have pointed out on XBRL potentials and adoption benefits (Fradeani, 2009; Zambon, 2010), and taxonomy issues and fit (Valentinetti and Rea, 2011, 2012; Fradeani et al., 2016). In a very recent study, Avallone et al., (2016) provide field-based evidence on the potential benefits and costs arising from the mandatory adoption of notes to the financial statements of Italian unlisted companies by conducting interviews to Italian chartered accountants. Their findings suggest that prepares of financial statements point out to the increased comparability across firms as a main benefit of XBRL extension to the notes. In addition, the Italian chartered accountants signalize also issues related to the extension of XBRL to the financial statement notes such as less information disclosure, difficulties to include voluntary disclosures and relevant information such as statement of cash flows.
Our study differs from the studies mentioned above in that we provide empirical evidence on a firm level basis on the quality of financial reporting practices of Italian unlisted firms as a result of the mandatory adoption of XBRL extensions to
the financial statement notes. To our best knowledge, there are no studies examining on a firm level the potential benefits and issues related to the XBRL adoption to the notes of the financial statements. Moreover, the data gathered represents the very first sample of financial statements submitted in fully XBRL format for the Italian unlisted companies.
3. TAXONOMY CHARACTERISTICS
Before illustrating the main characteristics of the new taxonomy 2014-11-17 with a particular focus on the notes to the financial statements, important to be mentioned is the fact that the taxonomy was constructed by XBRL Italy based on two fundamental assumptions: on one side the taxonomy requires that companies disclose only the information that is explicitly required by the articles 2427 and 2427-bis of the Italian Civil Code5, and on the other side, contrary to the legal requirements in other countries (for example US requirements for the SEC deposits), the new taxonomy is not extensible by the reporting entity6.
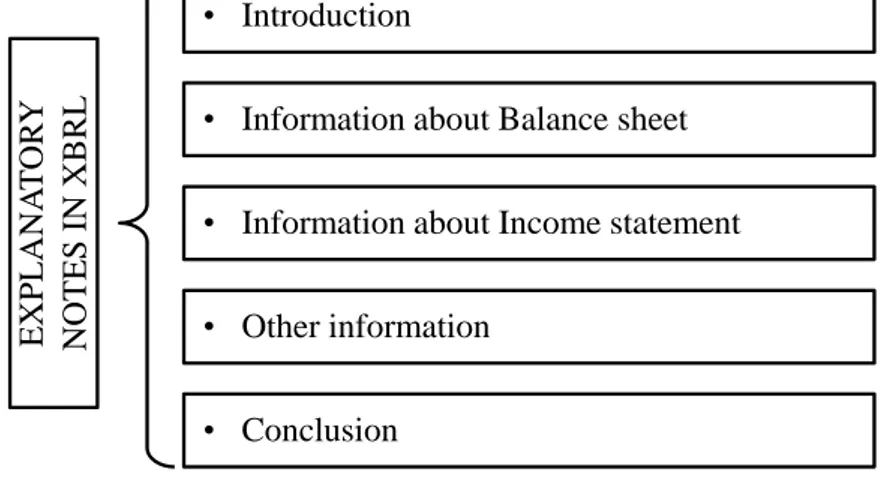
As shown in Figure 1, the notes to the financial statements in XBRL are divided into five parts. The initial part is the descriptive one and consists of a single text block that contains, among the other information, also information on the accounting standards applied. Then follows the section dedicated to the information of the balance sheet, which describes the variations and comments of the items of the balance sheet (and those of memo accounts). The third section is the income statement information section followed by the section of other information, which discloses other information required by law but not directly related to specific financial statement accounts. The final part is a text block freely fillable where the filer may provide the conclusions, but also other information such as that related to the destination of the net income.
5
This choice is justified by XBRL Italy with the need to not enforce with the new electronic format, obligations that are not required by law. Hence, the introduction of other information beyond that required by law is postponed to future optional modules (such as those dedicated to the compliance with the national accounting standards or to the existing best practices in specific sectors).
6
The taxonomy 2014-11-17 has received a favorable opinion from the Italian Accounting Association, which by letter of 23 October 2014 has not shown significant problems.
Excluding the introduction and the final part of the Notes’ sections, the rest consists of a set of textual blocks and tables7, for which as mentioned previously, the structure or the sequence are not freely adjusted by the filer. In addition, the sequence of the textual blocks and tables does not follow the numerical order of art. 2427 and 2427-bis of the Civil Code, a very common practice in the Italian setting but follows the order in which the items are indicated on the balance sheet and income statement reports. This choice, also in line with the international accounting standards, is done to accelerate the adoption process of the Directive 2013/34/EU recommendations. EXP LAN A T OR Y NO TES IN XBRL • Introduction
• Information about Balance sheet • Information about Income statement • Other information
• Conclusion
Figure 1. The structure of the financial statement notes in XBRL
The decision of not allowing taxonomy extensions but making use of a significant number of tables instead, which amount to 53 for the standard financial statements and 24 for the abbreviated ones, implies a strong standardization of the information that may increase the comparability but also, when the customizations are not adequate, may lower the information quality of the financial statements. Thus, when moving from the traditional analog version of the financial statements to those in XBRL format, the filer had to perform a complex analysis of the disclosed information and remap it in the textual blocks and tables of the taxonomy 2014-11-17. This involved disaggregating and rebuilding the financial
7
The accompanying document to the XBRL taxonomy 2014-11-17 points out that XBRL Italy, with reference to the encoding process, preferred the usage of tables to the usage of textual blocks (which in turn become a mandatory solution for information purely discursive) in virtue of the instant elaboration guaranteed by the former.
statements, which may have improved and consolidated them over the years, but on the other side, which had to rely only on the following customization options:
1. the comments and clarifications included in the textual labels: the filer had the faculty to insert, by respecting the size limit of 32 Kbytes for each tag8, free textual comments, clarifications or to replace any table of the taxonomy9;
2. creating customized tables: the non-extensibility could have been avoided, although losing the option to further elaborate the encoded data, by inserting customized tables created by the filer using xHTML encoding in the textual blocks10, to integrate or substitute the existing ones;
3. the possibility to create “mixed financial statements”: the filer of the abbreviated financial statements had the opportunity to improve the accuracy of the information by replacing, for a specific table, the usual information with information that is mandatory only for the standard financial statements11.
Nevertheless, the proper and effective use of the above customizations depends also on the simplicity, quality and functionality of the software used for preparing XBRL instances: using the xHTML code, for example, requires computer skills above those of the average filer.
8
There are more than 100 textual labels, on average two for each specific table (positioned one before and the other after each table), for a total of about 3 Mbytes space available.
9
The tables on the Changes in receivables consider, for example, only the net change during the fiscal year: when the filer retains appropriate to disclose the increases and decreases occurred, could offer more details in the textual labels that follow each statement of series.
10 With reference to the previous footnote case, the filer may delete the default tables of the
Change in receivables by simply choosing not to fill the tables – therefore, the XBRL instance will not encode them – and then insert in each of the textual blocks that follow its own customized reports in xHTML (created using the filer’s proper software or, by converting the information on the spreadsheet thanks to numerous freeware tools available on the web).
11
The filer of abbreviated financial statements may exclude, for example, the statements related to deferred tax. However the taxonomy allows, if the filer considers it useful, to use the tables of the standard financial statements: an option, which allows the filer to provide more information than the minimum required by law, and very common in practice (later in this study we will show the related results).
4. FIRST RESULTS ON THE TAXONOMY USAGE
As mentioned previously, the aim of this study is to analyze the impact of mandatory XBRL extension to the financial statements notes on financial reporting quality of the Italian unlisted companies. We focus our attention on the level of taxonomy usage and the degree of customizations made by the filers of financial statements in XBRL. These variables will also allow us to better identify the taxonomy issues and limits so to point out suggestions to the standard setters for further improvements when needed.
In this section we will focus on the analysis of the taxonomy usage while in section 5 on taxonomy customization made by the filers.
The analysis of the process of taxonomy 2014-11-17 usage is conducted by examining the entire set of XBRL instances12 in compliance with the taxonomy, deposited in the Business Register and processed as of 15 September 201513: there is a total of 649.789 financial statements, which represent 66.35% of the total of 979.297 financial statements shown in table 1. The standard financial statements amount to 56.755 (i.e. 8.73% of the total) while the abbreviated ones amount to 593.034 (i.e. 91.27 % of the total): the proportions between the two financial statement types are substantially similar to those historically recorded in the Business Register database, therefore the sample is considered representative. Moreover, in all our findings we will consider these two types of financial statements in two different sets, hence the composition of the entire sample is not relevant for the purposes of our research.
Thanks to the collaboration with InfoCamere s.c.r.l, we extracted a report that shows, for both types of financial statements, the non-abstract14 elements defined in the taxonomy (about 1.500 elements) and the frequency that each of these elements is present in the financial statements of the sample for the last fiscal
12 The instance is the file that contains the economic and financial data, which in our case is
the financial statement encoded according to a specific XBRL taxonomy.
13
This represent all instances processed and stored in the server InfoCamere s.c.r.l. (the company that manages, from the IT point of view, the Business Register system) as of September 15, 2015.
14 For non-abstract elements we refer to any taxonomy tag for which the filer may associate,
within the XBRL instance, a value (numeric or textual) of his choice. In the following sections we will always refer, unless otherwise specified, to elements of this type.
year. Based on these data, we determined the usage frequency of the textual blocks and tables of the taxonomy, distinguishing the findings between standard and abbreviated financial statements, to provide a first overview of the taxonomy usage by the filers and to identify critical areas on which to focus our future research studies15.
4.1 Descriptive statistics for the standard financial statements
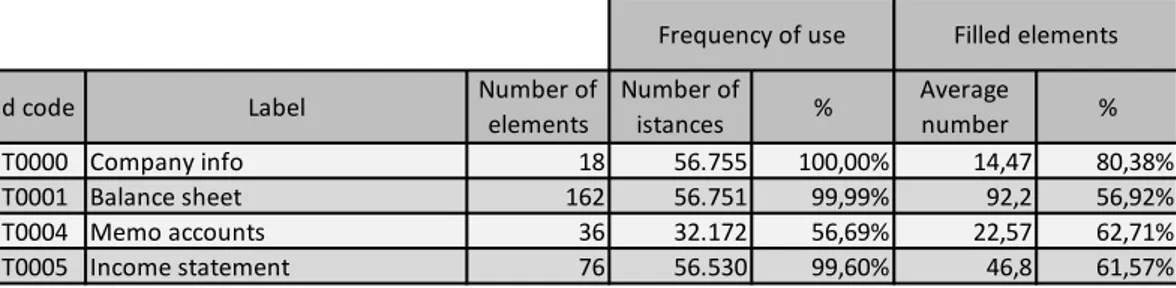
Table 2 reports, for the standard financial statements, the level of usage of the first part of the taxonomy, which represents the section that collects tables on company information and, above all, on the face statements. The variables analyzed are: the number of filed elements for each statement, the frequency of usage of each table, which considers as used the tables with at least one element valued by the filer, and the average number of actually filed elements for each statement.
T0000 Company info 18 56.755 100,00% 14,47 80,38%
T0001 Balance sheet 162 56.751 99,99% 92,2 56,92%
T0004 Memo accounts 36 32.172 56,69% 22,57 62,71%
T0005 Income statement 76 56.530 99,60% 46,8 61,57% Frequency of use Filled elements
Id code Label Number of
elements
Number of istances %
Average
number %
Table 2. Face statements
As shown in table 2, the filing frequency of the company information label is, as expected, equal to 100%. This result is not unusual because the filer has to file at least two of the label elements (the name of the company and its id code) in order to complete the deposit16. From the table we observe that the balance sheet and Income statement are present in almost all the deposits, while the memo accounts are present on average in just more than half of the instances deposited. Overall,
15
A complete set of data is available on request.
16
In fact, it is possible to deposit also XBRL instances without the balance sheet and income statement. The absence of the first, considering also the data that we will show for the abbreviated financial statements, seems to be a consequence of filer’s error; the absence of the second, which in turn is more frequent, is probably due to non-operational companies established just before the end of the year, and thus requires a deep investigation that we postpone to further studies.
the number of elements filed in each table is relatively high and homogeneous, reaching around 60%17 for all the three statements.
Average Median Standard
deviation Q1 Q3 Min. Max.
33,09% 29,88% 25,59% 10,74% 54,22% 0,17% 98,34%
Table 3. Explanatory notes: the average filing percentage
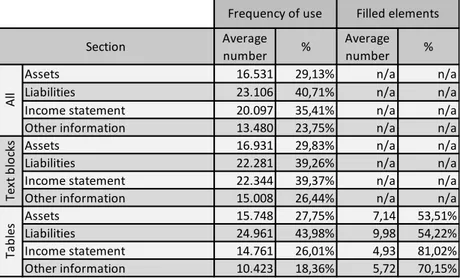
Tables 3 and 4 describe the usage of the second part of the taxonomy of the standard financial statements related to the section that encodes the notes to the financial statements: in particular, we refer to 114 textual blocks and 53 tables for a total of 167 fillable parts. Table 3 provides an overview of the filing percentages: the average is equal to 33,09%, meaning that any of the 167 fillable parts is present in around one third of the sample, while the median is 29, 88%. In the detail, the range goes from a minimum of 0.17% (table of Details on other financial instruments issued by the company label) to a maximum of 98.34% (textual field Introduction, explanatory notes). This high variability is also confirmed by the standard deviation value equal to 25.59%. Moreover, the values of the first and the third quartile show that the distribution is quite uniform.
Average number %
Average number %
Assets 16.531 29,13% n/a n/a
Liabilities 23.106 40,71% n/a n/a
Income statement 20.097 35,41% n/a n/a Other information 13.480 23,75% n/a n/a
Assets 16.931 29,83% n/a n/a
Liabilities 22.281 39,26% n/a n/a
Income statement 22.344 39,37% n/a n/a Other information 15.008 26,44% n/a n/a
Assets 15.748 27,75% 7,14 53,51% Liabilities 24.961 43,98% 9,98 54,22% Income statement 14.761 26,01% 4,93 81,02% Other information 10.423 18,36% 5,72 70,15% A ll
Frequency of use Filled elements
Tex t b lo cks Ta b les Section
Table 4. Explanatory notes: the filing percentage for each section
17 The high usage percentage of the elements composing the label of company information
may be explained, from our point of view, by their easy data retrieval and the automated process of the software used to file the XBRL instances.
In Table 4 is shown the average of the filing frequency of the financial statement notes divided by sections. As we may observe, Liabilities and the Income Statement are the sections presenting the highest usage frequency, respectively 40.71% and 35.41%, whereas low percentages are observed for Assets and Other information sections, respectively 29,13% and 23,75%.
When dividing the filing percentages between textual blocks and tables, we observe a substantial similarity between the two types of fillable parts for Assets and Liabilities while the same cannot be said for the Income Statement and Other information. In fact, for the latter sections, we find that filers filed more frequently the textual blocks than the tables. This finding leads us to two possible interpretations: the textual blocks may have been used mostly because of the unsatisfactory tables (recovering in this way a certain degree of flexibility), or the absence of information to be disclosed, especially in the case of Other information, given the practice to insert in the corresponding textual blocks, comments for not filing.
The section with the most tables used is the Liabilities: on average for a single instance, are used more than half of those provided in the taxonomy. The filing rate of their elements is around 54% for Assets and Liabilities while for Other information and Income Statement rises respectively to 70.15% and 81,02%; in the Income Statement section if a table is used by the filer it is filed almost entirely.
4.2 Descriptive statistics for the abbreviated financial statements
In this section we report descriptive statistics related to the abbreviated financial statements. Similarly to section 4.1, in Table 5 we report the level of usage of the first part of the taxonomy, which represents the section that collects the tables on company information and, above all, those of the face statements. The results are the same as those observed for the standard financial statements, even though the number of financial statements is definitively large.
T0000 Company info 18 593.034 100,00% 14,44 80,25% T0002 Abbreviated balance sheet 58 593.034 100,00% 36,45 62,84%
T0004 Memo accounts 36 227.374 38,34% 28,65 79,59%
T0006 Abbreviated income statement 80 590.977 99,65% 43,7 54,62%
Id code Label Number of
elements
Frequency of use Filled elements Number of
istances %
Average
number %
Table 5. Face statements
With reference to the tables’ filing frequency, excluding the decrease in the use of memo accounts’ tables, there are no considerable differences as compared to the findings for standard financial statements. However, interesting to note, is the usage frequency of the elements that compose the tables: there is an important increase in the percentage for both statements, the balance sheet18 and the memo accounts19 (these, furthermore, are identical for both types of financial statements)20; for the income statement the considerations are different (this statement is also similar for both types of financial statements), showing a reduction of the filed elements probably due to the lower complexity of the reporting entity and the greater number of elements (because of the faculty to combine some details in subtotals).
Average Median Standard
deviation Q1 Q3 Min. Max.
21,06% 12,35% 22,03% 2,93% 34,17% 0,04% 99,05%
Table 6. Explanatory notes: average filing percentage
Tables 6 and 7 describe the usage of the second part of the taxonomy related to the section that encodes the notes to the abbreviated financial statements: in particular, there are 123 textual blocks and 64 tables for a total of 187 fillable
18
The reason of the high filing percentage compared to the balance sheet of the standard financial statements is explained by the lower number of elements that make up the balance sheet of the abbreviated financial statement.
19
There are two possible explanations: the first is that there are many zeros or the filers insert full information, and the second is that it could be a mix of the two situations mentioned previously.
20 Memo accounts are filed less frequently but with more information content in the abbreviated
financial statements (less than 30% of the cases), as compared to standard financial statements (around 60% of the cases).
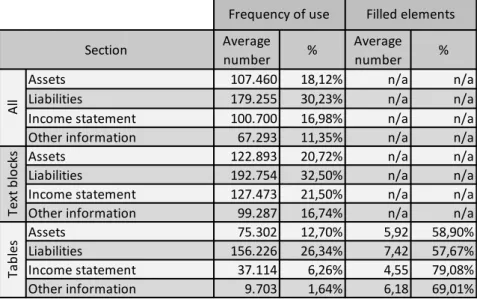
parts. It seems paradoxical, but interesting to mention is the fact that the fillable parts for the abbreviated financial statements exceed those for the standard ones: the filer, as explained in section 3, may increase the accuracy of the encoded information with the faculty to use also the standard financial statement’s tables.
Average
number %
Average
number %
Assets 107.460 18,12% n/a n/a
Liabilities 179.255 30,23% n/a n/a
Income statement 100.700 16,98% n/a n/a
Other information 67.293 11,35% n/a n/a
Assets 122.893 20,72% n/a n/a
Liabilities 192.754 32,50% n/a n/a
Income statement 127.473 21,50% n/a n/a
Other information 99.287 16,74% n/a n/a
Assets 75.302 12,70% 5,92 58,90% Liabilities 156.226 26,34% 7,42 57,67% Income statement 37.114 6,26% 4,55 79,08% Other information 9.703 1,64% 6,18 69,01% Ta b les
Frequency of use Filled elements
Section A ll Tex t b lo cks
Table 7. Explanatory notes: the filing percentage for each section
We provide an overview on the filing percentage of the explanatory notes in table 6: the average is equal to 21.06%, suggesting that any of the 187 fillable parts is present in more than a fifth of the financial statements, while the median is 12.35%. In the detail, the range goes from a minimum of 0.04% (table of Analysis of non-current receivables included among current assets for operations that envisage the obligation for retrocession at term) to a maximum of 99.05% (textual field Introduction, explanatory notes). This high variability is also confirmed by the standard deviation value equal to 22,03%. The value of the first quartile is particularly significant: it shows that the first 25% of the sections of explanatory notes are filed only in less than 3% of the instances: in this case the distribution is rather concentrated near zero, confirming that companies reporting their financial statements using the abbreviated form, tend to disclose less information.
Table 7 shows the average of the filing frequency of the notes to the financial statements divided by sections. Thus, still the most filed section is that of Liabilities, with an average usage rate of 30.23%. However, contrary to the
standard financial statements, the information content for the abbreviated ones decreases significantly, especially for the Income Statement and Other information sections: this is due, as we expected, to the lower complexity of the reporting entity. However, we think that in this case, should be also considered the impact of the greater number of filed parts. We postpone this analysis to further research studies.
When analyzing the filing percentages divided between textual blocks and tables we observe a clear preference of the filers for using textual blocks, which in part could be explained, we believe, with the reasons above mentioned. However, when the tables are chosen, the elements’ filing percentage remains in line with that of the standard financial statements.
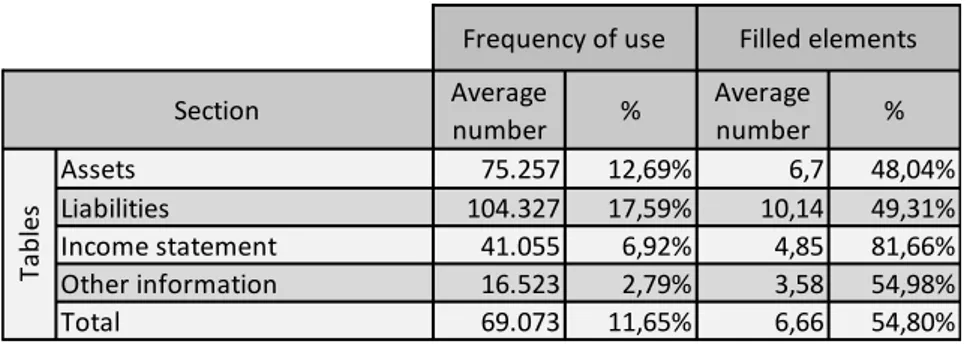
Average number % Average number % Assets 75.257 12,69% 6,7 48,04% Liabilities 104.327 17,59% 10,14 49,31% Income statement 41.055 6,92% 4,85 81,66% Other information 16.523 2,79% 3,58 54,98% Total 69.073 11,65% 6,66 54,80% Ta b les
Frequency of use Filled elements
Section
Table 8. Tables of the standard financial statements used in the abbreviated ones
In table 8 above, is shown the average of the statements that are included in the abbreviated financial statements which are proper of the standard ones: we observe that a general statement of the standard financial statements appears between 2.79% and 17.59% in the abbreviated ones, and when this happens, it is filed for about 50% of its elements (which increases to more than 81% in the case of the Income Statement).
Frequency of use
Id code Section Label % Average %
T0186 Assets Analysis of the changes and due date of
receivables included among current assets 60,23% 7,62 47,62% T0207 Assets Analysis of changes in liquid funds 48,58% 3,41 85,17% T0180 Assets Analysis of changes in inventory 32,37% 4,04 67,39% T0212 Assets Analysis of changes in accrued income and
prepaid expenses 31,55% 6,08 75,96% T0129 Assets Analysis of changes in tangible fixed assets 30,40% 31,09 32,39% T0122 Assets Analysis of changes in intangible fixed assets 24,43% 31,42 24,54% T0191 Assets Details on receivables included among
current assets by geographic area 19,95% 5,67 56,74% T0307 Liabilities Analysis of payables changes and due date 47,70% 10,90 36,33% T0331 Liabilities Analysis of changes in accrued liabilities and
deferred income 24,77% 6,09 76,08% T0312 Liabilities Details on payables by geographic area 19,71% 7,62 44,83% T0385 Income
statement Details on net revenue by business category 19,90% 2,93 97,75% T0402 Income
statement
Breakdown of interest and other financial
liabilities by payables type 10,75% 2,71 67,71% Filled elements
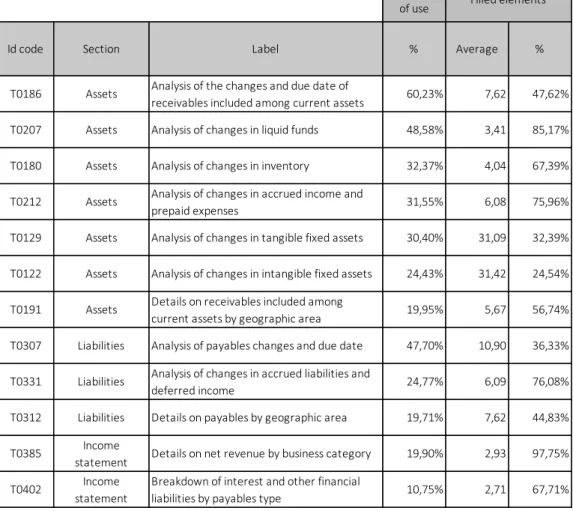
Table 9. Tables of the standard financial statements used in the abbreviated ones
However, the low average of filing percentages hides large differences: when analyzing the data for each individual table, the filing range goes from 0.04% to 60.23%. In table 9 are shown the statements with an average filing frequency of more than 10%: interesting to note is that the use of the tables of standard financial statements by the filers of abbreviated ones focuses on the Assets, particularly in the analysis of variations in assets. In addition, interesting to point out is also the usage frequency of Current assets and Liabilities, which represent the first and the third mostly used tables.
5. TAXONOMY CUSTOMIZATIONS
In this section, we analyze the degree of customizations made by the filers, as a first proxy for measuring the level of voluntary disclosure (intended as information disclosed above that required by law). We used a simple random sampling method for selecting 10.000 financial statements from the population of all financial statements filed and submitted in XBRL format for the fiscal year ending on or after 31 December 2014. This sample is composed of 1.258 standard financial statements21, 8.738 abbreviated financial statements and 4 consolidated financial statements: consolidated financial statements22 are not considered for the purposes of this study.
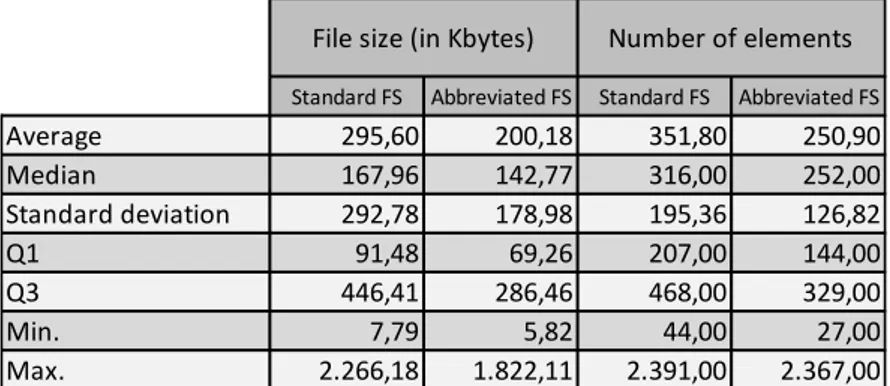
To better understand the sample characteristics, in table 10 we report descriptive statistics for the two variables that determine the extent of information for each XBRL file: the size in kilobytes of the XBRL file and its number of non-abstract elements.
Standard FS Abbreviated FS Standard FS Abbreviated FS
Average 295,60 200,18 351,80 250,90 Median 167,96 142,77 316,00 252,00 Standard deviation 292,78 178,98 195,36 126,82 Q1 91,48 69,26 207,00 144,00 Q3 446,41 286,46 468,00 329,00 Min. 7,79 5,82 44,00 27,00 Max. 2.266,18 1.822,11 2.391,00 2.367,00
Note: FS stands for financial statements.
File size (in Kbytes) Number of elements
Table 10. XBRL instances: file size and elements’ numerosity
The results show that on average, the standard financial statements are larger both in terms of kilobytes (even though not so considerable as we would have expected) and in terms of number of elements present in the file. For both types of financial statements, we observe also a large variability as measured by their
21
The standard financial statements account for 12.6% of the total, a percentage that is higher than that of the entire population; however, this difference does not affect our results because the analysis is performed distinctively for each sample.
22
Consolidated financial statements are excluded because of not only their different statements but also because the impossibility to use XBRL for encoding their notes.
standard deviation and the minimum and maximum values (the table shows financial statements composed of less than 50 elements but also others with more than 2300 elements). The values of the first quartile show that the distributions for the standard and abbreviated financial statements are quite similar on the left side (i.e. for the instances with a small file size and instances with a low number of elements). On the other hand, the third quartile shows that the distribution for the standard financial statement is less concentrated near the lower level than the abbreviated one. This confirms that a large part of companies adopting abbreviated financial statements produce smaller instances, both in terms of file size and in terms of number of elements.
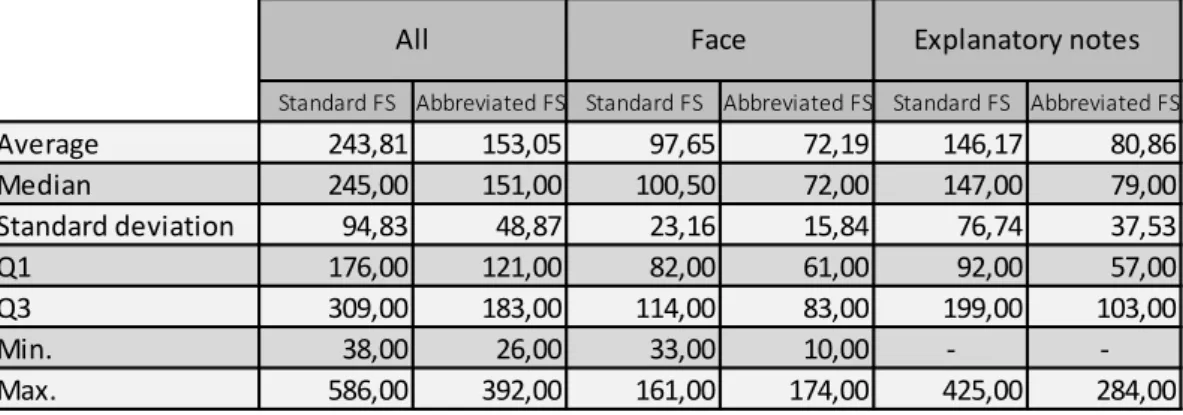
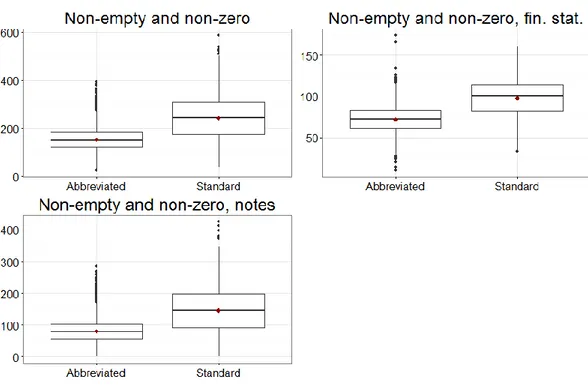
Then, to further analyze the previous results we refined the analysis by excluding from the financial statements the elements that are empty or have a value of 0: from this analysis we observe substantially different results that we present in table 11. As shown in table 11, when considering only the “concrete” elements, so non-empty elements or elements with a value different from 0, the gap between ordinary and abbreviated financial statements is more restrained and reduces the average values of almost 100 elements compared to the findings in table 10. Additionally, we observe a reduced standard deviation, which suggests a restrained dispersion of the data, even though the variability is still high. This is also confirmed by the values of the first and the third quartile, which suggest that the distributions are more concentrated around the average, hence more regular.
Standard FS Abbreviated FS Standard FS Abbreviated FS Standard FS Abbreviated FS
Average 243,81 153,05 97,65 72,19 146,17 80,86 Median 245,00 151,00 100,50 72,00 147,00 79,00 Standard deviation 94,83 48,87 23,16 15,84 76,74 37,53 Q1 176,00 121,00 82,00 61,00 92,00 57,00 Q3 309,00 183,00 114,00 83,00 199,00 103,00 Min. 38,00 26,00 33,00 10,00 - -Max. 586,00 392,00 161,00 174,00 425,00 284,00
Note: FS stands for financial statements.
All Face Explanatory notes
Focusing our attention on the notes, the results show a clear difference between the standard and the abbreviated financial statements: the latter, on average, are composed of more than half of the elements of the standard financial statements. However, it is interesting to observe that choosing the abbreviated financial statements from the quantitative point of view, does not necessarily imply low information content.
The graphs in Figure 2 show a considerable difference between standard and abbreviated financial statements. However, for the abbreviated ones, there is also a high presence of outliers that have higher number of concrete elements compared to the standard financial statements.
Figure 2. Average number of elements for each type of financial statement
To measure the degree of customizations made by the filers, as a first parameter we used, the number of table customizations23, which are tables not provided by default in the taxonomy 2014-11-17, for each financial statement of the sample.
23 Customized tables as defined by the filers, must be inserted in the textual Blocks type
elements within the XBRL instances, using xHTML coding for formatting them: this allowed us to identify very accurately the presence and location of these tables.
We found that the number of instances with customized tables is 938 for the standard FS (74,6% of the number of instances for standard FS) and 6.757 for the abbreviated FS (77,3% of the number of instances for abbreviated FS). Thus, the first significant finding refers to the total number of instances presenting customized tables. In fact, we find that 77.0% of the sample instances show at least one customized table.
Furthermore, the percentage of financial statements that present at least one customized table is higher for the abbreviated financial statements compared to the ordinary ones. It seems that the users of financial statements in the abbreviated form tend to adopt more customized tables than the users of standard financial statements. Nevertheless, the percentage of financial statements that do not present customized tables varies between 22.7% and 25.4%, a percentage that is much below our expectations24.
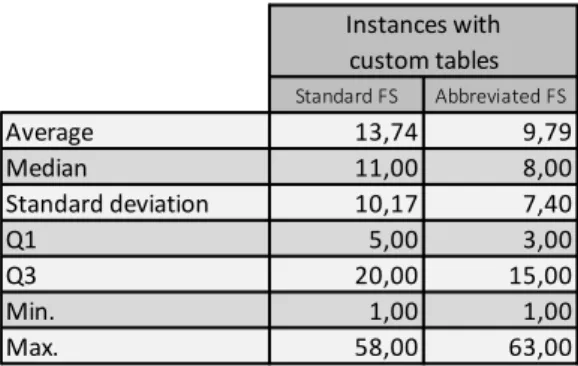
Standard FS Abbreviated FS Average 13,74 9,79 Median 11,00 8,00 Standard deviation 10,17 7,40 Q1 5,00 3,00 Q3 20,00 15,00 Min. 1,00 1,00 Max. 58,00 63,00
Note: FS stands for financial statements.
Instances with custom tables
Table 12. Number of elements with customized tables
The second parameter we used to investigate the degree of customizations made is the number of XBRL tags where the customized tables are located. In table 12 is shown that on average, for each abbreviated financial statement there are nearly 10 elements that include customized tables, while for the standard financial statements, there are nearly 14. The low values of Q1 and Q3 show that the
24
However, of interest to be mentioned is the fact that this variable does not distinguish between tables created to actually provide additional numerical information with respect to the tables offered by the taxonomy and those used solely for formatting the different discursive sections of the financial statement. In fact, from an analysis conducted on a limited number of instances, we found that most of these customized tables actually provide additional numerical information.
distribution is concentrated near zero, meaning that is quite frequent for companies to use only a lower number of customized tables. Furthermore, we identified the sections of the notes where the customized tables are inserted: table 13 provides a list of the filers’ most personalized sections.
Section name Number %
Deferred current and anticipated taxes 21.472 8,40%
Financial income and charges 16.446 6,50%
Profit and loss account explanatory note 16.172 6,30%
Explanatory notes 14.462 5,70%
Shareholders’ equity 13.262 5,20%
Payables 12.408 4,90%
Tangible assets 12.354 4,80%
Customized tables
Table 13. Most customized sections
The first three most customized sections are those of income statement. This is an important signal: apparently the filers do not consider as adequate or sufficient the few tables provided by the taxonomy 2014-11-17 for this statement. With regard to Deferred current and anticipated taxes, the results unequivocally signal a problem of inadequacy of the tables: in fact, from a total of eight tables provided for the entire section of the notes to the income statement, half of them are provided only for this section. For Financial income and charges, however, the explanation could be related with the insufficient number of tables provided by the taxonomy 2014-11-17: in fact, only one table that divides the financial income (not charges) by the type of accrued loan it is available, in line with the requirements of the number 12 of art. 2427 of the Civil Code. The necessity for a greater number of tables to the income statement emerges also from the third section named Profit and loss account explanatory note: the taxonomy 2014-11-17 doesn’t provide tables to detail, for example, the main operating costs (perhaps classifying them by destination or function). In fact, there are no regulatory requirements or guidance of particular detail from the accounting principles on the information to offer for revenues and, above all, costs25.
25
Article 2427 of the Civil Code gives a marginal attention to the income statement: in fact, of the thirty numbers that make up this article, only four relate to the income statement.
Standard FS Abbreviated FS Average 74% 49% Median 80% 48% Standard deviation 22% 32% Q1 65% 23% Q3 91% 81% Min. 24% 1% Max. 100% 96%
Note: FS stands for financial statements.
% of s ections with cus tomized ta bles a nd defa ult ta bles
Table 14. Sections with customized tables and default tables together
Finally, we tried to estimate whether the filers used the customized tables, to disclose additional information (voluntary information) with respect to that offered by the taxonomy or as a substitute of the tables offered by the taxonomy. In table 14 we report the findings26. We find that for the standard financial statements on average 74% of the customized tables are included along with the tables defined by the taxonomy (and in some sections it reaches 100%); in turn, for the abbreviated financial statements the percentage decreases below 50%, signaling that in most of the cases the customized tables are used in substitution of the tables defined by the taxonomy. This is confirmed by the values of the first and the third quartile: for standard financial statements these values are quite high, showing that the distribution is concentrated near 100%: it is very frequent for companies adopting this kind of financial statement to use standard tables and give more detailed information in the textual blocks. For abbreviated financial statements, the low value of Q1 suggests that the distribution is more constant, showing that there is an equal number of companies that use standard tables together with customized tables and of companies that use customized tables in substitution of standard tables.
6. CONCLUSIONS AND FUTURE RESEARCH DIRECTIONS
In this study we analyze the impact of the taxonomy 2014-11-17 on financial reporting quality of the Italian unlisted companies. In particular, our attention is
focused on XBRL extension to the financial statement notes. Using a considerable database of all the Italian unlisted companies we find interesting results. Thus, overall our sample shows a high degree of compliance with the taxonomy 2014-11-17. In fact, as reported in table 1, in 2015 we observe that the percentage of the double filing has continued its decreasing trend seen in the recent years. This is very surprising to us taking into account the decision of the standard setters to extend XBRL adoption also to the financial statement notes. Analyzing the taxonomy usage for the face statements we observe high usage values for the abbreviated financial statements as well as for the standard ones. Focusing on the notes to financial statements, we still observe a considerable filing percentage for both types of financial statements, even though, as we expected the abbreviated financial statements show lower information content. When dividing the notes’ sections between textual blocks and tables, we find a clear preference for the filers to file the textual blocks. This may be explained as a deficiency of the tables offered by the taxonomy to offer complete information or as a lack of information to disclose by the filers. Additionally, of particular interest to be mentioned is also the finding related to the considerable usage of standard financial statement’s tables by the filers of the abbreviated ones. This is very interesting considering that even though these financial statements represent an entity with low reporting complexity, the filers tend to increase their disclosure practices by using widely the tables proper of the standard financial statements.
We used the proper table customizations made by the filers to analyze the level of voluntary disclosure of the companies. There is a high degree of customizations made by the filers of both financial statements suggesting that one of the main taxonomy limits, the non-extensibility, may have been bypassed by the considerable use of these customizations. In particular, these customizations were introduced mostly in the income statement section suggesting table deficiencies of the taxonomy for these sections. Furthermore, we find that the abbreviated financial statements show a higher degree of table customizations than the standard ones. Additionally, when analyzing whether the customized tables are used along or as a substitute to the tables offered by the taxonomy, the findings for the abbreviated financial statements show that filers have used the customizations as a substitute to the tables offered by the taxonomy, signaling a
clear necessity for the filers to increase the information disclosed maybe as a result of the inadequacy of the tables offered by the taxonomy for the abbreviated financial statements.
This paper adds to the very few studies analyzing the financial statement notes in XBRL and thus contributes to the previous literature in several ways. As a consequence of the recent adoption of the taxonomy 2014-11-17 the data we use represents the very first sample of financial statements in fully XBRL format. In addition, this data represent a huge set of all the financial statements submitted as of 15 September 2015 making our results very representative. In turn, as mentioned previously, tagging the financial statement notes is particularly important and very challenging for the filers. Nevertheless, our results show that XBRL filers have widely accepted the benefits of the new requirement. One of the XBRL potentials and advertised outcomes was the easy comparability of the financial statements; however, the high degree of customizations made by the filers of both financial statements suggests that maybe there is still work to be done. Finally, our results could be of interest also for the standard setters. In fact, the tendency to use tables proper of the standard financial statements and the high level of customizations shows a clear need for the filers of abbreviated financial statements to increase the level of disclosure. This in turn, is also contrary to the recent recommendations of the standard setters to reduce the information content for the small or micro-entities introduced in 2016 by the Article 2435-ter of the Civil Code.
This study leads also to new opportunities for future research. In fact, we showed a high propensity of voluntary disclosure from the filers of the abbreviated financial statements. This could shape the way for researchers to analyze the reasons pushing these filers or companies to increase their disclosure practices. The link between voluntary disclosure practices and company characteristics (such as size, debt, liquidity, corporate governance etc.) could be of interest for further studies. In turn, for the voluntary disclosure practices another variable of interest to analyze could be also the statement of cash flows. This statement in fact, is not defined by the taxonomy 2014-11-17 so the filers who want to introduce it are left with the choice to insert it as a customized table. It is interesting to analyze the filers’ behavior due to the non-mandatory requirement
for the statement of cash flows. Indeed, in a recent study conducted by Janvrin and No (2012) based on interviews to accounting officers in charge of XBRL implementation in US, the authors report that the respondents pointed out the difficulties in tagging the cash flow statement. In addition, they admitted also that the most of their extensions were related to this statement. Based on this, even though the taxonomy and the companies are different, one would expect the same issues for the Italian filers. Finally, international comparisons could be developed to better understand if also the country characteristics impact the quality of financial reporting in XBRL.
7. REFERENCES
ARNOLD, V.; BEDARD, J. C.; PHILLIPS, J. R.; SUTTON, S. G. (2012): “The impact of tagging qualitative financial information on investor decision making: Implications for XBRL”, International Journal of Accounting Information Systems, vol. 13, n. 1: 2–20. http://dx.doi.org/10.1016/j.accinf.2011.12.002 AVALLONE, F.; RAMASSA, P.; RONCAGLIOLO, E. (2016): “XBRL Extension to the Financial Statement Notes: Field-based Evidence on Unlisted Companies”, The International Journal of Digital Accounting Research, vol. 16, n. 3: 61–84. DOI doi.org/10.4192/1577-8517-v16_3
BARTLEY, J.; AL-CHEN, Y. S.; TAYLOR, E. (2010): "Avoiding Common Errors of XBRL Implementation", Journal of Accountancy, vol. 209, n. 2: 46–51. BLANKESPOOR, E.; MILLER, B. P.; WHITE, H. D. (2014): "Initial evidence on the market impact of the XBRL mandate", Review of Accounting Studies, vol. 19, n. 4: 1–36. http://dx.doi.org/10.1007/s11142-013-9273-4
BONSÓN, E. (2001): "The Role of XBRL in Europe", The International Journal of Digital Accounting Research, vol. 1, n. 2: 101–110. http://dx.doi.org/10.4192/ 1577-8517-v1_5
BONSÓN, E.; CORTIJO, V.; ESCOBAR, T. (2009): "A Delphi investigation to explain the voluntary adoption of XBRL", The International Journal of Digital Accounting Research, vol. 9, n. 7: 193–205. http://dx.doi.org/10.4192/1577-8517-v9_7
BORITZ, J. E.; NO, W. G. (2008): "The SEC’s XBRL Voluntary Filing Program on EDGAR: A Case for Quality Assurance", Current Issues in Auditing, vol. 2, n. 2: A36–A50. http://dx.doi.org/10.2308/ciia.2008.2.2.a36
BORITZ, J. E.; TIMOSHENKO L. M. (2015): "Firm-Specific Characteristics of the Participants in the SEC’s XBRL Voluntary Filing Program", Journal of Information Systems, vol. 29, n. 1: 9–36. http://dx.doi.org/10.2308/isys-50896 CALLAGHAN, J.; NEHMER, R. (2009): "Financial and governance characteristics of voluntary XBRL adopters in the United States", International Journal of Disclosure and Governance, vol. 6, n. 4: 321–335.
http://dx.doi.org/10.1057/jdg.2009.15
CHO, Y. J.; BHATTACHARYA, N.; KIM, J. B. (2014): "XBRL Mandate and Access to Information: Evidence from Reactions of Financial Analysts and Institutional Investors", Paper presented at American Accounting Association Annual Meeting, Research Collection School of Accountancy.
DEBRECENY, R.; GRAY, G. L. (2001): "The production and use of semantically rich accounting reports on the Internet: XML and XBRL", International Journal of Accounting Information Systems, vol. 2, n. 1: 47–74. http://dx.doi.org/ 10.1016 /s 1467-0895(00)00012-9
DEBRECENY, R. S.; CHANDRA, A.; CHEH, J. J.; GUITHUES-AMRHEIN, D.; HANNON, N. J.; HUTCHISON, P. D.; VASARHELYI, M. A. (2005): "Financial Reporting in XBRL on the SEC’s EDGAR System: A Critique and Evaluation", Journal of Information Systems, vol. 19, n. 2: 191–210. http://dx.doi.org /10.2308 /jis.2005.19.2.191
DEBRECENY, R. S.; FAREWELL, S. M.; PIECHOCKI, M.; FELDEN, C.; GRANING, A.; D’ERI, A. (2011): "Flex or break? Extensions in XBRL disclosures to the SEC", Accounting Horizons, vol. 25, n. 4: 631–657. http://dx.doi.org/10.2308/acch-50068
DU, H.; VASARHELYI, M.; ZHENG, X. (2013): "XBRL Mandate: Thousands of Filing Errors and So What?", Journal of Information Systems, vol. 27, n. 1: 1689–1699. http://dx.doi.org/10.2308/isys-50399
EFENDI, J.; PARK, J. D.; SMITH, L. M. (2014): "Do XBRL filings enhance informational efficiency? Early evidence from post-earnings announcement drift", Journal of Business Research, vol. 67, n. 6: 1099-1105. http://dx.doi .org/10.1016/ j.jbusres.2013.05.051
EFENDI, J.; PARK, J. D.; SUBRAMANIAM, C. (2010): Do XBRL Reports Have Incremental Information Content? - An Empirical Analysis. http://ssrn.com/ abstract=1671723. http://dx.doi.org/10.2139/ssrn.1671723
FRADEANI, A. (2009): XBRL - il presente ed il futuro della comunicazione economico-finanziaria, Giuffrè Editore, Milano.
FRADEANI, A.; REGOLIOSI, C.; D`ERI, A.; CAMPANARI, F. (2016): Implementation of Mandatory IFRS Financial Disclosures in a Voluntary Format: Evidence from the Italian XBRL Project, in Mancini, D., Castellano, N., Corsi, K., & Lamboglia, R. (Eds.), Reshaping accounting and management control system through digital innovation, Springer-Verlag, Berlin-Heidelberg, forthcoming.
HODGE, F. D.; KENNEDY, J. J.; MAINES, L. A. (2004): "Does search facilitating technology Improve the Transparency of Financial Reporting ?", The Accounting Review, vol. 79, n. 3: 687–703. http://dx.doi.org/ 10.2308 /accr.2004.79.3.687
JANVRIN, D. J.; NO, W. G. (2012): "XBRL Implementation: A Field Investigation to Identify Research Opportunities". Journal of Information Systems, vol. 26, n. 1: 169–197. http://dx.doi.org/10.2308/isys-10252
KAYA, D. (2014): "The Influence of Firm-Specific Characteristics on the Extent of Voluntary Disclosure in XBRL: Empirical Analysis of SEC Filings". International Journal of Accounting and Information Management, vol. 22, n. 2: 2–17. http://dx.doi.org/10.1108/ijaim-05-2011-0007
KIM, J. W.; LIM, J. H.; NO, W. G. (2012): "The Effect of First Wave Mandatory XBRL Reporting across the Financial Information Environment,. Journal of Information Systems, vol. 26, n. 1: 127–153. http://dx.doi.org/10.2308/isys-10260
LIU, C.; YAO, L. J.; SIA, C. L.; WEI, K. K. (2014): "The impact of early XBRL adoption on analysts’ forecast accuracy - Empirical evidence from China", Electronic Markets, vol. 24, n. 1: 47–55. http://dx.doi.org/10.1007/s12525-013-0132-8
PERDANA, A.; ROBB, A.; ROHDE, F. (2014): "An Integrative Review and Synthesis of XBRL Research in Academic Journals", Journal of Information Systems, vol. 29, n. 1: 115–153. http://dx.doi.org/10.2308/isys-50884
PINSKER, R.; LI, S. (2008): "Costs and benefits of XBRL adoption", Communications of the ACM, vol. 51, n. 3: 47–50. ttp://dx.doi.org/ 10.1145/1325555.1325565
PLUMLEE, R. D.; PLUMLEE, M. A. (2008): "Assurance on XBRL for financial reporting", Accounting Horizons, vol. 22, n. 3: 353–368. http://dx.doi.org/ 10.2308/acch.2008.22.3.353
PREMUROSO, R. F.; BHATTACHARYA, S. (2008): "Do early and voluntary filers of financial information in XBRL format signal superior corporate governance and operating performance?" International Journal of Accounting Information Systems, vol. 9, n. 1: 1–20. http://dx.doi.org/10.1016/ j.accinf. 2008.01.002
RAGOTHAMAN, S. (2012): "Voluntary XBRL adopters and firm characteristics: An empirical analysis", International Journal of Digital Accounting Research, vol. 12, n. 4: 93–119. http://dx.doi.org/10.4192/1577-8517-v12_4
VALENTINETTI, D.; REA, M. A. (2011): "Adopting xbrl in italy: early evidence of fit between italian GAAP taxonomy and current reporting practices of non listed companies", The International Journal of Digital Accounting Research, vol. 11, n. 3: 45–67. http://dx.doi.org/10.4192/1577-8517-v11_3
VALENTINETTI, D.; REA, M. A. (2012): "IFRS Taxonomy and financial reporting practices: The case of Italian listed companies", International Journal of Accounting Information Systems, vol. 13, n. 2: 163–180. http://dx.doi.org/ 10.1016/j.accinf.2011.09.001
YOON, H.; ZO, H.; CIGANEK, A. P. (2011): "Does XBRL adoption reduce information asymmetry?" Journal of Business Research, vol. 64, n. 2: 157–163. http://dx.doi.org/10.1016/j.jbusres.2010.01.008
ZAMBON, S. (2010): XBRL e informativa aziendale. Traiettorie, innovazioni e sfide. Franco Angeli, Milano.