Furio Camillo
Dipartimento di Scienze Statistiche, Università di Bologna, Via delle Belle Arti 41, 40126, Bologna, Italia Ida D’Attoma
Dipartimento di Scienze Statistiche, Università di Bologna, Via delle Belle Arti 41, 40126, Bologna, Italia
1. I
NTRODUCTIONThis work stems from the consideration that different interview modes might cause differences in answers. Considering the case of the mixed use of the computer assisted telephone interviewing (CATI) and computer assisted web interviewing (CAWI) modes the following research question will be explored: Do different treatments (CATI and CAWI) generate different outcomes (answers to the question of interest)? To answer to such a question the influence of self-selection on the observed answers must be considered, being quite often the assignment to different interview modes (the treatment) not random.
On many fields, the problem of selection bias is mainly faced by referring to the propensity score (PS) approach proposed by (Rosenbaum and Rubin, 1983). The authors scrutinized such a problem by modelling the selection process given a set of pre-treatment covariates as a way of reducing bias in the estimation of the treatment effect. They demonstrated that, having in hand several pre-treatment information which characterizes the units under analysis, it is possible to create groups of units having similar pre-treatment characteristics. These groups are, therefore, theoretically independent from the kind of undergone treatment. Within these groups it becomes possible to compare the target variable among those who have undergone the treatment and those who have not. Actually, the PS method is widely used also in the survey field. Lee (2006), for example, suggested the use of the PS adjustment as an approach of adjustment for volunteer panel web survey data. Another work which investigates PS as a method for dealing with selection bias in web surveys is that of (Schonlau et al., 2006) who proposed to construct weights based on the
PS to correct for selectivity. Despite PS is widely applied to correct for selection bias it suffers from some drawbacks: the main of which is that it is prone to model dependence ( i.e. see King and Zeng, 2006 ; Ho et al., 2007). To control for selection bias this paper proposes for the first time in
survey literature the use of the multivariate approach introduced in Camillo and D'Attoma (2010) applied in Peck et al. (2010) and extended in D'Attoma and Camillo (2011).
Such multivariate approach has three main features. The first feature - the measure of global imbalance (GI)- is a single measure of imbalance in data, mainly based on the concept of inertia as a measure of association among categorical covariates and the assignment-to-treatment indicator variable. The second feature -the multivariate test of imbalance- allows to test GI and represents an improvement over the variable-by-variable tests. The last feature - the use of cluster analysis enhances the possibility of finding local spaces in which balance holds according to the GI measure
and its related test; within balanced groups data gathered with different data collection techniques are homogeneous and the mode effect estimates are ascribable to the type of technique being used. This paper applies the multivariate approach to AlmaLaurea survey data on second level graduates’ employment condition one year from graduation conducted in 2008 1 as an example of potential application. Such data are used for two main reasons. First, because data are related to a large-scale survey that includes a data collection process well controlled in each phase. Hence, other sources of non-sampling errors besides that due to the two data collection methods (i.e. CAWI/CATI) are a priori minimized. Second, because we can compare the multivariate approach to the approach that AlmaLaurea used to adopt in their surveys a complex system to monitor data quality that includes also the measure of the mixed modes effect. In this way we can ascertain if the new method is equally or more effective than the traditional propensity score method in reducing selection bias. The remainder of this paper is organized as follows: section 2 briefly presents the AlmaLaurea survey on graduates’ condition. Section 3 introduces the multivariate approach and the PS subclassification. Section 4 presents AlmaLaurea PS subclassification results and the multivariate approach ones. Finally, section 5 discusses and concludes.
2. M
IXED USE OFCAWI
ANDCATI
METHODS:
T
HEA
LMAL
AUREA CASEData are increasingly collected with a combination of different survey modes. Such tendency is widely documented in literature (Dillman et al., 1996; Bethlehem, 2010; Kreuter et al., 2008; De
Leeuw, 2005; Borkan, 2004; Vannieuwenhuyze et al., 2010; Mora, 2011). Mixed mode surveys
combine the use of different data collection procedures (i.e. telephone, mail, web, face-to-face interview) in a single survey project. In some instances, a mixed mode survey may provide an opportunity for respondents to choose or switch methods that may increase the participation rate. Some methods are significantly less costly than others. Furthermore, in large-scale surveys, some methods like mail questionnaires (Wright, 2005) may also allow to save time in conducting the survey. If on one hand, the use of the mixed mode gives some advantages, on the other hand, it may introduce a big disadvantage that is different modes potentially provide different answers. Many articles document the increased use of mixed modes and propose methods to minimize the problem of distortion in answers (i.e. Jansen , 2006; Woltman et al., 1980; Schonlau et al., 2006;
Schonlau et al., 2002; Vannieuwenhuyze et al., 2010). Applications of mixed modes are also
increased. Here, the case of AlmaLaurea survey on second level graduates’ employment condition one year from graduation, that is part of the more comprehensive survey conducted in 2008, is presented. As reported in Camillo et al. (2011) and Cammelli et al. (2011), the survey makes
possible to analyze the most recent labour market trends through an examination of the career opportunities available for the Italian graduates of the universities taking part in the AlmaLaurea consortium2 during the 5 years after graduation. All graduates are contacted 1,3, and 5 years after graduation. In 2008, more than 287,000 graduates were examined. The survey also involved all first and second level graduates from the class of 2007 (about 140,000). The huge number of graduates involved has determined the necessity to use survey methods that allow the reduction of costs and duration. These objectives have been achieved through the introduction of two survey methods:
1 For more details about the survey look at
http://www2.almalaurea.it/cgi-php/universita/statistiche/framescheda.php?anno=2008&corstipo=LS&ateneo=tutti&facolta=tu tti&gruppo=tutti&pa=tutti&classe=tutti&postcorso=tutti&annolau=1&disaggregazione=tutti&L ANG=en&CONFIG=occupazione
2 Further information on AlmaLaurea Consortium and survey methods can be found at: www.almalaurea.it
CAWI and CATI. The graduates having a mailbox (85% of the cohort) have been emailed with two email reminders. Afterwards, all graduates who had not answered to the online questionnaire (and, obviously, graduates not having a mailbox) have been contacted by phone.
More precisely, given the survey’s cohort, self-selected respondents voluntary participate to CAWI. Afterwards, the non-respondents are followed by CATI. The use of CATI, for some aspects, overcomes the CAWI under-coverage problem (Bethlehem 2010), namely only respondents with internet access can complete the questionnaire form. The CAWI self-selection problem remains, that is individuals select themselves for the survey. Based on the belief that any interview mode affects the probabilities of including respondents in a sample (Schonlau et al.,
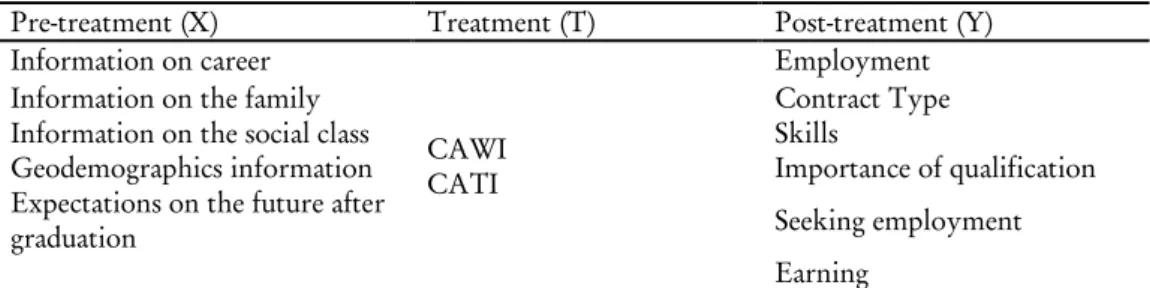
2006), and also their answers, the AlmaLaurea aim was to determine if the observed differences in the answers were determined by self-selection (e.g. those who are inclined to answer to CAWI interviews are the same who have specific characteristics in terms of auxiliary information) or just by the different data collection method. If on one hand, the presence or absence of interviewers is an important determinant for the quality of the information collected, on the other hand, because of the cultural level of the cohort involved in the interview, the contribution given by the interviewers may be limited: in some instances it may even be counterproductive, since they may influence the answers of the graduates. For such reasons, it has become important to determine if there are significant differences among the answers given by those who filled in the online questionnaire and those who gave their answers during the telephone interview (interview mode effect). This need has also been confirmed by the fact that these two groups of graduates turned out to be different in some preliminary analysis; for example, as it will be showed in the section 4, in terms of their studies and area of residence and all other examined characteristics with the exception of gender (self-selection effect). The survey enabled the AlmaLaurea consortium to collect the main information related to academic and work experiences made after graduation (table 1): employment condition at the time of interview, characteristics of the job, time-to-entry into the labour market.
TABLE 1 Collected data
Pre-treatment (X) Treatment (T) Post-treatment (Y)
Information on career
CAWI CATI
Employment
Information on the family Contract Type
Information on the social class Skills
Geodemographics information Importance of qualification
Expectations on the future after
graduation Seeking employment
Earning
Such information is integrated by the huge quantity of pre-survey data on sociodemographics characteristics of graduates , pre-university studies, academic studies (e.g. degree course, graduation mark) and further experiences made during studies (e.g. foreign languages and IT skills, internships, study experiences made abroad and work experiences). The pre-survey information is mainly based on detailed administrative data from Universities archives and on a preliminary survey conducted close to the end of the university experience. In order to understand if a mode effect was present, AlmaLaurea firstly performed a PS subclassification and then , in case of bias, in its public reports adopted the adjustment method proposed by Lee (2006).
3. M
ETHODOLOGYThis section begins by briefly introducing the propensity score subclassification method adopted by AlmaLaurea and then to the proposed multivariate approach and its notation.
3.1. Propensity Score subclassification
In Rubin’s potential outcome approach (Rosenbaum and Rubin, 1983), the aim of the resulting propensity score is to balance non-equivalent groups on observed pre-treatment covariates in order to reduce bias in causal effect estimation. Rubin demonstrated that, having in hand pre-treatment information that characterizes units under analysis, it is possible to create groups of units with similar pre-treatment characteristics. These groups are, therefore, theoretically independent from the treatment. Within these groups, the target variable is compared among those who have undergone the treatment and those who have not. Let’s consider a population of
n
units and denoteT
the assignment-to-treatment indicator vectorT
=
(
0 /1
)
. More formally, in Rubin’s perspective, each uniti
has two potential outcomes, the potential control outcomeY 0
i( )
under the control conditionT 0
i( )
and the potential treatment outcomeY
i( )
1
under treatment condition . After treatment, only one of the two potential outcomes is observed, the outcome corresponding to the treatment condition of thei
unitY
i,obs=
T
iY
i( )
1
+
(
1
-
T
i)
Y
i( )
0
, withobs i
Y
, as the observed outcome for thei
unit. As it is not possible to observe both potential outcomes (missing data problem), the causal effect for each unit, defined asτ
i=
Y
i( )
1
-
Y
i( )
0
could not be determined. Thus, at the group level, only the expected treatment outcomes for the treated,E
(
Y
i( )
1
T
i=
1
)
and the expected control outcomes for the untreated,E
(
Y
i( )
0
T
i=
0
)
can be observed. Therefore, the simple difference in observed groups means defined as in equation (1) i obs i obs i T i T T TY
Y
N
1 1 ,N
0 0 ,1
1
ˆ
τ
∈ ∈=
∑
−
∑
(1)is a biased estimator for the average treatment effect. In equation (1)
T
1 indexes the set for the treated unitsT
0, the set for the control units,N
T1 is the number of treated andN
T0the number of control units. The Propensity Score is a very popular technique that overcomes the missing data problem. In particular, with the PS defined as the conditional probability of treatment exposure given the observed covariatesX
that ise X
( )
=
Pr
(
T
=
1
X
)
, units under different treatment conditions are comparable if their probabilities to get assigned to one treatment given the observed covariates are the same. Once obtained the estimated propensity score, PS subclassification can be used to find groups of treated-comparison units with similar characteristics. In particular, the estimated PS is used for subclassifying all units intoQ
homogeneous strata being demonstrated that treated-comparison cases within each balanced stratum are homogeneous on both the PS and the observed traits.3.2. The Multivariate Approach to measure the interview mode effect
The multivariate approach, as the PS subclassification, helps to measure the interview mode effect controlling for selection bias. The key aspect underlying the proposed method, involves measuring and testing global imbalance under non-experimental conditions. In the following of the present section a brief description of the GI measure and its related test is provided . The GI measure ( D'Attoma and Camillo, 2011) is computed as in equation (2):
Q T J tj t j t j
b
GI
Q
k k
2 1 1 . .1
= ==
∑ ∑
(2)
In equation
Q
denotes the number of pre-treatment covariates,T
denotes the number of treatment levels,J
Q denotes the set of all categories ofQ
,b
tjis the number of units with categoryj J
∈
Q in the treatment groupt T
∈
,
k
.t is the group sizet T
∈
, and
k
.j is the number of units with categoryj J
∈
Q. The GI measure 3 is the result of using Conditional Multiple Correspondence Analysis (MCA) (Escofier, 1988) to quantify the between-groups inertia4. In fact, when dependence among categorical pre-treatment covariates (X
) andT
is outside the control of researchers, displaying the relationship among them on a factorial space represents a first step for discovering the hidden relationship. But, in the presence of dependence amongX
andT
, any descriptive factorial analysis may exhibit this link. Commonly, the problem of the factorial decomposition of the variance related to the juxtaposition of theX
matrix and
T
is faced within the MCA framework. With reference to MCA, the structure of the data matrix eigenvectors and eigenvalues decomposition process, could be strongly influenced by the presence of an external conditioning variable (i.e.T
). Hence, a conditional analysis is used in order to isolate the part of the variability of theX
-space due toT
. With reference to the Huygens’ inertia decomposition of total inertia (I
T) as within-groups (I
W) and between-groups (I
B), Conditional MCA consists in the factorial decomposition of the within-group inertia. The key result of using Conditional MCA is represented by the quantified between groups inertia that represents the measure of global imbalance in data. Then, to determine the significance of the detected imbalance, an hypothesis test is performed. The null hypothesis of no dependence amongX
andT
is specified as in equation (3):W T
H I
0:
=
I
(3)On the basis of the asymptotic distribution function of
I
B ( Estadella et al., 2005) expressed as in(4):
3 For a more comprehensive treatment of the development of GI and its related test see Camillo and
D'Attoma (2010) and D'Attoma and Camillo (2011).
4 The term inertia is used by analogy with the definition in applied mathematics of moment of inertia
which stands for the integral of mass times the squared distance to the centroid (Greenacre, 1984).
(T )(J ) B
I
nQ
2 1 1 ,αχ
− −≈
(4)the interval of plausible values for GI is defined as in equation (5): ( )( )T - J
-GI
nQ
2 1 1 ,0,
χ
α
∈
(5) withn
as the sample size,Q
as the number of pre-treatment covariates andχ
( )( )2T -1 J -1 as the chi-square value with( )( )
T -1 J-1
degrees of freedom. If the measured GI is outside the interval, thenthe null hypothesis is rejected and data are deemed unbalanced. Then, a three step strategy for estimating the effect of the interview mode on answers in an unbiased way is provided.
1. Measuring imbalance via the GI measure and testing the extent to which it is
significant.
In other words: are differences between CATI and CAWI groups such that a simple comparison of their answers may be biased by self selection? Such differences are measured in terms of between-group inertia, which represents the global measure of imbalance in the data. The advantage of this GI measure stems from the
consideration that the most common variable-by-variable imbalance measures, such as differences in means or in proportions between treatment groups, might fail in detecting imbalance since they do not take into account any interactions among variables. Then, within data that demonstrate the presence of imbalance, proceed to the second analytic step.
2. Executing a cluster analysis (CA) that identifies homogeneous groups on the basis of the continuous multiple correspondence analysis (MCA) coordinates. Using MCA coordinates before clustering exploits the advantage of working with continuous variables (MCA coordinates) rather than categorical covariates (original variables), that need to be treated with unusual metrics.
3. Assessing the balance within step 2’s resulting clusters, computing local effects within balanced groups and pruning observations in unbalanced clusters. The interview mode effects are estimated within each balanced cluster, being sure that they are unbiased from self-selection given the observed covariates.
4. E
MPIRICALR
ESULTS4.1. Propensity Score subclassification AlmaLaurea results
AlmaLaurea adopted a PS subclassification method to understand if an interview mode effect was present. Here, for the sake of simplicity, only results concerning 26997 2nd level graduates interviewed in 2008 one year on from graduation are reported. Of these, 15749 (58:3%) have been contacted via CAWI method and the remaining ones via CATI method. In order to estimate the
PS, a logit model was specified5 by AlmaLaurea analysts, where the interview mode indicator variable is expressed as function of the observed pre-treatment covariates6
.
TABLE 1
Variable-by-variable balance checking: pre-treatment covariates vs interview mode
Pre-treatment covariates Chi-Square Value Prob Balance
Internet surfing skills 2236.83 <.0001 No
Willingness to accept mobility 2169.69 <.0001 No
Attended class on a regular basis 2277.03 <.0001 No
Intended to porsue postgraduate studies 2274.02 <.0001 No
Command of spoken English 2067.13 <.0001 No
Command of written English 2172.37 <.0001 No
Not yet graduated 2210.40 <.0001 No
Did the student study abroad? 2288.79 <.0001 No
Social class 2099.60 <.0001 No
Pure-hybrid graduates 2275.39 <.0001 No
Regular attendance during studies 185.94 <.0001 No
Educational qualifications of parents 2179.71 <.0001 No
Gender 0.0072 0.9323 Yes
Degree-course group 598.86 <.0001 No
Geographical area of the University 172.72 <.0001 No
Geographical area of residence 112.99 <.0001 No
Age at graduation ( in class) 451.02 <.0001 No
Graduation Mark (in class) 57.02 <.0001 No
Thereafter, a subclassification on the estimated PS was performed. This was first done sorting units by the estimated PS and partitioning units in a predefined number of strata, where each stratum had approximately the same number of units. AlmaLaurea analysts have first divided the estimated range of propensity score in 5 strata7. Afterwards, being the common support 8 not satisfied in one of them, they divided the range of the estimated PS in 4 strata. One of these resulted unbalanced (table 3) and units within it were discarded.
5 The logit of the estimated PS,
( )
( )
T( )
e X f X -e X log 1 α β = + , also called linear propensity score, is more frequently used than PS itself since the logit is typically more linearly related to the outcome of interest than the PS (Steiner and Cook, 2011)
6 More details on the estimated logistic regression model can be found in Camillo et al. (2011), pp. 5-9. 7 Based on Cochran (1968) results one may expect a 90% bias reduction for each of the 18 covariates
when a subclassification at the quintile of the distribution of the propensity score is performed.
8 The region of common support is defined as those values of e X that have a positive density within
( )
the T 1= and T 0= observations.
TABLE 2
Balance within Propensity Score Strata
Stratum CAWI CATI Total Balance
1 1248 5501 6749 No
2 2810 3939 6749 Yes
3 3372 3378 6750 Yes
4 3818 2931 6749 Yes
Total 11248 15749 26997
Within each balanced stratum, the effect of the interview mode on the outcome was estimated by calculating the difference, for each target variable, between the observed and the expected distribution in case of absolute independence ( i.e. independence between type of interview and target variable) (Camillo et al., 2011). Obtained results will be presented in subsection 4.3.
4.2. Multivariate approach results
On the 26997 2nd level graduates the multivariate approach is also applied to measure the influence of the interview mode on their answers. Due to the possible presence of self-selection the ultimate intent is to find balanced groups of respondents, whose pre-treatment characteristics (i.e., career, family, social class, geodemographics information, expectations on the future after graduation) are free of any dependence from the kind of undergone treatment (CAWI/CATI). In order to find balanced groups, the 18 categorical pre-treatment covariates used by AlmaLaurea (table 2) are considered. Two of the 18 covariates considered are previously discretized (age and graduation mark). From table 2 it emerges that dependence among interview mode status and baseline covariates exists, since across all traits the chi-square, with the exception of gender, results always significant. Therefore, assessing if the interview mode causes an effect on answers requires to disentangle the effect of the interview mode from the influence of the respondents characteristics. The expected result is that such differences in characteristics might explain differences in answers that are distinct from the contribution of the interview mode, although the expected direction of the bias is not obvious. With this as context, we begin by implementing the three step analysis by computing the GI measure for this data set. As reported in table 4 the resulting value of GI , 0.0531, can be interpreted as demonstrating the presence of imbalance in data.
TABLE 3 Global balance checking
N N(T=1) N(T=0) GI Interval Balance
26997 15749 11248 0.0531 (0;1.28E-08) No
In fact, the GI measure falls in the critical region, thereby demanding adjustment in order to estimate the presence of an interview mode effect that is not biased by self-selection. The second step in the proposed analytic process is to use CA to identify homogeneous groups on the basis of the MCA coordinates. CA is carried out on the SAS system employing Ward’s algorithm on the MCA coordinates9 where the proximity between two groups is taken to be the square of the
9 The MCA coordinates were obtained using as input the 18 categorical pre-treatment covariates (table 2)
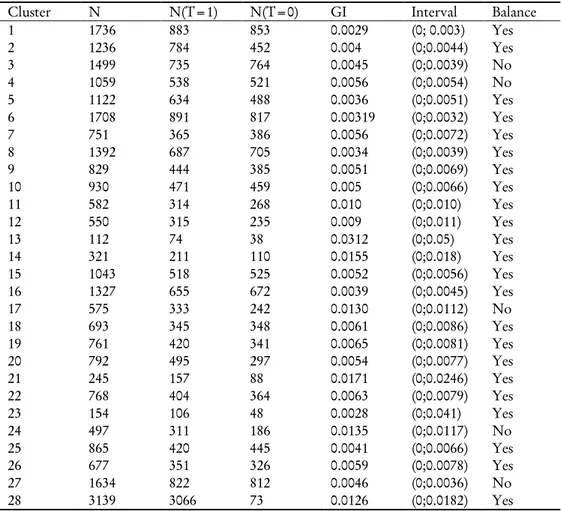
Euclidean distance between them. Different cluster solutions are examined with the aim of identifying which one achieves balance in an acceptable number of clusters. We move from a 2-cluster partition to a 34-2-cluster partition. Finally, the 28-2-cluster solution is retained because it provides balance within a suitable number of clusters with fewer pruned observations (around 19%), compared to larger cluster solutions. With the 28-cluster solution, balance within each group is tested, again using the computation of the GI and considering whether it falls in the critical region, as described in the prior step10. Five of the clusters (table 5) result in having unbalanced characteristics by the GI measure. In total these five clusters represent about 19 percent of the observations (5264 units) being excluded from the third analytic step.
TABLE 4 Balance by clusters
Cluster N N(T=1) N(T=0) GI Interval Balance
1 1736 883 853 0.0029 (0; 0.003) Yes 2 1236 784 452 0.004 (0;0.0044) Yes 3 1499 735 764 0.0045 (0;0.0039) No 4 1059 538 521 0.0056 (0;0.0054) No 5 1122 634 488 0.0036 (0;0.0051) Yes 6 1708 891 817 0.00319 (0;0.0032) Yes 7 751 365 386 0.0056 (0;0.0072) Yes 8 1392 687 705 0.0034 (0;0.0039) Yes 9 829 444 385 0.0051 (0;0.0069) Yes 10 930 471 459 0.005 (0;0.0066) Yes 11 582 314 268 0.010 (0;0.010) Yes 12 550 315 235 0.009 (0;0.011) Yes 13 112 74 38 0.0312 (0;0.05) Yes 14 321 211 110 0.0155 (0;0.018) Yes 15 1043 518 525 0.0052 (0;0.0056) Yes 16 1327 655 672 0.0039 (0;0.0045) Yes 17 575 333 242 0.0130 (0;0.0112) No 18 693 345 348 0.0061 (0;0.0086) Yes 19 761 420 341 0.0065 (0;0.0081) Yes 20 792 495 297 0.0054 (0;0.0077) Yes 21 245 157 88 0.0171 (0;0.0246) Yes 22 768 404 364 0.0063 (0;0.0079) Yes 23 154 106 48 0.0028 (0;0.041) Yes 24 497 311 186 0.0135 (0;0.0117) No 25 865 420 445 0.0041 (0;0.0066) Yes 26 677 351 326 0.0059 (0;0.0078) Yes 27 1634 822 812 0.0046 (0;0.0036) No 28 3139 3066 73 0.0126 (0;0.0182) Yes
During the final stage of the procedure, the effect of the interview mode on each outcome variable is estimated. Being all outcomes categorical, for each balanced group the observed frequency of each answer is compared to the corresponding expected frequency under the hypothesis of independence between the answer and the interview mode.
10 The procedure to check and test balance is completely automatic, see Camillo and D'Attoma (2012).
4.3. Comparison of results
Within AlmaLaurea PS strata and our balanced clusters, it is possible to evaluate discrepancies existing in responses given by graduates interviewed with different modes. Such discrepancies are calculated taking the difference, for each target variable, between the observed and theoretical frequencies under the hypothesis of independence between interview mode and the target variable. Both methods (PS subclassification and multivariate approach) provided very similar results (table 6). The resulting effects of interview mode on the response rates to the specific categories of each outcome variable were generally found to be lower than two percentage points in terms of deviation. Such a result confirms that the two data collection mode did not generate high differences in terms of responses. There were only two exceptions to this finding: the first case refers to the contract type question and the second to the question seeking employment. For the sake of simplicity, only results concerning the aggregate effect of the interview mode on contract type11 are reported . The aggregate observed frequencies are obtained as the sum of the observed frequencies within clusters (or strata). Differences between observed and expected frequencies have to be interpreted as an aggregate measure of the mode effect. As reported in table 6 the effects of interview mode on the answers are equal or greater than two percentage points12.
11 The Contract Type variable applies only to a subset of the 26997 2nd level graduates, because not all
second-level graduates are in work. For percentages of graduates by employment status refer to Camillo et al. (2011).
12 The differences grater than 2± percentage points are considered high because they are grater than
the percentage commonly accepted as sampling error in the design of survey data.
TABLE 5
Differences between observed and expected frequencies of responses to the question “contract type”
Outcome Ps Approach Multivariate Approach
Contract Type Observed Distribution Differences Differences Differences Differences (column
rates) (%) (%) (%) (%)
CAWI CATI CAWI CATI
Permanent employment 28.8 -0.543 0.462 -0.776 0.477 Work/training 7.1 1.598 -1.358 1.505 -0.925 Apprenticeship 9.1 0.329 -0.279 0.204 -0.126 Temporary work 2.6 0.235 -0.199 0.320 -0.196 Project work 17.0 1.083 -0.921 1.399 -0.860 Occasional collaboration 3.5 -0.140 0.119 -0.098 0.060
Socially useful work 0.1 0.064 -0.055 0.080 -0.049
Intermittent work 0.5 0.063 -0.053 0.096 -0.059 Job sharing 0.0 0.027 -0.023 0.031 -0.019 Auxiliary temporary work 0.3 0.181 -0.154 0.192 -0.118 Other fixed-term contract 20.2 -3.102 2.638 -3.136 1.927 Self-employed 5.5 -1.056 0.898 -1.038 0.638 Working without any contract 3.6 0.272 -0.231 0.237 -0.146 Provision of services 1.4 0.842 -0.716 0.817 -0.502 Professional Integration Plan 0.2 0.071 -0.060 0.068 -0.042 Joint partnership 0.2 0.052 -0.044 0.067 -0.041 Non response 0.2 0.026 -0.022 0.032 -0.020
As reported in table 6, CATI and CAWI operate in opposite directions: where CAWI underestimates the expected frequencies, the CATI overestimates them and viceversa. Those differences could be attributable to the fact that the question about the type of contract could be perceived in different ways. In fact, CATI involves an oral and long list of categories; whereas, CAWI allows respondents to analyze and compare each category in the due time. Furthermore, using the word other to list the fixed term contract (table 6) might generate a wrong perception. Especially with the CATI method it might be intended as a residual category. In sum, both methods support the conclusion that answers to the question “contract type” are affected by the interview mode. For such reason it is justifiable that AlmaLAurea in its public report adopted the
adjustment proposed by Lee (2006).
5. D
ISCUSSION ANDC
ONCLUSIONSThe main aim of this work has been to apply the multivariate method to measure the interview mode effect controlling for selection bias and compare its result to the results generated by PS subclassification. Such an approach allows to understand if observed differences in the answers are attributable to self selection or just to the interview mode without specifying any model. We worked through the use of the multivariate approach with an application to AlmaLaurea 2008 survey on 2nd level graduates’ condition one year from graduation that adopted a mixed data collection strategy. In conducting such survey AlmaLaurea has to deal with the strong growth in the reference population. Consequently, the need to reduce survey costs and duration has led to the introduction of a mixed data collection strategy (CATI and CAWI). The adoption of such mixed strategy has been undoubtedly facilitated by the increasing availability of email addresses. However, on one hand the mixed strategy led to a reduction of data collection costs; on the other hand, the use of the two data collection modes required a method to control for two sources of bias in answers: the self-selection effect and the mode effect. In this work two alternative methods to measure the interview mode effect controlling for self-selection were discussed and compared: the multivariate approach (Camillo and D'Attoma, 2010) and the PS subclassification applied by AlmaLaurea, and both led to similar results. The multivariate method was applied in order to avoid the PS model dependence problem and consists in a cluster-based procedure to find balanced groups whose pre-treatment characteristics are free of any dependence from the kind of the undergone treatment according to the GI measure and its related test. Therefore, within these groups of respondents any observed difference in the study outcome (e.g. the occupational status) among treatment groups could be attributed to the interview mode. We report two main findings corresponding to the research question we posed initially. First, for what concerns the contract type target variable, respondents self-select in one of the two interview modes. Second, the interview mode affects answers all the other characteristics of respondents being equal. The innovative aspect of the control system implemented by AlmaLaurea is that it allows to disentangle the mode effect from self selection effect and thus, to understand if estimates have to be adjusted. In this way bias is reduced, or eliminated, also when a mixed data collection mode is adopted.
Looking only to final results does not allow to confirm the superiority of the multivariate approach with respect to the propensity score approach. But, we can support its methodological superiority with some issues that we highlight in the rest of the present section.
For what concerns the methodological issue, we address that the multivariate approach overcomes the PS model dependence problem and facilitates the control of selection bias being completely model free. Especially when working with huge databases, as in the AlmaLaurea case, the use of the multivariate approach avoids problems that occur when models do not fit data.
As discussed in a previous work (Peck et al., 2012), we believe that the approach has a promise.
The cluster-based approach is an improvement over conventional propensity score methods, which require subjective judgment in several areas: the specification of model used to estimate the propensity scores, the choice of covariates and interaction terms or higher order terms to be included in the model, and the matching strategy, which can take many forms. As reported in Steiner and Cook (2011), “the strong ignorability assumption might be violated if the propensity score model is not correctly specified, even if all covariates for establishing strong ignorability are observed” . Regarding the many possible matching strategies, common practice is to use five bins (Cochran, 1968), but if balance is not achieved, then dividing the propensity score into more bins
still may not produce any greater balance. In contrast, our strategy groups each observation in the treatment group with those in the comparison group whose observed characteristics are similar according to a predefined distance measure. In turn, estimated mode effects are not biased in a systematic way. Such a conclusion is enhanced by the observation that the GI measure is a global measure of comparability between groups, objective because it is based on the concept of observed variance in the data, among observed baseline covariates (considered simultaneously) and the mode indicator. It is also enhanced by use of the multivariate imbalance test that allows determining the imbalance’s significance, thereby overcoming standard variable-by-variable test of balance that do not consider interaction among variables. Furthermore, cluster analysis makes it possible to use all available information independently from the number of variables and their nature, categorical or continuous. Propensity score subclassification solves in part this problem at the cost of incrementing subjective choices (i.e. propensity score estimation method, model specification). In addition, in the AlmaLaurea case here presented, the cluster-based multivariate approach discards less units (around 19%) than PS subclassification (around 25%). Finally, but not less important, another strength of the cluster-based method is that it captures heterogeneity in the effects, which cannot be done by matching or PS adjustment. Average treatment effects often obscure the changing effects within heterogeneous populations, the cluster-based approach capitalizes on this heterogeneity and allows for impact estimates within subgroups that might otherwise fail to be easily recognized.
REFERENCES
R.E.BARLOW,D.J.BARTHOLOMEW,J.M.BREMNER,H.BRUNK (1972). Statistical Inference Under
OrderRestrictions. John Wiley & Sons, New York.
J.BETHLEHEM (2010). Selection in Web Surveys. International Statistical Review, 78(2), pp. 161–188.
J.M. BORKAN (2004). Mixed Methods Studies: A Fundation for Primary Care Research. Annals of
Family Medicine, 2(1), pp. 4-6.
F.CAMILLO,V.CONTI,S.GHISELLI (2011). Integration of different data collection techniques using
the propensity score. AlmaLAurea Working Papers n 4.
F.CAMILLO,I.D’ATTOMA (2010). A New Data Mining Approach to Estimate Causal Effects of Policy Interventions. Expert Systems with Applications, 37(2010), pp. 171-181.
F.CAMILLO,I.D’ATTOMA (2012). %GI: A SAS Macro for Measuring and Testing Global Imbalance of
Covariates within Subgroups. Journal of Statistical Software, 51, Code Snippet 1, pp. 1-19.
A. CAMMELLI, G. ANTONELLI, F. CAMILLO, A. DI FRANCIA, S. GHISELLI, M. SGARZI (2011).
Graduates’ employment and employability after the “Bologna Process” reform. Evidence from the Italian experience and methodological issues. AlmaLAurea Working Papers.
W.G. COCHRAN (1968). The Effectiveness of Adjustment by Subclassification in Removing Bias in
Observational Studies. Biometrics, 24, pp. 205–213.
observational studies. Expert Systems with Applications, 38, pp. 3451-3460.
E.D.DE LEEUW (2005). To mix or not to mix data collection modes in surveys. Journal of Official
Statistics, 21, pp. 233–255.
D.A.DILLMAN,R.L.SANGSTER,J.TARNAI,T.H.ROCKWOOD (1996). Understanding Differences in
People’s Answers to Telephone and Mail Surveys. New Direction for Evaluation. 70, pp. 45–61.
B.ESCOFIER (1988). Analyse des correspondances multiples conditionelle. In: E. Diday (Ed.), Data Analysis and Informatics. North Holland, Amsterdam: Elsevier Science, pp. 333–342.
J.D.ESTADELLA,T.ALUJA,S.THIÒ-HENESTROSA (2005). Distribution of the inter and intra inertia
in conditional MCA. Computational Statistics. 20(3), pp. 449–463.
M.J.GREENACRE (1984). Theory and Applications of Correspondence Analysis. London: Academic
Press.
D.E.HO,K. IMAI,G. KING,E. A. STUART (2007). Matching as nonparametric pre-processing for
reducing model dependence in parametric causal inference. Political Analysis, 15, pp. 199-236.
B.JANSSEN (2006). Web data collection in a mixed mode approach: an experiment. Proceedings of Q2006. European Conference on Quality in Survey Statistics.
G.KING,L.ZENG (2006). The Dangers of Extreme Counterfactual. Political Analysis, 14, pp.
131-159.
F.KREUTER,S.PRESSER,R.TOURANGEAU (2008). Social desirability bias in CATI, IVR, and Web
Surveys. The effects mode and question sensitivity. Public Opinion Quarterly, 72(5), pp. 847–865.
S.LEE (2006). Propensity Score Adjustment as a Weighting Scheme for Volunteer Panel Web Survey.
Journal of Official Statistics. 22(2), pp. 329–349.
M. MORA (2011). Understanding the pros and cons of mixed-mode research. Quirk’s Marketing
Research Review, 50 .
L.R.PECK,F.CAMILLO,I.D’ATTOMA (2010). A Promising New Approach to Eliminating Selection
Bias. The Canadian Journal of Program Evaluation, 24(2), pp. 31-56.
L.R.PECK,I.D’ATTOMA,F.CAMILLO,C.GUO (2012). A new strategy for Eliminating Selection Bias
in Non-Experimental Evaluations: The Case of Welfare Use’s Impact on Charitable Giving. Policy
Studies Journal, 40(4), pp. 601-625.
P.R.ROSENBAUM,D.B.RUBIN (1983). The Central Role of Propensity Score in Observational Studies
for Causal Effects. Biometrika. 70, pp. 41–55.
M.SCHONLAU,R.D.FRICKER,M.N.ELLIOT (2002). Conducting research survey via email and the web. Rand Corporation.
and the Use of Propensity Score. Rand Corporation.
J.VANNIEUWENHUYZE,G.LOOSVELDT,G.MOLENBERGHS ( 2010). A Method for Evaluating Mode Effects in Mixed-Mode Surveys. Public Opinion Quartely. 74(5), pp. 1027–1045.
P.M.STEINER,D.COOK (2011). Matching and Propensity Scores. In Little, T.D. (Ed.), The Oxford
Handbook of Quantitative Methods, Oxford: Oxford University Press.
H. F. WOLTMAN, A. G. TURNER, J. M. BUSHERY (1980). A comparison of three Mixed-Mode Interviewing Procedures in the National Crime Survey. Journal of the American Statistical
Association, 75(371), pp. 534–543.
K. B. WRIGHT (2005). Researching Internet-Based Populations: Advantages and Disadvantages of Online Survey Research, Online Questionnaire authoring software packages, and web survey services. Journal Of Computer-Mediated Communication, 10(3).
SUMMARY
Measuring and testing the interview mode effect in mixed mode surveys
Many studies are showing an increased tendency to use more than one data collection mode for a particular survey. However, mixed data collection modes may influence responses given by interviewees and require researchers to verify if differences in responses, when present, are ascribable to the type of data collection mode. Often, random assignment is not feasible and requires researchers to solve an additional and not negligible problem, namely to verify if differences in responses are ascribable to the self selection or to the type of data collection mode being used. The aim of the present paper is to measure the mode effect on the answers using a new data driven multivariate approach, that allows to disentangle the interview mode effect on answers from the effect of self selection. We will work through the use of the new multivariate method with AlmaLaurea case concerning the evaluation of two different data collection methods: the CAWI (Computer Assisted Web Interviewing) and the CATI (Computer Assisted Telephone Interviewing). As with any new statistical method, the success of this method depends on its efficacy in relation to that of the existing methods. Therefore, results of the multivariate approach will be compared to the Propensity Score method that AlmaLaurea usually applies to identify the presence of an interview mode effect. Both methods produce similar results.