UNIVERSITY
OF TRENTO
DEPARTMENT OF INFORMATION AND COMMUNICATION TECHNOLOGY
38050 Povo – Trento (Italy), Via Sommarive 14
http://www.dit.unitn.it
WIDEBAND COMMUNICATION SYSTEM SENSITIVITY TO
QUANTIZAZTION NOISE
Antonio Moschitta, Dario Petri
June 2004
Wideband Communication System Sensitivity to Quantization Noise
Antonio Moschitta, Dario Petri
Dipartimento di Ingegneria Elettronica e dell’Informazione, Università degli Studi di Perugia Via G. Duranti, 93, 06125 Perugia, Italy
Phone: (+39) 0755853634 Fax: (+39) 0755853654 e-mail: [email protected]
Abstract – The performances of A/D converters are usually character-ized in their granular region, by adopting amplitude limited sine-wave testing signals. However, some applications, like digital telecommuni-cation systems, often require the conversion of signals which noticea-bly differ from sine-waves and may introduce ADC overloading phe-nomena. In this paper, the A/D conversion of Gaussian distributed signal is investigated, both for PCM and Sigma-Delta converters. Then, the effects of quantization noise upon the behavior of a Digital Communication System are considered. By extending previous results, a model is introduced, which describes the BER performance of an OFDM system also in presence of overloading quantization noise, both for PCM and Sigma-Delta A/D converters.
Keywords – A/D converters, Testing, Direct Digital Modulation, Or-thogonal Frequency Division Multiplexing.
I. INTRODUCTION
Most of the commonly used ADC characterizing procedures involve the usage of sine wave stimuli, whose amplitude range does not usu-ally saturate the converter under test [1]. However, some application fields may require the conversion of signals whose properties noticea-bly differ from the sine wave ones and saturate the ADCs. An exam-ple are Digital Communication Systems (DCSs) like Orthogonal Fre-quency Division Multiplexing (OFDM) and Code Division Multiple Access (CDMA), which generate Gaussian distributed modulated waveforms [2][3]. Such systems are usually implemented by means of Direct Digital Modulation (DDM), a technique that requires the A/D conversion of the modulated waveforms in the receiver [4]. Moreover, in order to minimize the quantization noise power, the ADCs dynamic range must be properly matched to the input signals, and overloading noise is usually present. In such a case, the test of ADCs by means of Gaussian stimuli may provide more useful results than the traditional sine wave granular noise test.
This paper is focused on the effects of PCM and Sigma-Delta (Σ∆) conversion on the overall performance of an OFDM system. At first, the ADC performance is evaluated in terms of Signal to Noise and Distortion Ratio (SINAD). At this regard, Σ∆ converters look as a promising choice for DDM implementation, because they achieve a very high SINAD by combining noise shaping with oversampling [5]. Moreover the feedback topology renders Σ∆ converters robust to the internal ADC non-linearity. In particular, Σ∆ conversion with low oversampling ratio (OSR) is considered. In fact, when wideband DCSs are considered, like Terrestrial Digital Video Broadcasting (DVB-T) or Universal Mobile Telecommunication System (UMTS), a large OSR may require an exceedingly high sampling rate [2],[3]. Section III of this paper analyzes also the effects of quantization noise upon the OFDM BER performance. In fact, while SINAD conven-iently describes the behavior of a standalone ADC, the performance of
a DCS is better described by the bit error rate (BER), which depends on the interaction between the receiver, the useful signal, and the noise sources. In order to analyze the OFDM BER performance as a func-tion of quantizafunc-tion noise, a linear model, based upon the granular noise approximation, has been presented in [4] for both PCM and
Σ∆converters. In this paper, the model is extended to keep into ac-count a moderate amount of ADC overloading noise, thus providing a reliable estimate of system BER performance in a practical situation. Such a development is relevant, because, in a real environment, the Signal to Noise Ratio (SNR) at the input of a DCS receiver may change in time due to fading phenomena [6]. Finally, the range of va-lidity and the limits of the presented model are also discussed.
II. THE SIMULATED OFDM SYSTEM
OFDM is a multicarrier technique [7], adopted for various DCS stan-dards, like DVB-T, Digital Audio Broadcasting (DAB), and Asyn-chronous Digital Subscriber Line (ADSL), where it is known as Digi-tal Multi Tone (DMT) [8],[9]. Multicarrier systems split data among a large number of carriers, in order to transmit at a very low symbol rate. Coupled with the channel coding [2], such a technique is robust to channel impairments, like multipath and fading. The OFDM modula-tion is obtained by applying an Inverse Fast Fourier Transform to a sequence of QAM phasors, followed by a D/A conversion [2]. The receiver, after an A/D conversion, digitally demodulates the incoming signal throughout a Fast Fourier Transform (FFT). According to the Central Limit Theorem, an OFDM signal may be modelled as a Gaussian distributed stochastic process, and its power spectrum tends to be brick-wall shaped.
Fig.1 shows the layout of the OFDM system considered in this paper. It employs 2048 QAM carriers, of which only 1705, the closest to the signal center frequency, are active [2],[4]. Such a solution, common in practical systems, reduces the interference on adjacent channels. The transmitter output is a band-pass modulated signal, centered around the π/2 digital frequency, and up-sampled by a factor OSR. The next block models an Additive White Gaussian Noise (AWGN) channel, whose parameters may be tuned to achieve an arbitrary Signal to channel Noise Ratio (SNR).
The receiver may operate a b bit PCM or a Σ∆ band-pass A/D conversion prior to digital processing [4]. In particular, a sin-gle bit band-pass Sigma-Delta converter, based on a first or-der loop, has been simulated. The ADC output is then con-verted to the base-band and down-sampled by a factor OSR. Finally, after the FFT demodulation, the BER is estimated by comparing the received symbols with the transmitted ones.
III. ANALYSIS RESULTS
The OFDM system described in the previous section has been ana-lyzed by means of both simulations and theoretical modelling. The following subsections are focused on PCM and Sigma-Delta A/D conversion respectively.
3-1. PCM converters
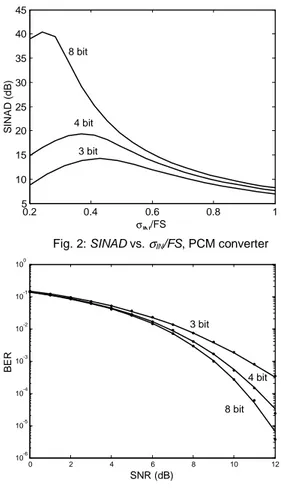
The behavior of a b bit PCM, fed with a Gaussian distributed signal, has been considered, in order to find the optimal matching between the ADC Full Scale FS and the input signal standard deviation σIN. The results of this analysis, performed by carrying on software simula-tions, are shown in Fig.2, where SINAD is reported as a function of the ratio σIN/FS for various converter resolutions. Each curve has a maxi-mum, resulting from a trade-off between granular and overload errors. In fact, granular error power grows with FS, while the overload one grows with σIN. A theoretical exact model, derived in [9], shows a very good agreement with PCM simulation results.
The PCM has been considered also as a part of the OFDM receiver, and the overall BER performance has been analyzed in presence of both channel and quantization noises. A linear model has been intro-duced in [4] to estimate the BER when overload effects are negligible. This model, derived under the assumption that the noise at the output of the FFT demodulator is Gaussian distributed, shows a very good agreement with simulation results when the PCM operates in its granular region. However, when optimal PCM dynamic range is used, the linear model does not keep into account overloading contributions to the overall quantization noise power, thus underestimating the BER. The granular noise model has then been generalized, by assuming that a limited amount of overload does not affect the statistical properties of noise at the output of the FFT demodulator, thus obtaining, (see the appendix): + = A SNR N n N erfc BER A B 1 2 1 , (1) where ) / ( ) / 1 1 ( FS SINAD SNR A IN σ +
= , N is the total number of OFDM carriers, NA is the number of active carriers, nB is the number of bits conveyed by a QAM symbol, and σIN/FS is referred to the PCM input signal, that is the OFDM signal corrupted by channel noise. It should be also noticed that, for PCM converters, SINAD can be calculated by means of theoretical analysis [10].
Fig. 3 shows BER vs. SNR simulation results and theoretical estima-tions, obtained by using the optimal matching between the PCM FS
and the dynamic range of the ADC input signal, according to Fig. 2. It can be seen that the extended model shows a very good agreement with simulations.
The accuracy of (1) has been evaluated by comparing the predicted
BER with simulation results, for various levels of quantization noise.
In particular, the ratio between the predicted BER and the simulation estimate has been evaluated as a function of σIN/FS, for an OFDM system operating at SNR=10 dB. Under such condition of practical interest, quantization noise is not negligible, with respect to channel
Fig. 2: SINAD vs. σIN/FS, PCM converter
0.2 0.4 0.6 0.8 1 5 10 15 20 25 30 35 40 45 σIN/FS S INAD (d B ) 3 bit 8 bit 4 bit
Fig. 3: PCM dynamic range optimized to input signal power. The continuous line represents the analytic model (1), while the dots represent simulation results.
0 2 4 6 8 10 12 10-6 10-5 10-4 10-3 10-2 10-1 100 BE R SNR (dB) 3 bit 4 bit 8 bit QPSK sym bol generator AWGN filter ADC Quantization noise filter FFT d emodulator BER estima tor AWGN Channel OFDM tra nsm itter
OFDM rec eiver IF to BB Mixer
a nd d ownsam pler
Fig. 1: OFDM system block scheme
Fig. 4: Noise distribution (real part) after the FFT demodulator, 3-bit PCM, σIN/FS=0.1 (a) and σIN/FS=1 (b), obtained from a record of 50
OFDM symbols, made of 2048 samples each. The error samples have been normalized to the QAM symbol amplitude. The imaginary noise component shows the same distribution.
-0.50 0 0.5 2000 4000 6000 8000 10000 12000 (a) -1.50 -1 -0.5 0 0.5 1 1.5 500 1000 1500 2000 2500 (b)
noise. In particular, for a 3 bit PCM, the estimation error is about 0 dB when σIN/FS is lower than 0.6. For higher values of σIN/FS, the theo-retical model overestimates the BER, leading to a 2 dB error for
σIN/FS=1. Thus, the model provides accurate results for any practical situation. The loss of accuracy is due to the statistical properties of quantization noise. In fact, when overload is introduced, the PCM quantization noise tends to a multi-modal distribution rather than the uniform one of granular noise. Such a noise propagates throughout the OFDM receiver, leading to a non-Gaussian distributed noise at the output of the FFT demodulation block, despite the presence of the Gaussian distributed channel noise. As shown in Fig.4, this behavior is more evident for increasing overloading levels.
3-2. Sigma-Delta converters
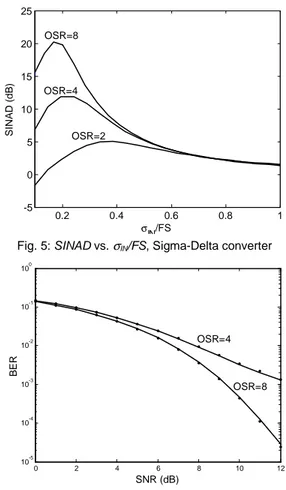
Fig.6 shows the SINAD optimization results obtained for the single bit band-pass Sigma-Delta converter. This time, σIN/FS is the ratio be-tween the ADC input standard deviation and the full scale of the Σ∆ inner PCM. By comparing Fig.5 and Fig.2, it can be observed that respect to PCM converters, Σ∆ SINAD is maximized for a lower value of σIN/FS. That’s related to the feedback nature of the Σ∆, which may introduce overload errors even for amplitude limited signals.
As shown in the appendix, the PCM BER model can be extended to the Σ∆ ADC, by keeping into account noise shaping effects. By as-suming that the Σ∆ quantization noise is locally white with respect to individual carriers, the BER of the i-th OFDM carrier may be ex-pressed by , 1 2 1 2 1 + = − i B A i B SNR N n N erfc BER (3)
where Bi=A⋅G⋅|HN(ωi)|2. |HN(ω)| is the Σ∆ noise transfer function,
ωi is the frequency the i-th OFDM carrier, and G is the integral of |HN(ω)|2 over the signal bandwidth. The overall BER is then obtained by averaging (3) across the OFDM signal bandwidth, that is:
∑
− = = 1 0 1 NA i i A BER N BER (4)Eq. (3) implies that for a noise shaping converter the BER perform-ance depends not only on the SINAD, but also on the ADC noise transfer function. Consequently, when comparing A/D converters for DCS applications, SINAD may not be the best characterizing parame-ter.
Fig.6 reports BER as a function of SNR, for a Sigma-Delta converter whose inner PCM FS is optimally matched to the incoming signal power. Due to the topology of Sigma-Delta converters, which uses a non-linear device into a feedback loop, the quantization noise power in presence of overload cannot be easily derived by means of a theo-retical analysis. Consequently, the SINAD simulation results plotted in fig.6 have been used in (3). As for PCM, the extended model provides an accurate BER estimation.
The accuracy of the extended Sigma-Delta BER model has been also evaluated, for an OFDM system operating at SNR=10 dB. In particu-lar, it has been verified that the model does not provides reliable results for OSRs lower than 4. For such a value, the estimation error is negli-gible for the optimal value of σIN/FS, while it quickly grows for higher values of σIN/FS. Such a behavior is due to the higher sensitivity of Σ∆ converters to overloading effects, with respect to PCM converters. It is worth of notice that when overloading noise is present, the Delta model tends to underestimate the BER. This is due to the Sigma-Delta quantization noise, whose properties, as shown in Fig.4, are
no-0.2 0.4 0.6 0.8 1 -5 0 5 10 15 20 25 σIN/FS SINA D ( d B ) OSR=2 OSR=8 OSR=4
Fig. 5: SINAD vs. σIN/FS, Sigma-Delta converter
0 2 4 6 8 10 12 10-5 10-4 10-3 10-2 10-1 100 BE R SNR (dB) OSR=4 OSR=8
Fig. 6: Sigma-Delta dynamic range optimized to input sig-nal power. The continuous line represents the asig-nalytic model (3), while the dots represent simulation results.
Fig. 7: Noise distribution (real part) after the FFT demodulator, single-bit Sigma-Delta, σIN/FS=0.1 (a) and σIN/FS=1 (b), obtained
from a record of 50 OFDM symbols, made of 2048 samples each. The error samples have been normalized to the QAM symbol ampli-tude. The imaginary noise component shows the same distributions. -3 -2 -1 0 1 2 3 0 2000 4000 6000 8000 10000 (a) -2 -1 0 1 2 0 500 1000 1500 2000 2500 (b)
ticeably different from the PCM ones. Simulations show that the ratio between the predicted BER and the BER obtained by means of simu-lations is about –5 dB for σIN/FS=1. Thus, also the Sigma-Delta BER model provides accurate results for practical applications.
IV. CONCLUSIONS
The A/D conversion of Gaussian distributed signals has been investigated, and the effects of PCM and Sigma-Delta conver-sion upon the performances of an OFDM DCS have been ana-lyzed. A model has been presented, which conveniently de-scribes OFDM BER behavior when overload effects are intro-duced. It has been shown that SINAD may not adequately char-acterize the behavior of a noise shaping ADC, when applied to an OFDM DCS. The model accuracy has been evaluated, with respect to both PCM and Sigma-Delta A/D conversion. Further development of the research activity are the extension of the analysis to other DCSs and to other ADC non-idealities.
APPENDIX: DERIVATION OF THE ANALITICAL MODEL FOR THE OFDM BER
As the carriers of an OFDM signal are orthogonal to each other, the overall BER is expressed by
∑
− = = 1 0 1 NA i i A BER N BER (A1)where BERi is the BER of the i-th carrier [7]. According to [6] and [7], the BER of a QPSK modulated carrier, operating on an AWGN chan-nel, may be described by
, 2 1 0 = η B E erfc BER (A2)
where EB is the energy per bit, η0 is the level of the AWGN spectrum
in the useful signal bandwidth, and erfc() is the complementary error function. Eq. (A2) may be used to describe the BER performance of the OFDM carriers, provided that at the output of the FFT demodula-tor the overall noise is white and Gaussian distributed. Simulations show that such condition is verified, as far as deep quantizer overload is avoided. This may be considered a consequence of the Central Limit Theorem, because in the receiver the noise is repeatedly filtered. In order to derive the BER model, EB and η0 have been evaluated at
the output of the quantization noise rejection filter, and their propaga-tion to the FFT demodulator has been analyzed [6],[7]. In particular,
EB is the ratio between the energy of an OFDM symbol and the
num-ber of conveyed bits, which can be expressed by
, 2 B A OFDM B n N OSR N E ⋅ ⋅ ⋅ =σ (A3)
where σOFDM2 and N⋅OSR are the power of the band-pass OFDM
sig-nal and the number of samples in an OFDM symbol respectively. NA is the number of active carriers and nB, which for a QPSK modulation scheme equals 2, is the number of bit transmitted by a single carrier during an OFDM symbol. By assuming that channel noise and quan-tization noise are uncorrelated, the noise level η0 may be expressed by
Q CH η
η
η0= + , where ηCH is the channel noise level, and ηQ is the quantization noise level. The channel noise level is described by
SNR OSR OFDM CH / 2 ⋅ =σ η (A4)
For a flat noise A/D converter, such as a PCM in granular region, ηQ
is described by ) / ( 2 FS SINAD IN IN Q σ σ η = , (A5)
and is equal for all of the OFDM carriers. Eq. (A5) can be obtained by expressing the ADC quantization noise power as the integral across the [-π,π] bandwidth of the noise power spectral density and in terms of SINAD, which is reported a function of the σIN/FS ratio.
The ADC input signal is the sum of the useful OFDM signal and the AWGN. As both signals are white, Gaussian and uncorrelated, the input to the ADC is still a white Gaussian process, and may be ex-pressed in terms of OFDM signal power only, by using the SNR defi-nition. Consequently, (A5) may be rewritten as follows:
(
)
) / ( / 1 1 2 FS SINAD SNR IN OFDM Q σ σ η = + (A6)Eq. (A6) shows that the quantization noise and the channel noise are uncorrelated only for high SNRs. It should be also noticed that ηQ is
minimized when σIN/FS equals the optimal values shown in Fig.2.
By analyzing the signal propagation throughout the receiver, the en-ergy per bit E and the noise level η at the input of the FFT demodula-tor are expressed by E=EB/OSR and η=η0/OSR. By substituting
such results in (A2) and in (A1), and keeping in mind that for PCM converters all carriers show the same BER, equation (2) is obtained. The presented model can be extended to noise shaping converters, by keeping into account the noise transfer function. In particular, the un-filtered noise level ηU can be expressed as
) / ( 2 FS SINAD G IN IN U σ σ η ⋅ = , (A7) where =
∫
BW N d HG | (ω)|2 ω, and BW is the useful signal band-width. By assuming that the ADC noise transfer function HN(ω) is approximately constant across the bandwidth of each OFDM carrier, Eq. (A6) is then replaced by the following
(
)
) / ( / 1 1 | ) ( | 2 2 FS SINAD G SNR H IN OFDM i N Qi σ σ ω η ⋅ + = , (A8)Eq. (A7) expresses the quantization noise level for each OFDM car-rier, whose center frequency is ωi. In particular, for the Σ∆ ADC con-sidered in this paper, |HN(ω)|2=2(1+cos(2ω)).
REFERENCES
[1] “IEEE Standard for terminology and test methods for Analog to Digital Convert-ers,”IEEE std. 1241-2000.
[2] ETS 300 744, “Digital Video Broadcasting (DVB); Framing structure, channel coding and modulation for digital Terrestrial television (DVB-T)”, available on the Internet at www.etsi.org.
[3] T. Ojampera and R.Prasad, “An overview of air interface multiple access for IMT-2000/UMTS,” IEEE Comm.. Mag., no. 9, pp 82-86, 91-5, Sept. 1998.
[4] A. Moschitta, D. Petri, “Analysis of Bandpass Sigma-Delta conversion in OFDM Systems, ” proc. of the 8th IEEE Int. Conf. on Electronics, Circuits and Systems,
Malta, 2-5 September 2001.
[5] S. R. Norsworthy, R. Schreier, G. Temes, Delta-Sigma Data Converters, IEEE press, 1997.
[6] J. G. Proakis, Digital Communications, Mc. Graw Hill, 1983.
[7] I. Kalet, “The Multitone Channel,” IEEE Trans. Communications, vol. 37, no. 2, February 1989.
[8] ETS 300 401, “Radio Broadcasting systems; Digital audio Broadcasting (DAB) to mobile, portable and fixed receivers” available on the Internet at www.etsi.org. [9] ANSI T1.413, “Asymmetric Digital Subscriber Line (ADSL) Metallic Interface,”
1995.
[10] F.H. Irons, K.J.Riley, D. M. Hummels, G. A. Friel, “The Noise Power Ratio,” IEEE Trans. Instrumentation and Measurement, vol. 49, no. 3, June 1999.