Full Terms & Conditions of access and use can be found at
http://www.tandfonline.com/action/journalInformation?journalCode=kaup20
Autophagy
ISSN: 1554-8627 (Print) 1554-8635 (Online) Journal homepage: http://www.tandfonline.com/loi/kaup20
Atg5 and Ambra1 differentially modulate
neurogenesis in neural stem cells
Patricia Vázquez, Ana I. Arroba, Francesco Cecconi, Enrique J. de la Rosa,
Patricia Boya & Flora De Pablo
To cite this article: Patricia Vázquez, Ana I. Arroba, Francesco Cecconi, Enrique J. de la Rosa,
Patricia Boya & Flora De Pablo (2012) Atg5 and Ambra1 differentially modulate neurogenesis in neural stem cells, Autophagy, 8:2, 187-199, DOI: 10.4161/auto.8.2.18535
To link to this article: http://dx.doi.org/10.4161/auto.8.2.18535
Published online: 01 Feb 2012.
Submit your article to this journal
Article views: 628
View related articles
© 2012 Landes Bioscience.
Do not distribute.
Atg5 and Ambra1 differentially modulate
neurogenesis in neural stem cells
Patricia Vázquez,1,2,†Ana I. Arroba,1,†Francesco Cecconi,3Enrique J. de la Rosa,1Patricia Boya1,4,* and Flora de Pablo1,2,4,*
1
3D Lab (Development, Differentiation & Degeneration); Department of Cellular and Molecular Medicine; Centro de Investigaciones Biológicas; CSIC; Madrid, Spain;
2
CIBERDEM (ISCIII); Ministerio de Ciencia e Innovación; Madrid, Spain;3
Dulbecco Telethon Institute; IRCCS Fondazione Santa Lucia and Department of Biology; University of Rome“Tor Vergata”; Rome, Italy
†These authors contributed equally to this work;4These authors are senior equal co-authors.
Keywords: autophagy, Ambra1, Atg5, neural progenitors, neurogenesis, neuritogenesis, differentiation
Abbreviations: Ambra1, activating molecule in Beclin 1-regulated autophagy; Atg5, autophagy-related gene 5; Atg7, autophagy-related gene 7; eOBSC, embryonic olfactory bulb stem cells; E, embryonic day; ER, endoplasmic reticulum; LC3, microtubule-associated protein 1 light chain 3; 3-MA, 3-methyl-adenine; MP, methylpyruvate; Ngn, Neurogenin; RT-qPCR, reverse transcription-quantitative
polymerase chain reaction; WM, wortmannin
Neuroepithelial cells undergoing differentiation efficiently remodel their cytoskeleton and shape in an energy-consuming process. The capacity of autophagy to recycle cellular components and provide energy could fulfill these requirements, thus supporting differentiation. However, little is known regarding the role of basal autophagy in neural differentiation. Here we report an increase in the expression of the autophagy genes Atg7, Becn1, Ambra1 and LC3 in vivo in the mouse embryonic olfactory bulb (OB) during the initial period of neuronal differentiation at E15.5, along with a parallel increase in neuronal markers. In addition, we observed an increase in LC3 lipidation and autophagic flux during neuronal differentiation in cultured OB-derived stem/progenitor cells. Pharmacological inhibition of autophagy with 3-MA or wortmannin markedly decreased neurogenesis. These observations were supported by similar findings in two autophagy-deficient genetic models. In Ambra1 loss-of-function homozygous mice (gt/gt) the expression of several neural markers was decreased in the OB at E13.5 in vivo. In vitro, Ambra1 haploinsufficient cells developed as small neurospheres with an impaired capacity for neuronal generation. The addition of methylpyruvate during stem/ progenitor cell differentiation in culture largely reversed the inhibition of neurogenesis induced by either 3-MA or Ambra1 haploinsufficiency, suggesting that neural stem/progenitor cells activate autophagy to fulfill their high energy demands. Further supporting the role of autophagy for neuronal differentiation Atg5-null OB cells differentiating in culture displayed decreased TuJ1 levels and lower number of cells with neurites. These results reveal new roles for autophagy-related molecules Atg5 and Ambra1 during early neuronal differentiation of stem/progenitor cells.
Introduction
In the developing nervous system, stem and progenitor cells undergo a complex program, which mediates differentiation into neurons, astrocytes and oligodendrocytes. This program not only controls phenotypic decisions but also determines cell survival or death at each stage.1,2The self-eating/autophagy process was first
described in neurons, viewed by electron microscopy, over four decades ago.3,4 It has taken many years to recognize
macro-autophagy (macro-autophagy hereafter) as a cellular process implicated in multiple physiological and pathological situations (for reviews, see refs. 5–7) and to start unraveling autophagy’s molecular regulation.8 The first proteomic analysis of the basal autophagy
interactions in human cells has recently revealed a network of 751 interactions among 409 candidate interacting proteins.9 As
such, the developmental regulation of these complex set of proteins involved in autophagy is poorly understood,10and little
is known of the role of autophagy-related proteins in neural development.
The primary characteristic of the autophagic process is the recycling of cytosolic constituents, which are initially sequestered within double-membrane vesicles, known as autophagosomes, and later degraded through the lysosomal pathway.11In many cell types,
autophagy plays a pro-survival role, protecting cells from starva-tion,12 preventing the accumulation of protein aggregates and
damaged organelles and supplying the cell with amino acids and energy.13A highly regulated interplay between autophagy, cell
growth and cell death appears necessary for normal neural development in mammals.14The critical function of the autophagy
regulator Ambra1 (activating molecule in Beclin 1-regulated
*Correspondence to: Flora de Pablo or Patricia Boya; Email: [email protected] or [email protected] Submitted: 02/23/11; Revised: 10/11/11; Accepted: 10/26/11
http://dx.doi.org/10.4161/auto.8.2.18535
BASIC RESEARCH PAPER
Autophagy 8:2, 187–199; February 2012;G2012 Landes Bioscience
© 2012 Landes Bioscience.
Do not distribute.
autophagy) was demonstrated in Ambra1gt/gt mice, which exhibit severe neural tube defects and embryonic lethality associated with impaired autophagy.15,16 Ambra1gt/gt mice also exhibit decreased
expression of neurogenic genes such as Ngn2, accumulation of ubiquitinated proteins, unbalanced cell proliferation and excessive apoptotic cell death.15 Thus in addition to its role in adaptive
responses to nutrient deprivation or abnormal protein accumula-tion, autophagy appears to represent a key component of the developmental process.16 In agreement, our recent findings14,17
support a role of autophagy during cell death associated with central nervous system development, where it appears to be essential for cell engulfment. Earlier studies in nonmammalian systems anticipated the importance of autophagy in development and differentiation, with several developmental alterations described in autophagy mutants in yeast, plants, fungi, flies and worms.18Beclin 1 was the
first Atg protein deleted in mammals, resulting in early embryonic lethality in mice at embryonic day (E)7.5, reduced embryo size and visceral endoderm malformations.19
The specific role of autophagy in neural differentiation is far from clear, and the impact of autophagy imbalance during a physiological stress, as occurs when stem/progenitor cells switch from a state of intense proliferation to neuronal differentiation, remains unknown. In contrast to the view of Ambra1 as a crucial protein for nervous system normal development, the autophagy protein Atg5 has not been considered essential in that process. This conclusion is based on the grossly normal central nervous system until birth in mice globally deficient for Atg5.20Moreover,
in mice specifically deficient for Atg5 in neural cells, conditional Atg5flox/flox through the use of a nestin-Cre recombinase, the
neurodegenerative phenotype was not dramatic until 3 weeks of postnatal age.21In addition, these mice showed an accumulation
of ubiquitin-positive inclusion bodies in neurons of the olfactory bulb prenatally (among many other regions). In another study, the conditional Atg5 deletion in Purkinje-cell induced axonal swelling around the terminal observed after 4 weeks of age, leading to neuronal death.22
Stem/progenitor cells from the mouse embryo olfactory bulb (eOBSC) are a well-characterized tool for the study of neuronal differentiation. These cells allow the production of a large number of neurons over multiple passages under defined conditions in primary culture.23-25 Due to their synchronous differentiation in
the absence of mitogenic factors, eOBSC provide a useful model for the study of neurogenesis and its relationship with essential cellular processes such as autophagy.
Ambra1 is expressed at very high levels in the OB of adult mice,15 perhaps in association to the continuous neurogenesis
which occurs in this region throughout the life of the organism.26,27 During development, from E13.5 to 15.5, the
germinal zone surrounding the OB ventricle consists of a layer of neuroepithelial cells. One day later, at E16.5, a cell layer formed by the projecting mitral neurons is evident in OB sections.23The
neurogenic program is thus highly active in OB neural stem and precursor cells from E13.5–15.5 in vivo. In agreement, expression of the neurogenic genes NeuroD1 and Ngn1, a proneural transcription factor, is detected in the OB at E13.5.28
As autophagy is a potential source of energy during the cellular restructuring associated with neuronal differentiation and neurite outgrowth, we investigated whether regulated basal autophagy occurs during OB development in vivo. In wild-type mouse OB, we observed a progressive increase in the expression of the auto-phagy genes Atg7, Becn1, LC3 and Ambra1, during the differen-tiation of mitral neurons in vivo. In agreement, an increase in eOBSC autophagic activity was observed under differentiation conditions in culture. Inhibition of autophagy caused a significant decrease in the number of neurons generated and in the number of neurites exhibited by each neuron. In addition, Ambra1 functional deficiency prevented the generation of neurospheres in culture, while Ambra1 haploinsufficency resulted in the genera-tion of smaller neurospheres and fewer differentiated neurons. Importantly, these changes were reversed, to a large extent, by the metabolic substrate methylpyruvate. Moreover, Atg5-null eOBSCs also manifested reduced neuronal differentiation in vitro. Together, these pharmacological and genetic ablation data define new roles for autophagy-related molecules in the early phase of neuronal differentiation.
Results
Basal autophagy is increased in the OB in vivo and in OBSC during early neuronal differentiation in vitro. Neural stem and progenitor cells in the germinal layer of the OB give rise to projecting neurons, the mitral cells. In mice, this early phase of neurogenesis, which occurs between E12 and E1529is triggered by
the combined action of several transcription factors, including the proneural factors Neurogenin1 (Ngn1), Ngn2 and NeuroD.28We
hypothesized that the autophagy machinery may be active during this early period of neuronal differentiation. We thus analyzed the gene expression patterns of several autophagy genes in mouse OB at different stages in vivo by semi-quantitative and real-time quantitative RT-PCR (Fig. 1A). Ngn1, NeuroD and the neuronal marker β-III-Tubulin were increased during neuronal differenti-ation (Fig. 1A). Atg7, Becn1, LC3 and Ambra1 were all expressed
Figure 1 (See opposite page). Autophagy is increased during neural differentiation in vivo and in vitro. (A) Quantitative (bar graphs, the value at E13.5 is arbitrarily set as 1), and semiquantitative (gel insets) RT-PCR from pooled OBs from mouse littermates at the indicated embryonic ages. The displayed genes by RT-qPCR show significant statistical differences, p, 0.05. (B) E13.5 eOBSC were cultured as neurospheres and differentiation induced by mitogen deprivation. At the indicated times, cells were collected and protein was extracted for immunoblot withb-III-Tubulin (identified by TuJ1 antibody). Gel is representative out of five experiments with cells cultured for 3 h, 24 h and 72 h. GAPDH was used as a loading control. The TuJ1/GAPDH ratio is shown (mean ± SEM of five experiments), p, 0.05. (C) Representative fields of cells at 24 h and 72 h. Cells are stained for TuJ1+or MAP2ab+ cells (red) and DAPI to visualize nuclei (blue). Scale bar = 100mm. (D) E13.5 eOBSC were cultured in differentiation conditions and collected at different times of culture in the presence or in absence of ammonium chloride and leupeptin during the last 3 h of culture. LC3-II* displays a less exposed film. The LC3-II/GAPDH ratio is shown (mean ± SEM of five experiments, p, 0.05). (E) Representative fields of cells at 24 h and 72 h. We can observe TuJ1+ cells in red and LC3 puncta in green. The nuclei are stained with DAPI (blue). Arrows mark cells with increased LC3 immunostaining. Scale bar = 100mm.
© 2012 Landes Bioscience.
Do not distribute.
Figure 1. For figure legend, see page 188.
© 2012 Landes Bioscience.
Do not distribute.
at E13.5 in the OB, and increased progressively up to E15.5. As the cellular composition of the OB is heterogeneous, and we specifically sought to characterize newborn neurons, we next established eOBSC cultures in which the transition from pro-liferative to differentiated cells can be easily monitored in short-term cell culture following the withdrawal of mitogenic factors.23
eOBSC grown as neurospheres and allowed to differentiate for 72 h exhibited a marked increase in the levels of β-III-Tubulin, visualized by TuJ1 antibody in western blot (Fig. 1B) and immunofluorescence (Fig. 1C) and labeling with the neuronal marker MAP2ab (Fig. 1C). Concomitant to cell differentiation we observed an increase in the lipidated form of LC3 and increased autophagic flux (Fig. 1D). In addition, undifferentiated cells expressed low levels of LC3 by immunofluorescence while differentiated neurons, labeled with the neuronal marker TuJ1, manifested LC3 positive puncta (Fig. 1E). Together, these data show an increase in autophagy coincident with early neuronal differentiation.
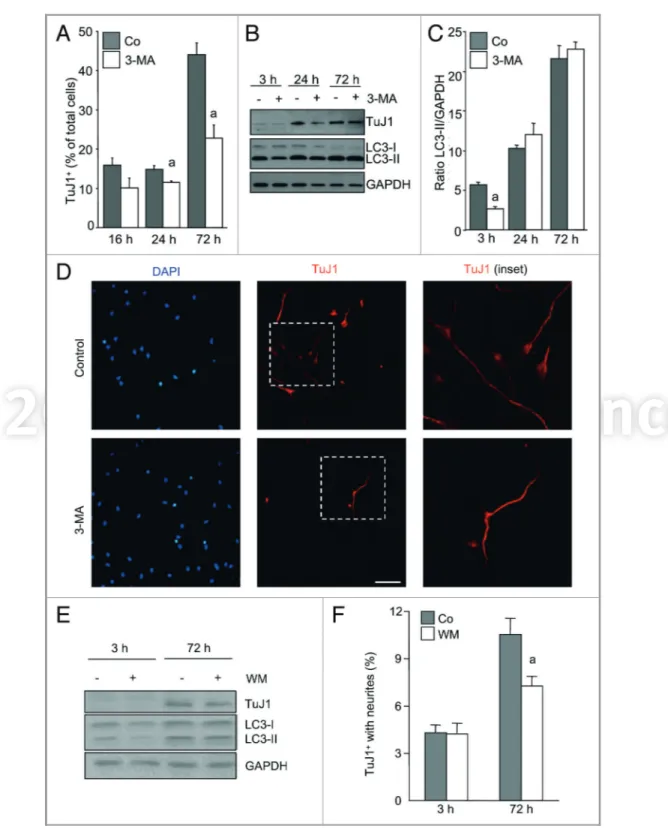
Autophagy inhibition decreases neuronal differentiation. eOBSC allowed to differentiate in culture generated a small number of TuJ1-positive (TuJ1+) neurons after 16 h, which after
72 h had increased to account for almost 50% of total cells (Fig. 2A). To determine whether autophagy induction was essential for neuronal differentiation, we performed short-term incubations with 3-MA, which blocks autophagy through the inhibition of class III PtdIns3-kinase.30Cells were incubated for
3 h with 3-MA, rinsed and allowed to differentiate in fresh 3-MA free culture medium for up to 72 h. As shown in Figure 2B and C, 3 h incubation with 3-MA reduced LC3-II levels. However, as expected, this effect was transient and no differences in the lipidated form of LC3 were observed at later time-points. More importantly, the initial blockade of autophagy with 3-MA led to a significant and sustained decrease in the number of differentiated TuJ1+ cells (Fig. 2A and D). These results were confirmed by
incubation with wortmannin,30 a more specific and sustained
inhibitor of autophagy (Fig. 2E). Moreover, sustained inhibition with wortmannin for 72 h decreased the number of TuJ1+cells
with neurites (Fig. 2F). The discrepancy between the level of TuJ1 protein in western blot, similar between control and 3-MA treated cells at 72 h, and the decreased number of differentiated cells, TuJ1+, is probably due to differences in epitope exposure by the
two techniques and the specific identification of strongly labeled cells by immunocytochemistry. Altogether these data show that pharmacological blockade of autophagy using two different inhibitors reduced neuronal differentiation.
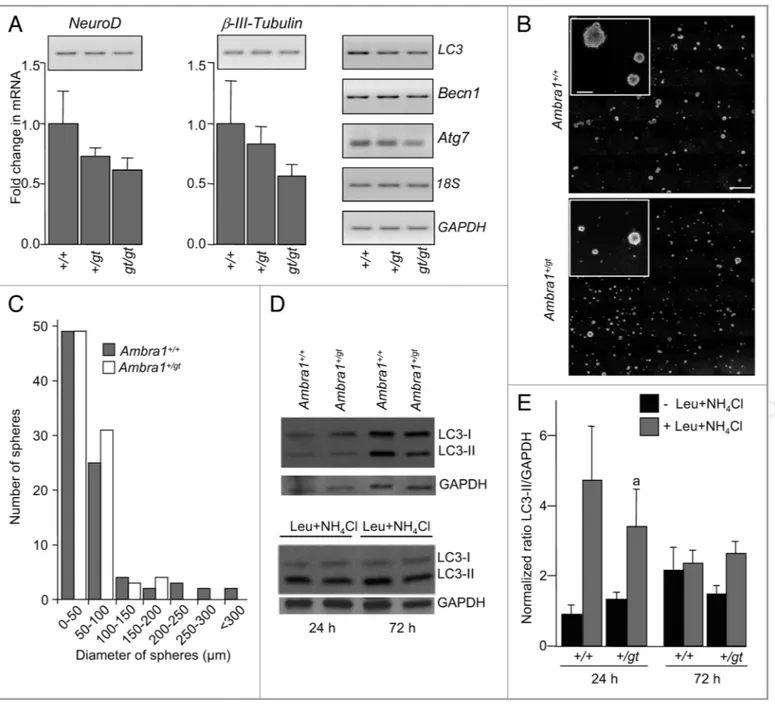
Normal functional levels of Ambra1 are critical for the genera-tion of neurospheres and neurons. The autophagy regulator Ambra1 is required for normal development of the central nervous system, and its absence in the Ambra1gt/gtmouse results in embryonic lethality at E14.5.15 In OB extracts from E13.5
Ambra1gt/gt mice, we observed statistically significant reduced
expression of NeuroD andβ-III-Tubulin by RT-qPCR compared with wild type littermates (Fig. 3A). A tendency to decreased expression of LC3, Atg7 and Becn1 was also observed although it did not reach statistical significance (data not shown). In order to confirm that autophagy is required for neuronal differentiation,
we quantified neurosphere formation and neuronal differentiation in eOBSC from Ambra1 mutant mice. Homozygous Ambra1gt/gt eOBSC were incapable of generating neurospheres. In contrast, haploinsufficient Ambra1+/gtcells formed neurospheres, though of a smaller size than their Ambra1+/+counterparts (Fig. 3B and C). None of the neurospheres from Ambra1+/gt cultures exhibited a diameter over 175 mm, whereas roughly 10% of those from Ambra1+/+cultures were of this size diameter or greater (Fig. 3C).
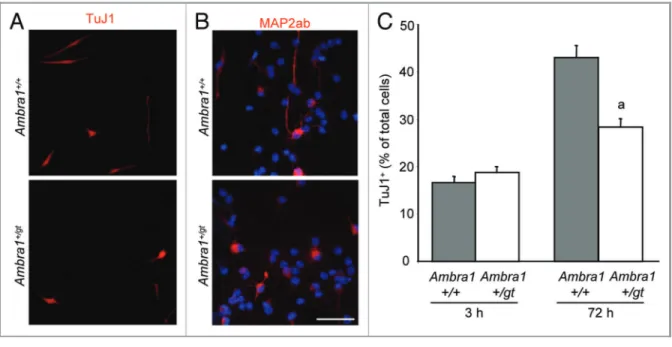
When proliferating Ambra1+/gt eOBSC were allowed to differ-entiate in culture Ambra1+/gt cells showed decreased levels of LC3-II in comparison to wild-type littermates (Fig. 3D) and less autophagic flux at 24 h (Fig. 3D and E) indicating a reduction in autophagy in Ambra1+/gt cells. Importantly, Ambra1+/gt eOBSC displayed fewer differentiated neurons (detected using two different neuronal markers) at 72 h as compared with Ambra1+/+cultures (Fig. 4A–C). These data demonstrate that
functional autophagy is required for eOBSC neuronal differenti-ation in vitro and in vivo.
Methylpyruvate restores neuronal differentiation in Ambra1+/gt
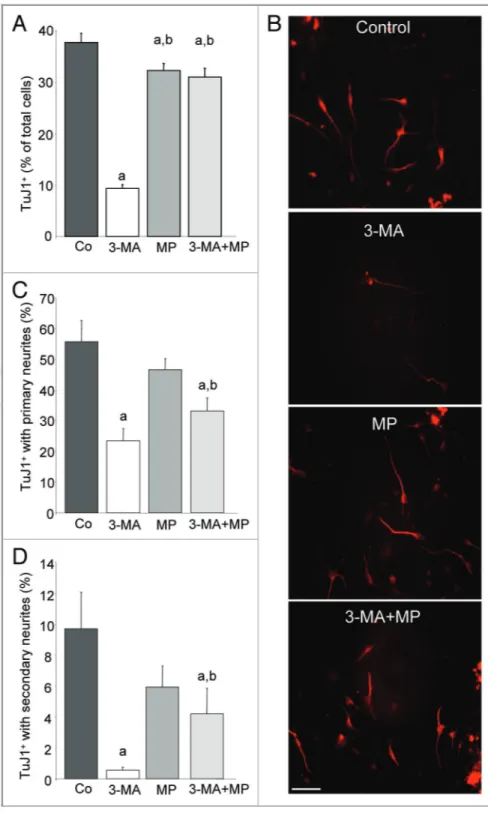
eOBSC and after 3-MA treatment. We recently demonstrated that autophagy inhibition with 3-MA reduces ATP levels during retinal neurogenesis, an effect reversed by methylpyruvate (MP), a permeable analog for the citric acid cycle.17To determine whether
the requirement of autophagy in stem/progenitor cell differentiation is dependent on energy status, we incubated eOBSC with 3-MA for 3 h, after which the cell culture medium was supplemented with MP during cell differentiation. Interestingly, the impairment of eOBSC neuronal differentiation by 3-MA was largely reversed in the MP-treated cultures (Fig. 5A). No morphological differences were detected between TuJ1+ neurons in the control and 3-MA+MP
groups (Fig. 5B). Thus in autophagy-deficient cultures, restoration of normal ATP availability by the addition of MP appears essential for eOBSC neuronal differentiation.
We next studied in greater detail the morphology of neurons generated after 72 h in culture in both control and impaired autophagic conditions. The progressive differentiation of eOBSC was quantified according to the presence and number of primary and secondary neurites on individual cells. 3-MA decreased the proportion of TuJ1+cells with primary neurites by 50%, an effect
that was attenuated by the addition of MP (Fig. 5C). The appearance of secondary neurites, a hallmark of more advanced maturation, was highly sensitive to impaired autophagy, with 3-MA treatment decreasing the number of secondary neurites by over 90% compared with control cells. Restoration of energy balance by the addition of MP partially reversed this effect, resulting in the generation of an intermediate number of cells with secondary neurites (Fig. 5D). More importantly, the addition of MP also completely rescued the neuronal differentiation capacity of Ambra1+/gt eOBSC after 72 h (Fig. 6A and B). Together, we show that inhibition of autophagy impairs neuronal differenti-ation. This effect is reversed by supplying cell cultures with a permeable substrate for the citric acid cycle, suggesting that autophagy represents an essential source of energy during early neuronal differentiation.
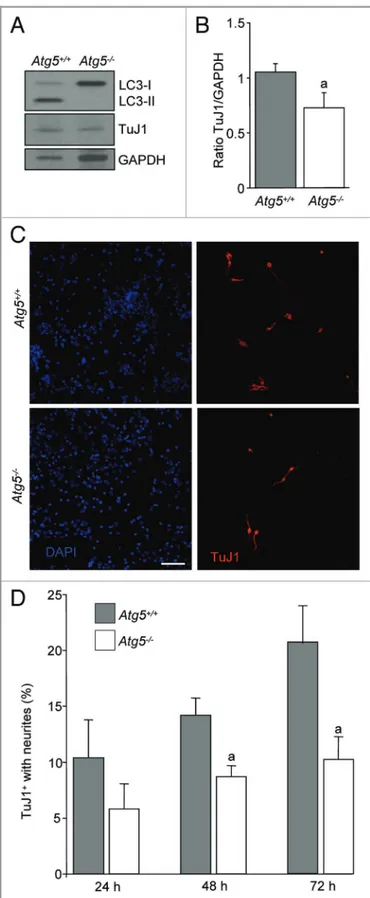
eOBSCs from Atg52/2 embryos show decreased neuronal differentiation in vitro. To further confirm that autophagy is
© 2012 Landes Bioscience.
Do not distribute.
Figure 2. Autophagy inhibition attenuates the generation of neurons from eOBSC. E13.5 mouse eOBSC were allowed to differentiate by deprivation of mitogens. Three hours after plating, 3-MA (10 mM) was added for 3 h. After washing, the culture was maintained for 72 h under standard cell differentiation conditions. (A) Cells were then collected for immunostaining againstb-III-Tubulin (identified by TuJ1 antibody) and DAPI. Percentage of TuJ1+differentiated neurons at the time-points indicated in control (solid bars) and 3-MA treated (open bars) cells. Results represent the mean ± SEM from five experiments, with each culture performed in triplicate. (a) p, 0.05 vs corresponding time control. (B) Immunoblot of TuJ1 and LC3 representative of three experiments from cells cultured for 3 h, 24 h and 72 h after 3-MA treatment (for 3 h) GAPDH was used as a loading control. (C) Densitometric analysis of LC3-II/GAPDH ratio (mean ± SEM) of three experiments with duplicate samples). (a) p, 0.05 vs corresponding time control. (D) Representative fields of control and 3-MA treated cells at 72 h. Nuclei are stained with DAPI (blue) and the morphology of TuJ1+cells (red) is shown at lower (middle panels) and higher (right panels) magnifications (the enlarged field is indicated by dashed lines in the middle panels). Scale bar = 100mm. (E) Immunoblot of LC3 and b-III-Tubulin expression in cells cultured for 3 h and 72 h after 3 h wortmannin treatment. GAPDH was used as a loading control. (F) Percentage of TuJ1+cells with neurites at the time-points indicated in control cultures (solid bars) and cultures treated with wortmannin during the whole incubation period (open bars). Results represent the mean ± SEM from three experiments. (a) p, 0.05 vs corresponding time control.
© 2012 Landes Bioscience.
Do not distribute.
Figure 3. Ambra1 mutant mice have deficits in gene and protein expression in the OB in vivo and decreased ability to generate neurospheres from eOBSC in vitro. (A) Quantitative (graphs) and semiquantitative (gels) RT-PCR was performed with total RNA isolated from OBs pooled from Ambra1+/+, Ambra1+/gtand Ambra1gt/gtmice littermates at E13.5. Neural genes (NeuroD,b-III-Tubulin) and autophagy related genes (Atg7, Becn1, LC3) were analyzed in parallel with loading controls (18S, GAPDH) by semi-quantitative RT-PCR and by RT-qPCR. Statistical analysis of RT-qPCR show a significant difference in Ambra1+/+vs. Ambra1gt/gtin neural genes (p, 0.05). (B) eOBSC were grown from E13.5 embryos derived from the crossing of Ambra1 haploinsufficient mice. Ambra1gt/gtcells failed to generate neurospheres. Representative fields of Ambra1+/+and Ambra1+/gtneurospheres in culture after 48 h under proliferative conditions viewed under phase contrast optical microscopy; the inset shows a higher magnification. Scale bars = 1 mm in main photo and 100mm in the inset. (C) Number of neurospheres with the diameter indicated in Ambra1+/+(solid bars) and Ambra1+/gt(open bars) derived cultures. eOBSC were derived from two separate litters, two independent experiments performed in triplicate, and the results pooled. Differences in neurosphere mean size were analyzed with a Poisson distribution with ax2of 135.5, p, 0.001. (D) E13.5 Ambra1+/+and Ambra1+/gtmice eOBSC were cultured in differentiation conditions without mitogens for 24 h or 72 h in the presence or absence of ammonium chloride and leupeptin during the last three hours of culture. Then the protein was extracted and analyzed by immunoblot for LC3. A decrease in the lipidated form of LC3 is observed in Ambra1+/gtcells in basal conditions and less autophagic flux is evident at 24 h in a representative blot of three independent experiments. We used GAPDH as a loading control. (E) The ratio of LC3-II/GAPDH is shown as mean ± SEM from three independent experiments, with Ambra1+/+cells at 24 h considered arbitrarily as 1. (a) p, 0.05 vs Ambra1+/+.
© 2012 Landes Bioscience.
Do not distribute.
required for neuronal cell differentiation we isolated eOBSCs from Atg52/2 and Atg5+/+ embryos at E13.5 and allowed them to differentiate in vitro by growth factor withdrawal. As it is shown in Figure 7A, LC3-II levels were undetected in the knockout cells indicating that autophagy is reduced at 72 h. Importantly, TuJ1 levels by western blot were also reduced at this time-point (Fig. 7A and B). Moreover, immunofluorescence analyses followed by quantitation also demonstrated that Atg52/2 cells cultures displayed reduced numbers of TuJ1-positive cells with neurites in comparison to wild-type littermates (Fig. 7C and D). In conclusion, by using two pharmacological approaches and cells from two autophagy-deficient animal models we demon-strated for the first time that proper autophagy, particularly normal levels of Ambra1 and Atg5, are needed for progenitor stem cells differentiation into neurons in vivo and in vitro.
Discussion
Unraveling the mechanisms underlying stem cell transition from pluripotency to the differentiated state is essential for their future use in regenerative medicine. Using the mouse OB during neurogenesis and eOBSC cultures as in vivo and in vitro model systems, we described the induction of autophagy in parallel with neuronal differentiation. Both pharmacological and genetic disruption of the autophagic machinery impaired the differenti-ation process, decreasing the number of newborn neurons and hindering their maturation in culture. The rescue of the differen-tiation program by methylpyruvate addition strongly suggests that autophagy provides the high levels of energy required for the transition from proliferative precursor to postmitotic neuron.
During nervous system development, molecular signals including transcriptional factors and epigenetic changes instruct progenitor cells to generate different types of neuronal and glial cells.31 A critical period of neurogenesis in the OB projecting
neurons, the mitral cells, occurs between E13.5 and E15.5 in the mouse. We observed a progressive upregulation of the autophagy genes Atg7, Becn1, Ambra1 and LC3 throughout this period, along with a parallel upregulation of the neurogenic markers Ngn1, NeuroD and β-III-Tubulin. This strongly suggests that autophagy participates in the neuronal differentiation program, at the very least playing a permissive role in this process. A similar function was recently been proposed in human keratinocytes, in which autophagy constitutes an early signaling process required for keratinocyte commitment to the differentiation pathway.32
While the participation of autophagy in the transition from proliferation to differentiation during development is now well documented,33 appropriate primary cell systems are needed to
characterize the precise role of autophagy regulators. The availability of a well-defined synchronous stem/progenitor cell culture system, derived from the mouse embryonic olfactory bulb, has allowed us to demonstrate the involvement of autophagy in early phases of neuronal differentiation. Activation of autophagy, as determined by LC3 lipidation, occurred in parallel with an increase in the expression of the neuronal markerβ-III-Tubulin, whereas autophagy inhibition with 3-MA reduced the number of neurons by 50% after 72 h in culture. A fully functional autophagic response appears to be crucial during the initial stages of differentiation in culture, as inhibition of autophagy with 3-MA or wortmannin for just 3 h had a profound effect on the final number of neurons and their capacity to differentiate. This
Figure 4. Ambra1 haploinsufficiency results in decreased neuronal differentiation. Ambra1+/+and Ambra1+/gteOBSC were grown as neurospheres and were plated in differentiation conditions and cultured for up to 72 h. Cells were collected at 3 h and 72 h and fixed. (A) Representative fields of Ambra1+/+and Ambra1+/gtneurons stained with TuJ1 or (B) MAP2ab antibodies (red) at 72 h. Nuclei are stained with DAPI (blue). Scale bar = 100mm. (C) The percentage of TuJ1+differentiated neurons is shown for Ambra1+/+and Ambra1+/gtcultures at the indicated time-points. Results represent the mean ± SEM from two independent experiments from two litters, with each culture performed in triplicate. (a) p, 0.05 vs control.
© 2012 Landes Bioscience.
Do not distribute.
hypothesis is further supported by the fact that autophagic flux is reduced at 24 h in Ambra1+/gtwith an effect in neuritogenesis at
72 h. The involvement of autophagy proteins in early OB differentiation was further supported by the observed decrease in NeuroD and β-III-Tubulin at E13.5 in mice with functional deletion of both Ambra1 alleles. A tendency to decreased Atg7, Becn1 and LC3 expression was also observed at this time-point, just before embryonic lethality occurs. The requirement of autophagic pro-cesses for neuronal differentiation was con-firmed in Ambra1 haploinsufficient mice, in which the neuronal number was halved as compared with controls. The striking inabi-lity of Ambra1gt/gtto form neurospheres may also implicate autophagy in the proliferative state,15or in the maintenance of pluripotency
of stem/precursor cells, an issue which merits further research.
Morevoer, the observation of reduced neuronal differentiation in the Atg5-null eOBSCs further supports our hypothesis that autophagy is essential for this process. Besides the role of Atg5 demonstrated recently in the survival of adult neurons under stress condi-tions,34 autophagy may also be essential to
generate the vestibular ganglion cells during inner ear development (manuscript in pre-paration, laboratory of I. Varela-Nieto, IIB, CSIC). In comparison with Ambra1, the phenotype of Atg5 null cells was milder, pointing out to the existence of compensatory effects in the Atg5 cells, or reflecting addi-tional effects of Ambra1 independent of its role in autophagy, and/or the requirement of Atg5 and Ambra1 in slightly different moments of the process of differentiation from a neuroblast to a neuron.
Autophagy is an energy-providing mech-anism, which recycles cellular organelles and intracellular constituents to produce energy and amino acids.13In line with this view, the
present study describes a primary role of autophagy in neurogenesis. Addition of MP, which acts as an energy supplier, partially restored neuronal generation following phar-macological inhibition of autophagy, and fully restored it in the Ambra1 haploinsuffi-ciency model. These observations thus point to energy supply as the primary function of autophagy in the context of neuronal differentiation. This proposal is supported by our previous studies in the developing retina, which demonstrated an essential role for
Figure 5. Neurite outgrowth is impaired by 3-MA treatment and partially restored by MP. eOBSC were cultured as described in Figure 2 and stained with TuJ1 antibody. Neurites were classified as primary (predominant processes emerging directly from the cell body) or secondary (processes emerging from a primary neurite). (A) Percentage of total TuJ1+neurons in control culture, and following treatment with 3-MA, MP, or 3-MA and MP in combination (3-MA + MP, 10 mM each). (B) Representative fields of TuJ1+neurons after 72 h in culture under control conditions or following 3-MA ± MP treatments. Scale bar = 100mm. (C) Percentage of TuJ1+ neurons displaying at least one primary neurite in the same cultures as in (A). (D) Percentage of TuJ1+neurons displaying secondary neurites in the same cultures as A. Results represent the mean ± SEM of three experiments performed in triplicate. (a) p, 0.05 vs control, (b) p , 0.05 vs 3-MA-treated culture.
© 2012 Landes Bioscience.
Do not distribute.
autophagy in cell corpse clearance during naturally occurring cell death associated with neurogenesis.17,35In this context, autophagy
maintains the ATP levels necessary for the exposure of engulfment signals,14 a phenomenon also observed in embryoid body
cavitation.36 A fully functioning autophagy response is essential
to maintain energy levels in several other situations, such as starvation, when the induction of autophagy helps maintain cell viability in vitro12 or amino acid concentrations in neonates
before nursing.20,37Autophagy is also essential for preimplantation
embryonic development, as oocytes from Atg5 knockout mice fail to develop beyond the four- and eight-cell stages, and the resultant autophagy-null embryos exhibit decreased rates of protein synthesis.38Energy and amino acids generated by
auto-phagy are thus essential for tissue homeostasis at different stages during the life cycle of vertebrates, including early embryo-genesis, neural development, birth, the postnatal stage and adult starvation. Further studies are needed to unravel the hierarchy
between energy requirements, mTOR pathway and autophagy during neuronal differentiation.
Neuritogenesis was also impaired after autophagy inhibition, and partially restored by the addition of MP. Although additional studies are needed to determine whether this effect is independent of autophagy inhibition, or a direct consequence of impaired differentiation, some observations point toward specific effects of starvation-independent autophagy. For example, previous findings in healthy neurons39 and the reported requirement of Atg7
for maintenance of axonal homeostasis.40 Decreased activity of
Ulk1 (the mouse ortholog of yeast Atg1) also prevents neurite outgrowth in vitro and in vivo, and results in decreased expression of neuron-specificβ-III-Tubulin.41In the hybrid NG108-15 cell
line, blockade of autophagy with 3-MA, or by silencing Becn1 or Atg5, prevents cAMP-induced differentiation.42Other autophagy
genes are also essential for cellular remodeling. Differentiation of primary mouse embryonic fibroblasts into adipocytes is blocked in cells derived from Atg5-null mice, suggesting that autophagy facilitates the reshaping of the cytoplasm necessary for adipocyte differentiation.43Autophagy can also mediate the specific
elimina-tion of mitochondria, ER, peroxisomes and ribosomes.44,45
The cell-autonomous basal autophagy described in the present study was developmentally regulated, as it increased in parallel with neuronal differentiation, both in vivo and in cultured eOBSC. We thus propose that autophagy is a major contributor to the intensive cell-remodeling process that occurs during early neuronal differentiation. This is supported by the demonstrated requirement of Ambra1 and Atg5 for normal neurogenesis in vitro and in vivo. Our findings underscore the importance of fully elucidating the interplay between autophagy machinery and the cell differentiation process to identify molecular targets for future neural stem-cell based therapies.
Materials and Methods
Olfactory bulbs and quantitative and semiquantitative reverse transcriptase-polymerase chain reaction (RT-PCR). Animals were housed, cared and euthanized in accordance with European Union guidelines and experiments were approved by the CIB ethics committee for animal experimentation. After removing the brain from the skull, both OBs were dissected and pooled according to mouse strain (C57BL/6J or Ambra1) and developmental day (13.5, 14.5 and 15.5; the day on which vaginal plug was detected was considered E0.5). C57BL/6J mice were obtained from the Jackson Laboratory, and Ambra1 mutant mice were generated in the laboratory of F. Cecconi.15Atg5 knockout
animals were kindly provided by N. Mizushima.20Total RNA was
extracted from tissue using Trizol (Invitrogen, 15596-018) and reverse transcription performed on 1 mg of total RNA using Oligo(dT)18-20 (Invitrogen, 18418-020) and Superscript III enzyme (Invitrogen, 18080-44). Quantitative real-time PCR was performed with a TaqMan Universal PCR Master mix using probes from Universal Probe Library Set in a 7900 HT-Fast real time PCR System (Roche Applied Biosystems). Each value was adjusted by using 18S RNA levels as a reference. For semi-quantitative RT-PCR all genes were processed in parallel and
Figure 6. Neuronal differentiation is impaired in Ambra1 haploinsuffi-cient mice and restored by MP. eOBSC were grown from pooled E13.5 embryos derived from the crossing of Ambra1 haploinsufficient mice. Cultures from Ambra1+/+and Ambra1+/gtwere grown initially as neurospheres and after at least three passages, cells were plated in differentiation conditions and cultured for up to 72 h, in the presence or absence of MP (10 mM). Cells were collected and fixed, and differentiation monitored. (A) Percentage of TuJ1+differentiated neurons at 72 h in Ambra1+/+and Ambra1+/gtcultures treated as indicated. Results represent the mean ± SEM from two independent experiments from two litters, with each culture performed in triplicate. (a) p, 0.05 vs Ambra1+/+, (b) p, 0.05 vs Ambra1+/gtwithout MP. (B) Representative fields of Ambra1+/+and Ambra1+/gt+ MP cells at 72 h. Nuclei are stained with DAPI (blue) and neurons labeled with TuJ1 (red). Scale bar = 100mm.
© 2012 Landes Bioscience.
Do not distribute.
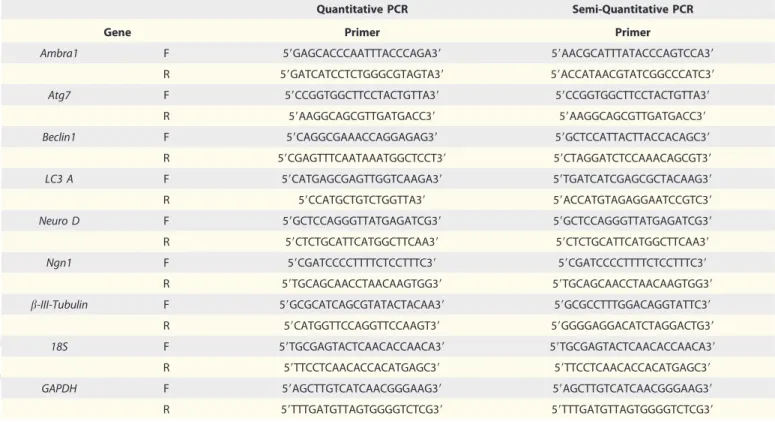
the same parameters for image analysis were applied. The primers used are listed in Table 1.
Genotyping of Ambra1 and Atg5 mutant embryos. Ambra1 and Atg5 E13.5 embryos were genotyped by processing tail bud tissue. In Ambra1 embryos RNA was isolated as described
above and PCR was performed using two pairs of pri-mers: 5'-AACGCATTTATACCCAGTCCA-3' (primer A) and 5'-ACCATAACGTATCGGCCCATC-3' (primer B), mapping upstream and downstream of the gene-trap insertion site, respectively; and primer A together with 5'-CCCAGTCACG-ACGTTGTAAAA-3' (primer C), the latter mapping onto the lacZ reporter sequence. In Atg5 embryos DNA was isolated with proteinase K (0.6 mg/ml, Sigma, P2308) in high salt buffer, and PCR was performed using 3 primers: 5'-ACAACGTCGAGCACAGCTGCGCAAGG-3', (primer A) 5'-GAATATGAAGGCACACCCCTGAAATG-3' (primer B) 5'-GTACTGCATAATGGTTTAACTCTTGC-3' (primer C).
Neural stem/progenitor cell cultures. Neural/progenitor stem cells were prepared from the OB of E13.5 mouse embryos, as previously described.23 The OB was dissected and mechanically
disaggregated. Cells were resuspended in DMEM/F12/N2 medium, consisting of Dulbecco’s modified Eagle’s medium (DMEM/F12, GIBCO, 42400-028), with N2 supplement containing insulin (10 mg/ml, Sigma, I1507), apotransferrin (Sigma, T2252), putrescine (Sigma, P5780), progesterone (Sigma, P6149) and sodium selenite (Sigma, S5261). Cells were then plated onto uncoated tissue culture dishes at a density of 3.5¾ 104cells/cm2and incubated at 37°C in 5% CO
2. FGF-2
(Preprotech, 100-18B) and EGF (Preprotech, AF-100-15) (20 ng/ml each) were added daily to expand the proliferating precursor cell population up until the first passage, after which they were added only on days of passage (every 3–4 d).
Proliferative eOBSC and neurosphere scoring. Cultured Ambra1+/gteOBSC were plated at a density of 6¾ 103cells/cm2
under proliferation conditions (DMEMF12/N2 with mitogens). To quantify the number of neurospheres, a total of five random fields per well were photographed, using the 10 ¾ objective of a phase contrast microscope (Zeiss Axioplan). Neurosphere diameter was measured using LAS AF Leica Software. Only neurospheres with diameters of over 20mm were scored. Cultures from different passages and litters were analyzed.
Differentiating cultures and treatments with 3-MA, wort-mannin and methylpyruvate. To induce cell differentiation, neurospheres from cultures of less than 20 passages were plated at a density of 105 cells/cm2 on coverslips coated with 15 mg/ml
polyornitin (Sigma, P4957) and 1 mg/ml fibronectin (GIBCO, 33010-018) under differentiation conditions (DMEM/F12/N2
Figure 7. Atg5 null eOBSC display decreased neuronal differentiation. Atg5+/+and Atg52/2eOBSC were grown initially as neurospheres and after at least three passages, were plated in differentiation conditions without mitogens and cultured for up to 72 h. (A) Immunoblot of differentiated cells after 72 h of culture in differentiation conditions. In Atg52/2cells there is an absence of LC3-II form, and a decrease of TuJ1 protein expression. (B) Densitometric analysis of TuJ1/GAPDH ratio (mean ± SEM of three experiments), (a) p, 0.05. (C) Representative fields of Atg5+/+and Atg52/2neurons stained with TuJ1 (in red) and DAPI staining for nuclei (blue). (D) Percentage of TuJ1+cells with neurites at different time-points of culture, in Atg5+/+and Atg52/2cells. Results represent the mean ± SEM from two independent experiments from three litters, with each culture performed in triplicate.
Scale bar = 100mm. (a) p , 0.05 vs Atg5+/+.
© 2012 Landes Bioscience.
Do not distribute.
without mitogens) and incubated for 3 h. To analyze autophagic flux during cell differentiation we cultivated cells during the last 3 h of culture in the presence of ammonium chloride (20 mM, Sigma, A9434) and leupeptin hemisulfate (0.1 mM, Fisher Scientific, BP2662). To study the effect of autophagy inhibition on neural differentiation, 3-MA (10 mM, Sigma, M9281) or wortmannin (100 nM, Calbiochem, 681675) was added to the culture medium, alone, or in combination with methylpyruvate (10 mM, Sigma, 37117), for 3 h. The medium was then replaced with fresh medium and the cells cultured up until 72 h, in the presence or absence of MP, or with wortmannin. The culture medium was supplemented with sodium bicarbonate (1.5 mg/ml, Sigma, S7561) to maintain the pH balance in the presence of MP, and replaced every 24 h. Cells were then fixed for immunostain-ing, or lysed for immunoblot analysis.
Immunostaining of cultured cells and neurite scoring. Cells cultured for the indicated periods of time were fixed with 4% paraformaldehyde in 0.1 M phosphate buffer, pH 7.4, for 20 min. Cells were incubated overnight at 4°C with primary anti-bodies against: β-III-Tubulin (TuJ1, rabbit polyclonal, 1:1000; Covance, MRB-435P), LC3 (1:100, MBL, M152-3) or MAP2ab (1:200, Sigma, M1406) followed by incubation with Texas Red secondary antibody (1:1000; Molecular Probes, T2767) or with Alexa 488 antibody (1:250, Molecular Probes, A1101). Controls were performed to confirm primary and secondary antibody specificity. Cultures were counterstained with 4',6-diamidino-2-phenylindole (DAPI, Sigma, D9542) to visualize nuclei. To determine the number of TuJ1+ cells, a total of 10 random
fields per coverslip were analyzed using a 40 or 63¾ objectives under a fluorescence filter. Neurites were classified as primary
(predominant processes emerging directly from the cell body) or secondary (processes emerging from a primary neurite).
Immunoblotting. Cells harvested at the indicated time-points were incubated in lysis buffer [50 mM TRIS-HCl pH 7.4, 300 mM NaCl, 0.01% Triton X-100, 1 mM EDTA, 1 mM Orthovanadate (Sigma, S6508), 25 mM NaF (Sigma, S6521), 4 mM sodium pyrophosphate (Sigma, S9515) and an entire mini EDTA-free protease inhibitor tablet (Roche Diagnostics, 11836170001)] for 20 min at 4°C. Cell lysates were centrifuged at 20,000 g at 4°C for 15 min, and the supernatant collected and stored at -20°C for further analysis by immunoblotting. Protein extracts (35 mg, quantitation performed by BCA method, Thermo Scientific, 23227) were fractionated by electrophoresis on 15% polyacrilamide gels and transferred to PVDF membranes (Whatman Protran, 10401396). Membranes were treated with 5% nonfat dry milk, 0.05% Tween 20 in PBS for 2 h at room temperature (RT), and incubated overnight at 4°C with primary antibodies:β-III-Tubulin (TuJ1, mouse monoclonal 1:500, Covance, MMS-435P), LC3 (1:2000, MBL, PM036), and GAPDH (1:5000, Abcam, ab8245). After washing, membranes were incubated for 2 h at RT with horseradish peroxidase (HRP)-conjugated secondary antibodies and subsequently with enhanced chemiluminescence (ECL) reagent (Pierce, 34080). The optical density of specific bands was measured by densitometry using ImageJ software. Protein levels were normalized relative to those of GAPDH.
Statistical analysis. Results are expressed as the mean ± SEM of the number of experiments indicated in the figure legends. Statistical analyses were performed using ANOVAs. To understand which treatments were different, we used individual contrasts. Differences in the mean size of neurospheres in Figure 3C were analyzed using a
Table 1. Sequence of the primers used in quantitative and semi-quantitative RT-PCR
Quantitative PCR Semi-Quantitative PCR
Gene Primer Primer
Ambra1 F 59GAGCACCCAATTTACCCAGA39 59AACGCATTTATACCCAGTCCA39
R 59GATCATCCTCTGGGCGTAGTA39 59ACCATAACGTATCGGCCCATC39
Atg7 F 59CCGGTGGCTTCCTACTGTTA39 59CCGGTGGCTTCCTACTGTTA39
R 59AAGGCAGCGTTGATGACC39 59AAGGCAGCGTTGATGACC39
Beclin1 F 59CAGGCGAAACCAGGAGAG39 59GCTCCATTACTTACCACAGC39
R 59CGAGTTTCAATAAATGGCTCCT39 59CTAGGATCTCCAAACAGCGT39
LC3 A F 59CATGAGCGAGTTGGTCAAGA39 59TGATCATCGAGCGCTACAAG39
R 59CCATGCTGTCTGGTTA39 59ACCATGTAGAGGAATCCGTC39
Neuro D F 59GCTCCAGGGTTATGAGATCG39 59GCTCCAGGGTTATGAGATCG39
R 59CTCTGCATTCATGGCTTCAA39 59CTCTGCATTCATGGCTTCAA39
Ngn1 F 59CGATCCCCTTTTCTCCTTTC39 59CGATCCCCTTTTCTCCTTTC39
R 59TGCAGCAACCTAACAAGTGG39 59TGCAGCAACCTAACAAGTGG39
b-III-Tubulin F 59GCGCATCAGCGTATACTACAA39 59GCGCCTTTGGACAGGTATTC39
R 59CATGGTTCCAGGTTCCAAGT39 59GGGGAGGACATCTAGGACTG39
18S F 59TGCGAGTACTCAACACCAACA39 59TGCGAGTACTCAACACCAACA39
R 59TTCCTCAACACCACATGAGC39 59TTCCTCAACACCACATGAGC39
GAPDH F 59AGCTTGTCATCAACGGGAAG39 59AGCTTGTCATCAACGGGAAG39
R 59TTTGATGTTAGTGGGGTCTCG39 59TTTGATGTTAGTGGGGTCTCG39
© 2012 Landes Bioscience.
Do not distribute.
Poisson distribution. The level of significance was set at p, 0.05 (two-tailed).
Disclosure of Potential Conflicts of Interest
No potential conflicts of interest were disclosed.
Acknowledgments
We thank, Esther Seco and Sergio H. Latorre for helpful technical assistance, Patrick S. Fitze for statistical analysis, Owen Howard
for English editing and Carlos Vicario-Abejón for comments on the manuscript. This project was funded by SAF2009-08086 to P.B., SAF2010-21879 to E.J.delaR. and BFU 2007-61055 to F.deP., all from Ministerio de Ciencia e Innovación (Spain), and by Thelethon and AIRC to F.C. AIA was supported by a Sara Borrell contract from the ISCIII (Spain). P.V. was supported by CIBERDEM (CIBER de Diabetes y Enfermedades Metabólicas), an initiative of the Instituto de Salud Carlos III (Spain).
References
1. de la Rosa EJ, de Pablo F. Cell death in early neural development: beyond the neurotrophic theory. Trends Neurosci 2000; 23:454-8; PMID:11006461; http://dx. doi.org/10.1016/S0166-2236(00)01628-3
2. Boya P, de la Rosa EJ. Cell death in early neural life. Birth Defects Res C Embryo Today 2005; 75:281-93; PMID: 16425247; http://dx.doi.org/10.1002/bdrc.20054 3. De Duve C, Wattiaux R. Functions of lysosomes. Annu
Rev Physiol 1966; 28:435-92; PMID:5322983; http:// dx.doi.org/10.1146/annurev.ph.28.030166.002251 4. Dixon JS. “Phagocytic” lysosomes in chromatolytic
neurones. Nature 1967; 215:657-8; PMID:6050233; http://dx.doi.org/10.1038/215657a0
5. Cecconi F, Levine B. The role of autophagy in mammalian development: cell makeover rather than cell death. Dev Cell 2008; 15:344-57; PMID:18804433; http://dx.doi.org/10.1016/j.devcel.2008.08.012 6. Levine B, Kroemer G. Autophagy in the pathogenesis
of disease. Cell 2008; 132:27-42; PMID:18191218; http://dx.doi.org/10.1016/j.cell.2007.12.018 7. Ravikumar B, Sarkar S, Davies JE, Futter M,
Garcia-Arencibia M, Green-Thompson ZW, et al. Regulation of mammalian autophagy in physiology and patho-physiology. Physiol Rev 2010; 90:1383-435; PMID: 20959619; http://dx.doi.org/10.1152/physrev.00030. 2009
8. He C, Klionsky DJ. Regulation mechanisms and signaling pathways of autophagy. Annu Rev Genet 2009; 43:67-93; PMID:19653858; http://dx.doi.org/ 10.1146/annurev-genet-102808-114910
9. Behrends C, Sowa ME, Gygi SP, Harper JW. Network organization of the human autophagy system. Nature 2010; 466:68-76; PMID:20562859; http://dx.doi.org/ 10.1038/nature09204
10. Mizushima N, Levine B. Autophagy in mammalian development and differentiation. Nat Cell Biol 2010; 12:823-30; PMID:20811354; http://dx.doi.org/10. 1038/ncb0910-823
11. Yang Z, Klionsky DJ. Mammalian autophagy: core molecular machinery and signaling regulation. Curr Opin Cell Biol 2010; 22:124-31; PMID:20034776; http://dx.doi.org/10.1016/j.ceb.2009.11.014 12. Boya P, Gonzalez-Polo RA, Casares N, Perfettini J,
Dessen P, Larochette N, et al. Inhibition of macro-autophagy triggers apoptosis. Mol Cell Biol 2005; 25: 1025-40; PMID:15657430; http://dx.doi.org/10.1128/ MCB.25.3.1025-1040.2005
13. Moreau K, Luo S, Rubinsztein DC. Cytoprotective roles for autophagy. Curr Opin Cell Biol 2010; 22: 206-11; PMID:20045304; http://dx.doi.org/10.1016/ j.ceb.2009.12.002
14. Boya P, Mellen MA, de la Rosa EJ. How autophagy is related to programmed cell death during the develop-ment of the nervous system. Biochem Soc Trans 2008; 36:813-7; PMID:18793142; http://dx.doi.org/10.1042/ BST0360813
15. Fimia GM, Stoykova A, Romagnoli A, Giunta L, Di Bartolomeo S, Nardacci R, et al. Ambra1 regulates autophagy and development of the nervous system. Nature 2007; 447:1121-5; PMID:17589504
16. Cecconi F, Di Bartolomeo S, Nardacci R, Fuoco C, Corazzari M, Giunta L, et al. A novel role for auto-phagy in neurodevelopment. Autoauto-phagy 2007; 3:506-8; PMID:17622796
17. Mellén MA, de la Rosa EJ, Boya P. The autophagic machinery is necessary for removal of cell corpses from the developing retinal neuroepithelium. Cell Death Differ 2008; 15:1279-90; PMID:18369370; http://dx. doi.org/10.1038/cdd.2008.40
18. Levine B, Klionsky DJ. Development by self-digestion: Molecular mechanisms and biological functions of autophagy. Dev Cell 2004; 6:463-77; PMID:15068787; http://dx.doi.org/10.1016/S1534-5807(04)00099-1 19. Liang XH, Jackson S, Seaman M, Brown K, Kempkes
B, Hibshoosh H, et al. Induction of autophagy and inhibition of tumorigenesis by beclin 1. Nature 1999; 402:672-6; PMID:10604474; http://dx.doi.org/10. 1038/45257
20. Kuma A, Hatano M, Matsui M, Yamamoto A, Nakaya H, Yoshimori T, et al. The role of autophagy during the early neonatal starvation period. Nature 2004; 432: 1032-6; PMID:15525940; http://dx.doi.org/10.1038/ nature03029
21. Hara T, Nakamura K, Matsui M, Yamamoto A, Nakahara Y, Suzuki-Migishima R, et al. Suppression of basal autophagy in neural cells causes neurodegenerative disease in mice. Nature 2006; 441:885-9; PMID: 16625204; http://dx.doi.org/10.1038/nature04724 22. Nishiyama J, Miura E, Mizushima N, Watanabe M,
Yuzaki M. Aberrant membranes and double-membrane structures accumulate in the axons of Atg5-null Purkinje cells before neuronal death. Autophagy 2007; 3:591-6; PMID:17912025
23. Vicario-Abejón C, Yusta-Boyo MJ, Fernandez-Moreno C, de Pablo F. Locally born olfactory bulb stem cells proliferate in response to insulin-related factors and require endogenous insulin-like growth factor-I for differentiation into neurons and glia. J Neurosci 2003; 23:895-906; PMID:12574418
24. Vergaño-Vera E, Yusta-Boyo MJ, de Castro F, Bernad A, de Pablo F, Vicario-Abejon C. Generation of GABAergic and dopaminergic interneurons from endogenous embryonic olfactory bulb precursor cells. Development 2006; 133:4367-79; PMID:17038521; http://dx.doi.org/10.1242/dev.02601
25. Otaegi G, Yusta-Boyo MJ, Vergano-Vera E, Mendez-Gomez HR, Carrera AC, Abad JL, et al. Modulation of the PI 3-kinase-Akt signalling pathway by IGF-I and PTEN regulates the differentiation of neural stem/ precursor cells. J Cell Sci 2006; 119:2739-48; PMID: 16787946; http://dx.doi.org/10.1242/jcs.03012 26. Lemasson M, Saghatelyan A, Olivo-Marin JC, Lledo
PM. Neonatal and adult neurogenesis provide two distinct populations of newborn neurons to the mouse olfactory bulb. J Neurosci 2005; 25:6816-25; PMID: 16033891; http://dx.doi.org/10.1523/JNEUROSCI. 1114-05.2005
27. Marín O, Rubenstein JL. Cell migration in the forebrain. Annu Rev Neurosci 2003; 26:441-83; PMID:12626695
28. Vergaño-Vera E, Mendez-Gomez HR, Hurtado-Chong A, Cigudosa JC, Vicario-Abejon C. Fibroblast growth factor-2 increases the expression of neurogenic genes and promotes the migration and differentiation of neurons derived from transplanted neural stem/progenitor cells. Neuroscience 2009; 162:39-54; PMID:19318120; http://dx.doi.org/10.1016/j.neuroscience.2009.03.033 29. Hinds JW. Autoradiographic study of histogenesis
in the mouse olfactory bulb. I. Time of origin of neurons and neuroglia. J Comp Neurol 1968; 134:287-304; PMID:5721256; http://dx.doi.org/10.1002/cne. 901340304
30. Wu YT, Tan HL, Shui G, Bauvy C, Huang Q, Wenk MR, et al. Dual role of 3-methyladenine in modulation of autophagy via different temporal patterns of inhibition on class I and III phosphoinositide 3-kinase. J Biol Chem 2010; 285:10850-61; PMID:20123989; http://dx.doi.org/10.1074/jbc.M109.080796 31. Guillemot F. Spatial and temporal specification of
neural fates by transcription factor codes. Development 2007; 134:3771-80; PMID:17898002; http://dx.doi. org/10.1242/dev.006379
32. Aymard E, Barruche V, Naves T, Bordes S, Closs B, Verdier M, et al. Autophagy in human keratinocytes: an early step of the differentiation? Exp Dermatol 2010; 201120:263-8; PMID:21166723
33. Di Bartolomeo S, Nazio F, Cecconi F. The role of autophagy during development in higher eukaryotes. Traffic 2010; 11:1280-9; PMID:20633243; http://dx. doi.org/10.1111/j.1600-0854.2010.01103.x 34. Rodríguez-Muela N, Germain F, Marino G, Fitze PS,
Boya P. Autophagy promotes survival of retinal ganglion cells after optic nerve axotomy in mice. Cell Death Differ 2012; 19:162-9; PMID:21701497; http://dx.doi.org/10.1038/cdd.2011.88
35. Mellén MA, de la Rosa EJ, Boya P. Autophagy is not universally required for phosphatidyl-serine exposure and apoptotic cell engulfment during neural develop-ment. Autophagy 2009; 5:964-72; PMID:19587526; http://dx.doi.org/10.4161/auto.5.7.9292
36. Qu X, Zou Z, Sun Q, Luby-Phelps K, Cheng P, Hogan RN, et al. Autophagy gene-dependent clearance of apoptotic cells during embryonic development. Cell 2007; 128:931-46; PMID:17350577; http://dx.doi. org/10.1016/j.cell.2006.12.044
37. Komatsu M, Waguri S, Ueno T, Iwata J, Murata S, Tanida I, et al. Impairment of starvation-induced and constitutive autophagy in Atg7-deficient mice. J Cell Biol 2005; 169:425-34; PMID:15866887; http://dx. doi.org/10.1083/jcb.200412022
38. Tsukamoto S, Kuma A, Mizushima N. The role of autophagy during the oocyte-to-embryo transition. Autophagy 2008; 4:1076-8; PMID:18849666 39. Boland B, Nixon RA. Neuronal macroautophagy: from
development to degeneration. Mol Aspects Med 2006; 27:503-19; PMID:16999991; http://dx.doi.org/10. 1016/j.mam.2006.08.009
© 2012 Landes Bioscience.
Do not distribute.
40. Komatsu M, Wang QJ, Holstein GR, Friedrich VL, Jr., Iwata J, Kominami E, et al. Essential role for autophagy protein Atg7 in the maintenance of axonal homeostasis and the prevention of axonal degeneration. Proc Natl Acad Sci USA 2007; 104:14489-94; PMID:17726112; http://dx.doi.org/10.1073/pnas.0701311104 41. Tomoda T, Bhatt RS, Kuroyanagi H, Shirasawa T,
Hatten ME. A mouse serine/threonine kinase homo-logous to C. elegans UNC51 functions in parallel fiber formation of cerebellar granule neurons. Neuron 1999; 24:833-46; PMID:10624947; http://dx.doi.org/10. 1016/S0896-6273(00)81031-4
42. Chin TY, Kao CH, Wang HY, Huang WP, Ma KH, Chueh SH. Inhibition of the mammalian target of rapamycin promotes cyclic AMP-induced differentiation of NG108-15 cells. Autophagy 2010; 6:1139-56; PMID: 20935515; http://dx.doi.org/10.4161/auto.6.8.13564 43. Baerga R, Zhang Y, Chen PH, Goldman S, Jin S.
Targeted deletion of autophagy-related 5 (atg5) impairs adipogenesis in a cellular model and in mice. Autophagy 2009; 5:1118-30; PMID:19844159; http://dx.doi.org/ 10.4161/auto.5.8.9991
44. Tolkovsky AM. Mitophagy. Biochim Biophys Acta 2009; 1793:1508-15; PMID:19289147; http://dx.doi. org/10.1016/j.bbamcr.2009.03.002
45. Nishida Y, Arakawa S, Fujitani K, Yamaguchi H, Mizuta T, Kanaseki T, et al. Discovery of Atg5/Atg7-independent alternative macroautophagy. Nature 2009; 461:654-8; PMID:19794493; http://dx.doi.org/10.1038/ nature08455