Alma Mater Studiorum – Università di Bologna
Dottorato di Ricerca in Tecnologie
dell’Informazione
Ciclo XXVII
Settore concorsuale di afferenza: 09/E3 Settore scientifico disciplinare: ING-INF/01
NANO-POWER INTEGRATED
CIRCUITS FOR ENERGY HARVESTING
Tesi di dottorato di
MICHELE DINI
Coordinatore Dottorato:
Relatori:
Prof. CLAUDIO FIEGNA
Prof. ALDO ROMANI
Prof. MARCO TARTAGNI
Abstract
The energy harvesting research field has grown considerably in the last decade due to increasing interests in energy autonomous sensing systems, which require smart and efficient interfaces for extracting power from energy source and power management (PM) circuits. This thesis investigates the design trade-offs for minimizing the intrinsic power of PM circuits, in order to allow operation with very weak energy sources. For validation purposes, three different integrated power converter and PM circuits for energy harvesting applications are presented. They have been designed for nano-power operations and single-source converters can operate with input power lower than 1 μW.
The first IC is a buck-boost converter for piezoelectric transducers (PZ) implementing Synchronous Electrical Charge Extraction (SECE), a non-linear energy extraction technique. Moreover, Residual Charge Inversion technique is exploited for extracting energy from PZ with weak and irregular excitations (i.e. lower voltage), and the implemented PM policy, named Two-Way Energy Storage, considerably reduces the start-up time of the converter, improving the overall conversion efficiency.
The second proposed IC is a general-purpose buck-boost converter for low-voltage DC energy sources, up to 2.5 V. An ultra-low-power MPPT circuit has been designed in order to track variations of source power. Furthermore, a capacitive boost circuit has been included, allowing the converter start-up from a source voltage VDC0 = 223 mV. A nano-power programmable linear regulator is also included in
order to provide a stable voltage to the load.
The third IC implements an heterogeneous multisource buck-boost converter. It provides up to 9 independent input channels, of which 5 are specific for PZ (with SECE) and 4 for DC energy sources with MPPT. The inductor is shared among channels and an arbiter, designed with asynchronous logic to reduce the energy consumption, avoids simultaneous access to the buck-boost core, with a dynamic schedule based on source priority.
Contents
Abstract ... i
Contents ... iii
Chapter 1 Introduction ... 1
1.1 Energy Harvesting ... 1
1.2 Energy Sources and Models ... 3
1.3 Energy Harvesting Interfaces ... 5
1.3.1 Synchronous Electrical Charge Extraction ... 5
1.3.2 DC-DC Converters ... 7
1.4 Multi-source Energy Harvesting ... 9
1.5 Thesis Organization ... 11
Chapter 2 Energy Aware Circuital Blocks ... 13
2.1 Bias generation and Under-Voltage Lock-Out ... 13
2.2 Comparators ... 15
2.3 Enhanced Negative Voltage Converter ... 17
2.4 Higher Supply ... 18
2.5 Peak Detector ... 19
Chapter 3 Piezoelectric Energy Harvesting ... 21
3.1 Residual Charge Injection ... 21
3.2 Two-Way Energy Storage Policy ... 27
3.3 Architecture of Single Source SECE Converter ... 31
3.4 Experimental Results ... 39
3.4.1 Intrinsic energy consumption ... 40
3.4.2 TWS performance improvement ... 42
3.4.3 Conversion efficiency ... 43
Chapter 4 Low Voltage DC Energy Harvesting ... 47
4.1 Architecture of Single Source Low Voltage DC Converter ... 47
4.2 Main Converter... 49
4.2.1 Two-way Energy Storage Policy ... 50
4.2.2 Maximum Power Point Tracking ... 51
4.2.3 Energy Extraction Cycle ... 53
4.2.4 Logic controller ... 54
4.3 Low Voltage Start-up ... 55
4.4 Output Regulation ... 58
4.5 Experimental Results ... 59
4.5.1 Functional tests ... 60
4.5.2 Quiescent current ... 60
4.5.3 Efficiency ... 61
4.5.4 Energy per conversion cycle ... 63
4.5.5 Minimum and maximum input power ... 63
4.5.6 Start-up Circuit ... 64
4.5.7 Low Drop-out Regulator ... 66
4.5.8 Results Discussion ... 67
Chapter 5 Heterogeneous Multisource Energy Harvesting ... 69
5.1 Architecture... 69
5.2 PZ Channels Interfaces ... 73
5.3 DC Channels Interfaces ... 74
5.4 Buck-boost Converter ... 77
5.5 Arbitering of Multiple Sources ... 80
5.6 Analysis of Maximum Input Power ... 82
5.7 Experimental Results ... 85
5.7.3 Dynamic consumption ... 90
5.7.4 Input power boundaries ... 92
5.7.5 Summary ... 92
Conclusions ... 95
Chapter 1
Introduction
1.1 Energy Harvesting
In the last decade, the research interest in the energy harvesting field has grown considerably. Researches and industries are working on technologies able to supply micro-systems and sensing devices from environmental energy, thus enabling life extension of batteries. Another important aspect is the possibility of designing self-powered battery-less circuits, such for example the SSHI interface in [1] or the SECE circuit in [2], consuming only few μA and exploiting vibrational energy harvesting. This aim is particularly attracting, since replacing or recharging batteries is often problematic, if possible at all. The most frequently envisaged applications include monitoring of physiological parameters [3], long-term environmental sensing [4], structural health monitoring [5],[6], and industrial automation [7]. At the present time, most portable devices rely on electrochemical cells, and the potential of energy harvesting is still far from being fully deployed. One of the main hurdles is the difficulty of achieving a positive power budget on the energy harvesting interface, especially in size-constrained systems. Since energy transducers and materials deliver limited power densities down to few µW/cm2 [8], the available power is reduced as system geometries shrink.
On the other hand, the baseline system consumption is set by the intrinsic consumption of the power converter and by the stand-by consumption of application circuits. In fact, in order to harvest as much energy as possible, the power converter should always be enabled. Disengaging from typical battery constraints (e.g. charging, leakage, temperature limitations, degradation over time, replacement) can be the starting point for self-powered pervasive sensing and monitoring applications. Electrical charge, and thus energy, is usually stored on low-leakage capacitors sized according to the application and the actual load requirements. In many targeted
applications of wireless sensor networks this constraint requires the use of supercapacitors [9], fostered by significant advances towards the reduction of geometries [10] and leakage currents [11]. On the other hand, the use of large capacitances in resonant power converters such as the previously mentioned ones, combined with the further constraint of designing micro-power control circuits with limited operating frequencies and bandwidths, may lead to low electrical quality factors, as it will be pointed out later on.
Recently, several integrated power converters for energy harvesting [12]–[15] have been proposed with power consumption in the order of hundreds of nW. Silicon implementation of converters allows, besides a smaller footprint and more complex and fully customizable architectures, a reduction of power of at least an order of magnitude with respect to optimized discrete components realizations [16]. Indeed, specific energy aware circuital design techniques, converter topology and silicon implementation allow the exploitation of ultra-low power sources with a positive output energy budget. The use of such sources, and of the associated power levels, would be prevented by a design using discrete components and the harvesting effectiveness is likely to be compromised.
A growing effort is also oriented to the miniaturization of transducers, key aspect for unobtrusive applications [17]. This means that energy harvesting systems and applications have to deal with very limited power levels, since optimized electro -mechanical designs with macro-scale transducers yield power densities as low as 10-100 μW/cm3 in many practical cases [8]. In addition, the current trend is to further shrink down transducers with MEMS fabrication processes [18], [19], with available power levels down to few μW. For this reason, a special care has to be put in designing efficient electrical interfaces for power conversion and energy storage with very low intrinsic consumption and power losses. Another possibility is offered by the use of microelectronic substrates: on-chip photovoltaic generation with integrated photodiodes [20][21]. In this case, a power converter circuit should manage source voltages as low as few hundreds mV and power levels up to tens of µW. A nanowire solar cells power battery charger with reconfigurable circuit power and clock speed
In order to go beyond the µW barrier, it becomes essential to exploit the modern microelectronic processes and their very low parasitics, along with the development of specific nano-power circuit design techniques. Many integrated power converters have been reported in literature which are tailored for different types of energy transducers. As an example, in [23][24] an integrated power management circuit for DC sources is reported to draw 330 nA with the ability of handling battery charging and cold start-up from input voltages down to 300 mV. Other reported solutions [25][26], with comparable power consumption, are able to deal with multiple types of transducers. In all the above cases, boost (or buck-boost) switching power conversion has been adopted, and FOCV MPPT was assumed to be a good compromise between converted and consumed power. An alternative buck switching converter with dynamic on-off time calibration and a regulated output voltage was reported to consume 217 nW [27].
However, differently from boost converters, buck topologies are not suitable for long-term energy accumulation. They are intrinsically limited in terms of voltage achievable on the output capacitor. Other types of power converter circuits based on inductor-less charge pumps [28] have also been proposed with comparable intrinsic consumption and activation voltages down to 150 mV [29]. On the other hand, the efficiency of charge pumps is typically lower than that of switching converters, and reaches values up to 72% in the latter case. The problem of activation voltage is of particular relevancy in thermoelectric energy harvesting, as the TEG voltage can be as low as some tens of mV. However, once the converter has started, e.g. with an application specific cold start circuit as in [23] or with the use of a charged battery as in [30], the input operating voltage can be considerably lowered as long as the power budget remains positive.
1.2 Energy Sources and Models
Several environmental energy sources have been widely investigated in the last decade as vibrations [31], light [32], heat [33] or electromagnetic radiation from communication equipment [34]. All these energy types can be successfully exploited
with appropriate transducers, e.g. piezoelectric transducers (PZs) for generating power from vibrations, photovoltaic (PV) cells for sunlight or artificial indoor light, thermoelectric generators (TEGs) for heat flows in wearable and industrial applications, rectifying antennas for incident electromagnetic waves (RF). The evaluated sources differs in their power density [35] and in their output characteristics. Two groups of sources have been identified, and each of them has its peculiar characteristics. Electrical models for such sources exist and are described in the following sections. For clarity, the sources have been divided into two categories: a) capacitive AC sources, e.g. a PZ, and b) DC sources, considering PV cells, RF rectennas, TEGs.
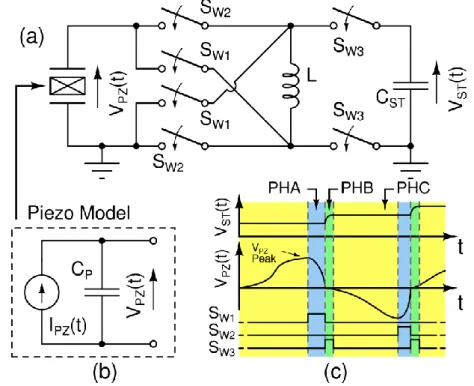
The model used for a PZ is shown in Fig. 1 (a). It is a simplification of [36] in which the electro-mechanical circuit models direct and indirect piezoelectric effect. The model used in this thesis, shown Fig. 1 (a), does not account for indirect piezoelectric effect and thus the damping due to energy extraction is neglected. However, even if damping is neglected, it provides a simple and good representation of PZ. In case of single sinusoidal excitation of the PZ, the following equation holds, in which VP0 is the open circuit amplitude and f is the frequency of vibrations:
t V
ft VPZ P0sin 2 . (1.1) 2 0 2 0 max , 2 1 2 P P P P PZ T C V fC V P (1.2)In order to provide a reference, input power PPZ,max available from the PZ, in case
of sinusoidal excitation, can be expressed as the energy on CP at each peak of VPZ in a
period T divided by T. The expression of PPZ,max is shown in (1.2).
The model used to represent a DC source is shown Fig. 1 (b). It is composed by a time variable DC voltage source VDC0 and a series resistance RS. This model is suited
for TEGs and, with some approximations, for RF rectennas [37]. The maximum power that can be extracted is expressed in (1.3) and the voltage VMPP at maximum
power point (MPP) is VMPP = VDC0/2. The model of PV cells is different but, as will
be shown in the following chapters, they can be assimilated to DC sources. Even the MPP is different and (1.3) is not valid in this case.
S DC DC S DC R V V R P 4 2 1 2 0 2 0 max , . (1.3)
1.3 Energy Harvesting Interfaces
1.3.1 Synchronous Electrical Charge Extraction
Several non-linear approaches have been developed for extracting energy from vibrations with piezoelectric transducers. Converters range from classical full wave rectifiers with an integrated boost converter [38] or with a switched capacitor converter [39] to complex waveform tracking algorithms [1], [14], [40]–[43]. Among the latter category, it is worth to mention synchronous electrical charge extraction (SECE) [16], [40]. The SECE converter is depicted in Fig. 2 (a), and is substantially a buck-boost converter exploiting non-linear techniques and resonant circuits. Among the advantages of SECE, it can be highlighted that: (a) the offset introduced by charge extraction increases the peak-to-peak voltage up to two times; (b) power conversion tracks, by definition, the input vibrations and generally outperforms passive interfaces, especially with irregular and weak vibrations; (c) differently from other approaches, such as passive interfaces [44], synchronized switch harvesting on inductor (SSHI) [1], active energy harvesting [43],[44] and single-supply pre-biasing
[47], the power source is kept disconnected from the load. This makes conversion efficiency quite constant in a wide range of conditions. The PZs have been modelled
with the first-order capacitive model shown in Fig. 2 (b), which is a reasonable approximation in most applications. In general, when PZs have a high electro-mechanical coupling, a more complex representation of a PZ [2] should be adopted in order to account for the mechanical damping induced by the power converter. However, for the purposes of this work, the model of a PZ will be satisfactorily composed by the vibration driven current source IPZ(t) connected in parallel with the
transducer capacitor CP. With SECE, energy is extracted synchronously with each
peak of VPZ(t) as shown in Fig. 2 (c). Three phases can be distinguished in an energy
conversion cycle, namely PHA, PHB and PHC. The latter phase PHC, is an idle phase between two energy extraction cycles. In the first phase PHA, energy is transferred from CP to the magnetic field in the inductor L. In the second phase PHB, energy is
Fig. 2. (a) Circuit schematic for SECE from a PZ, (b) simplified PZ model valid for loosely coupled transducers, (c) sketch of typical waveforms, not to scale, in a SECE converter with energy extraction phases highlighted.
This doubles the peak-to-peak voltage and boosts the available energy [16]. In addition, since the output node is never directly connected to the input PZ source, the SECE converter makes energy conversion efficiency from PZs independent from the values of VPZ and VST. With respect to a bare passive diode interface, SECE requires
an external inductor and an increase of design complexity. However, it will be shown that by exploiting IC technology, the impact of design complexity on the energy consumption of the control sub-system will be extremely weak.
1.3.2 DC-DC Converters
Many energy transducers have a DC output voltage, e.g. thermoelectric generators (TEGs), photovoltaic (PV) cells, RF rectennas. A maximum power point tracking (MPPT) circuit is mandatory in order to achieve a high conversion efficiency, which is essential when input power is very limited. Fig. 3 (a) depicts a buck-boost converter in an energy harvesting application storing energy in a capacitor CST, while
Fig. 3 (b) shows a resistive model suitable to describe a generic DC source, in which RS is the internal source resistance. Since the target applications have potentially
extremely low input power levels, the buck-boost converter is expected to operate in discontinuous conduction mode. Although the accuracy of the MPPT circuit is important, the power required for the MPP computation should still be a negligible share of the available power, being the shortage of input energy one of the main constraints. In this manuscript, as will be shown in Chapter 4, a fractional open circuit voltage technique [23] (FOCV) has been chosen for MPPT. It is a trade-off between accuracy and power absorption, as the FOCV is an a priori technique not requiring on-the-fly computations. Accuracy relies on the assumption that the MPP is predictable and depends only on the open circuit voltage VDC0, which is true for
purely resistive sources as TEGs and an acceptable approximation for PV cells [48]– [50]. The MPP voltage is computed as VMPP = βVDC0, where β depends on the type of
transducer: for TEGs and resistive DC sources β = 0.5, while for PV cells literature reports values ranging from 0.71 to 0.82 [48], [49], so that β = 0.75 was conservatively chosen in order to prevent operation of the PV cells in the region in which the output current is exponentially decreasing.
Fig. 3 (c) illustrates typical waveforms during energy extraction from a generic DC source. Cb is an energy buffer used to reduce the switching frequency of the
converter as dynamic power consumption is proportional to switching frequency. VMPP is kept as a reference and VDC is kept into a ±ΔVhystDC range, which is the
hysteresis of the comparator that detects the conditions for starting and stopping the energy extraction cycle. As in SECE conversion, three phases PHA, PHB and PHC can be distinguished: in PHA energy is transferred into L and VDC then decreases; in
PHB the energy is transferred from L to CST; PHC, which overlaps PHB, is an idle
state in which the DC source charges Cb.
Fig. 3. (a) Circuit diagram for DC-source harvesting; (b) model of a generic resistive DC source; (c) sketch of typical waveforms, not to scale, in a DC harvesting converter, with energy extraction phases highlighted and MPPT references.
1.4 Multi-source Energy Harvesting
Typically, the available power in an energy harvesting scenario is in most cases constrained down to few μW or less [8], [51]. Hence, in order to achieve sufficient efficiency it is necessary to couple energy transducers with specific power conversion and management circuits [52]–[55], with very low power consumption. In this context, many energy conversion techniques and circuits have been developed in the last years with the main purpose of enabling autonomous wireless sensing applications.
One specific issue of energy harvesting, in addition to energy shortage, is the irregularity of energy flow. As an example, some energy sources are typically available only during specific parts of a day (e.g. sunlight) or undergo significant variations of intensity over time (e.g. vibrations from industrial machinery). When the involved power levels are very low and irregular, the combination of multiple energy sources of the same (e.g. only PZ) [16], [44], [56] or different types (e.g. TEGs and PV or other combinations) [57]–[60], is an effective solution for increasing the overall input power and the energetic reliability of the system. A source multi-type approach for energy harvesting is also a typical scenario for wearable electronics applications [33], [51], [61] in which energy can be extracted from ambient light, body movements and heat, and RF energy from communication devices. Another area of interest for multi-source harvesting is the integration of both the converter and the transducer in the same package or on the same silicon die as shown in previous works with MEMS piezoelectric transducers [54], [62], micro fabricated thermoelectric devices [63] and solar cells [64].
Joining multiple energy flows is not a trivial task. The connection of N independent energy harvesters to a common output node VST through a unidirectional
switch, e.g. a diode, is the simplest method [44], [57], [59], [60], also known as “power ORing” and illustrated in Fig. 4 (a). The main drawback of this topology is the “winner takes it all” nature: VST is generated by the energy harvester with the
highest output voltage, excluding or limiting the contributes, in terms of power, from other harvesters. A more efficient method is to use a buck-boost converter to join N energy sources with their specific interface [16], [25] to the energy storage CST as in
CST. On the other hand, an additional interface circuit is needed to match the
characteristics of both the source output and the converter input. Furthermore, a controller must ensure that no source can be ever connected with a low impedance path to any other source, wasting energy. The use of a single shared inductor in a multi-source converter for energy harvesting has been previously reported [16], [25], [56], [65]. The inductor can be time shared because the converter typically operates in discontinuous conduction mode (DCM) due to the very low involved power levels.
The low harvestable power requires converter circuitry to draw a small current for its operations for a matter of conversion efficiency. This is a non-trivial task with off-the-shelf ICs and discrete components due to their higher intrinsic parasitic capacitance and their higher power consumption with respect to an integrated optimized custom design. An integrated solution achieves at least a reduction of an order of magnitude in power consumption in comparison to advanced PCB implementations [16], [60] and achieves a considerable decrease of system size as well.
Fig. 4. (a) Basic method for combining energy harvesters output. (b) More efficient method for multi-source energy harvesting.
Differentiation allows to extract sufficient energy for system operation in a wider range of situations. As a first example, in [66] an airplane structural health monitoring system is powered by vibrations and thermal gradients, since batteries would not be allowed because of harsh environmental conditions. Such systems usually operate with a very low duty cycle [67], [68], with only some activations per hour or day while energy is slowly stored, for instance in low leakage super-capacitors. Another possibility for multi-source energy harvesting is the use of multiple differently sized piezoelectric transducers in order to exploit broadband vibrations [44] or different types of human movements [69]. Other attracting applications include environmental or structural monitoring [67], [68], wearable computing and sensing powered by human body [69] or electromagnetic waves [70], implantable bio-systems [71], [72], localization and positioning [73].
The design of a multisource power converter for energy harvesting, discussed in this thesis in Chapter 5, shows a set of circuital solutions and power reduction techniques which are suitable for ultra-low-power energy harvesting from multiple and heterogeneous sources. The focus is on the energy efficiency of the converter itself and on the achieved static consumption, which is considerably lower than in recent works on switching converters [21],[23] and active rectifiers [13], [15], [75]. Such value has been obtained with an energy aware design of each converter block. On the whole, such an optimized IC is suitable for applications in battery-less systems powered by weak and intermittent environmental power sources, which cannot individually sustain the electronic system under test.
1.5 Thesis Organization
As pointed in the previous sections, the design of efficient electrical interfaces for energy harvesting assumes a great importance as it is the basic block of an energy autonomous system. During the Ph. D. course, three different integrated converters has been designed and manufactured in a 0.32 μm BCD technology provided by STMicroelectronics. The design was aimed to improve the state-of-the-art of
converters for energy harvesting with a particular emphasis on circuital solutions addressed to the reduction of intrinsic consumption of the converter.
Chapter 2 presents the basic building blocks designed for the converters. Each of them has been designed in order reduce the static current into the tens of nA while preserving functionality and solve some of the problems associated to battery-less systems without a fixed and stable available voltage.
The first designed converter is presented in Chapter 3. It is a power converter for PZ which performs SECE, a non-linear energy extraction technique, with Two-Way Energy Storage (TWS) which allows for a faster start-up phase in comparison with standard power routing.. In addition, RCI is performed in order to improve the available input power and exploit weak vibrations (i.e. providing low voltage)
In Chapter 4 a converter for low voltage DC energy sources is described. The IC embeds a self-supplied buck-boost converter with peak efficiency of 77.1% and the same TWS policy presented in Chapter 3. Moreover, a dedicated start-up circuit in introduces in order to allow the start-up from source voltage as low as 223 mV and a low drop-out (LDO) regulator to provide a stable voltage to the load..
Finally, Chapter 5 describes the design and the experimental validation of a buck-boost converter for energy harvesting applications from multiple and heterogeneous energy sources. The converter features 9 independent channels and can handle from 1 up to 9 energy sources. The inductor is time-multiplexed among the active channels. Access conflicts are prevented by a logic arbiter which handles the requests and creates a queue in case of simultaneous requests. The static current is 431 nA, less than 48 nA per source, with a measured peak efficiency of 89.6%.
Chapter 2
Energy Aware Circuital Blocks
The typical input power available from energy sources is limited and ranges from some μW to some tens of μW. The electronic interface should provide an high conversion efficiency and a very low static consumption. Both this aspects are important and related each other. In case of irregular or intermittent energy sources, the static consumption minimization, in the range of tens of nA or less, is important. It prevents the waste of a consistent part of the previously harvested energy only for the interface quiescence.
For this reason, a set of energy aware circuital blocks has been developed as the building blocks of the proposed converters. The aim is the reduction of the static consumption of each block, compatibly with the requirement of the system in which they are used. In case the static consumption could not be limited to acceptable value, a dynamic power management policy has been adopted and energy hungry block are activated only for the minimum required time.
2.1 Bias generation and Under-Voltage Lock-Out
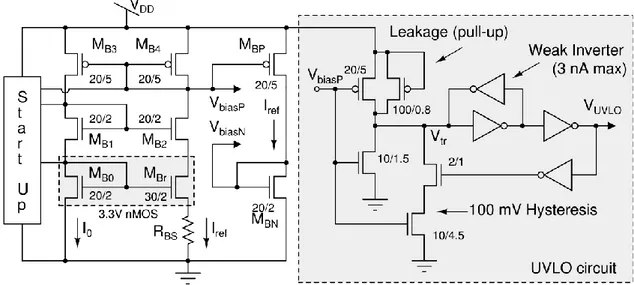
The generation of a stable nano-current reference is crucial for operations in the μW range. The left part of Fig. 5 shows the designed circuit diagram for the generation of Iref, set to 16 nA. It is based on a classic supply independent current
reference [76] but it is biased in the sub-threshold region and a cascode current mirror (MB1, MB2) has been added in order to increase the independence of Iref with respect to
the supply voltage VDD. Current I0 and Iref are set by the resistor RBS and their value
can be expressed as follows:
BS T ref R V I I 0 ln , (2.1)
where ρ is the ratio between the shape factors of MBr and MB0 and VT is the thermal
voltage and can be obtained by equating the sub-threshold current expression of MBr
and MB0. In this design RBS=687 kΩ is an on-chip polysilicon resistor. The bias
generator circuit outputs the voltage references VbiasP and VbiasN which are used by all
analog sub-circuit in the IC. Distributing reference voltage instead of reference currents for biasing allows the reduction of quiescent current required by biasing circuits down to 48 nA.
The UVLO circuit diagram is shown on the right of Fig. 5. An hysteresis of about 100 mV is provided in order to prevent switching around VDDmin value. The UVLO
circuit draws 16 nA. By changing the size of the two n-channel MOSFET with the gate connected to VbiasP, (for triggering at VDD = 1.4 V the sizing is shown in Fig. 5) it
is possible to change the value of VDD at which the UVLO triggers. In the next
chapters, different UVLO circuits will be shown. They keep the same basic structure as shown in Fig. 5, and only the sizing of the first stage is modified in order to change the triggering level (i.e. not at VDD = 1.4 V).
Fig. 5. Circuit diagram of the designed bias generation circuit (left) and of the UVLO circuit (right). The start-up block is used to prevent the undesired condition I0 = Iref = 0 A when VDD rises. The start-up circuit does not draw any static current.
2.2 Comparators
Four different nano-power comparators (circuit diagram shown in Fig. 6) with built-in hysteresis have been designed. They are all driven with the same tail current Ibias=Iref=16 nA and they differ for the input common-mode VCM voltage they can
properly sense. Differently from other realizations [41], [74], [76], the inputs of comparators are placed on transistor gates in order to show a high impedance o n the sensed nodes. Comparators (a) and (b) have nominal hysteresis Vhyst = 15 mV and (a)
has been designed for sensing voltages up to the positive rail (VDD +0.3 V, n-channel
MOSFET input pair) whereas (b) can sense down to the negative rail (GND -0.3 V, p-channel MOSFET input pair). The same applies for comparators (c) and (d), used in DC interface circuits, which have hysteresis VhystDC = 28 mV; furthermore, their tail
current can be temporarily increased through a boost input signal (BoostC or BoostD ) of about 100 nA (exact values are shown in Table I) for reducing their propagation delay only when required.
a P a P a P a P T hyst W L L W nV V 1 1 3 3 ln (2.2)
The hysteresis amount, Vhyst or VhystDC, can be obtained by solving (2.2), in which
(WP3a, LP3a) and (WP1a, LP1a) are the width and the length of the transistors transistor
MP3a and MP1a respectively (considering comparator (a) in Fig. 6). Moreover, VT is
the thermal voltage and n is the subthreshold slope parameter. Equation (2.2) has been derived in a similar fashion as shown in [77] and is valid for the MOSFETs biased in the sub-threshold region and not in strong inversion as in [77].
The comparators (a) and (b) do not have a dedicated boost input. They are used in the buck-boost converter core where a bias boost is provided at an higher level by directly increasing Ibias = Ire f= 16 nA to Ibias = 16Iref = 256 nA.
The hysteresis voltage Vhyst is the input voltage difference necessary to balance, in
comparator (a), the drain currents of MN1a and MN2a. Propagation delays obtained
TABLE I.PROPAGATION DELAYS OBTAINED FROM SIMULATION1 OF DESIGNED COMPARATORS WITH DIFFERENT BIASING CONDITIONS.
Comparator tpdLH [μs] tpdHL [μs] Biasing
Standard N (a) 9.44 11.46 IbiasA=Iref
Standard N (a) 0.74 0.76 IbiasA=16*Iref
Standard P (b) 12.97 9.98 IbiasB=Iref
Standard P (b) 0.86 0.78 IbiasA=16*Iref
DC version N (c) 10.40 12.74 IbiasC=Iref
DC version N (c) 1.34 2.02 IbiasC=7*Iref
DC version P (d) 14.26 10.86 IbiasD=Iref
DC version P (d) 1.59 1.19 I =7.66*I
Fig. 6. Circuit diagram of the four designed comparators. (a) and (b) have Vhyst = 15
mV and allow signals up to VDD and ground, respectively. (c) and (d) have
VhystDC = 28 mV, allow signals up to VDD and ground, respectively, and have an
2.3 Enhanced Negative Voltage Converter
The output voltage of a PZ is generally an AC signal with null average value requiring rectification. Negative voltage converters (NVC) have been already employed in this type of applications [43],[53] thanks to their low-drop out, which is due only to the on-resistance of MOSFETs. However, alike standard rectifiers, they have a minimum input voltage (i.e. roughly corresponding to VGS,th), thus it is
impossible to extract the whole charge on CP. Moreover, an NVC is not able to force
a current direction and cannot simply substitute a diode bridge. Fig. 7 shows the circuit diagram of the enhanced NVC (eNVC) circuit designed to overcome such limitation. Along a standard NVC core (MV0-MV3), four actively controlled switches
(MVe0-MVe3) have been added. They are activated in pairs (by VAON or VBON) only
during energy extraction phases (VCONVACTIVE signal is high) and allow the whole
charge on CP to be extracted (i.e. until VPZ=0 V). The comparator CMPNVC select
which pair must be switched on by reading the polarity of VPZ (VPZA and VPZB). The
eNVC circuit draws 32 nA or 16 nA, depending on the output state of comparator
CMPNVC and thus, as the AC voltage of a PZ has as many positive half-waves as
negative ones, an average of 24 nA can be considered in a realistic scenario.
2.4 Higher Supply
As an autonomous system, the converter relies only on harvested energy. Then, no stable and regulated voltage is available. However, since the IC manages many sources with different voltage levels, several circuit blocks including the gate drivers of MOSFETs require to be supplied or driven with the highest possible voltage in order to operate properly. Thus, a very frequently used block is the Higher Supply (HS) circuit, depicted in Fig. 8. The output VHH is selected as the higher voltage
among VHA, VHB and, with a limited current of 12Iref, VDD. Transistors Mh1 and Mh2
form a standard bulk-regulation circuit, whereas Mh3…5 (which are low VGSth
transistors) and the current generator have been added to improve the output voltage level for very similar input voltages.
Transistors Mh3 and Mh4, which have a higher leakage current, have been sized
with a trade-off between performance (i.e. V voltage drop with respect to V or
nA in worst bias conditions. Fig. 9 shows the improvement brought by the added circuitry in the limitation of the voltage drop on VHH for crossing inputs. Transistors
Mh5 and the current generator are mainly useful for analog circuitry requiring low
current (i.e. comparators) on slowly variable signals (e.g. PZ voltage).
2.5 Peak Detector
The SECE converter requires the tracking of VPZ(t) and the detection of maxima
and minima in order to trigger energy extraction cycles. Fig. 10 shows the circuit diagram of the peak detector included in each PZ interface circuit. A design issue is the PZ voltage which can reach values significantly higher than VDD. To overcome
this issue, the supply voltage VHH is selected as the highest between VNVC and VDD as
described above. The first stage is composed by three diode connected transistors which produce VNVCds, a down-shifted version of the input voltage VNVC (i.e. the
rectified version of VPZ), and force it to be in the allowed common mode range (i.e.
VHH+0.3 V) of both the input pair Mk1-Mk2 and the input pair of comparator CMPK.
Fig. 9. Simulated output voltage VHH of an HS circuit for VA sweeping and
The second stage generates Vtrack as a copy of VNVCds. Ctrack can only be charged by
Mk6 and thus allows the comparator to detect a voltage maximum (peak) as soon as
Vtrack>VNVCds+Vhyst. The built-in comparator hysteresis increases the noise margin and
prevents false triggering. The quiescent current drawn by the peak detector is 32 nA. Measurements showed that the circuit is able to track input signals up to 1 kHz which is a quite high frequency for macro-scale PZ and for typical vibrations in industrial or transportation environments [79]. In addition, it offers improved performance with respect to other discrete [16] and integrated implementations [80].
Chapter 3
Piezoelectric Energy Harvesting
The first presented interface is a power converter for piezoelectric energy harvesting. It implements a self-supplied nano-power SECE converter. Moreover, two major improvements with respect to standard SECE have been included. The first is Residual Charge Inversion (RCI) and is presented in Chapter 3.1. The RCI allows the increment of the available energy on the transducer capacitance by inverting the residual charge on CP, which is due to the minimum operating voltage of the
employed rectifier (i.e. a NVC in this case), after an energy extraction cycle. The second improvement is the use of a dual power routing topology. Of the two energy storage capacitors, one is for supplying the converter itself, and the second for the bulk energy storage (i.e. for providing power to the load). This power management policy has been named Two-Way Energy Storage (TWS) and is discussed in Chapter 3.2. The benefit of this policy is a reduction of the time spent by the converter in passive mode (i.e. a faster start-up time). As the converter is brought in active mode, SECE is performed, which is a far more efficient energy conversion process. In Chapter 3.3 the converter architecture is analysed, with particular emphasis on the power reduction strategies, and in Chapter 3.4 the experimental results on manufactured devices are presented and discussed in relation with the analysis performed in the previous sections of the chapter.
3.1 Residual Charge Injection
A careful design of the input interface is mandatory in order to achieve high efficiencies while extracting charge from piezoelectric transducers, especially when low voltages are involved. The more efficient this process is, the higher the duty cycle of operation of the final application, e.g. data acquisition and wireless transmissions, will be. In energy harvesting systems, energy should be collected as long as it is available from the environmental sources. For this reason, a buck-boost
topology is a suitable candidate as input stage. In fact, in passive rectifiers and step -down converters the output voltage cannot exceed that on the input whereas it is likely required to extract energy in the opposite situation. Among buck-boost topologies, piezoelectric transducers subject to weak and irregular vibrations are efficiently handled with SECE, which is also compatible with micro-power control circuits [2]. In self-powered implementations of SECE, since piezoelectric voltages often switch from negative to positive voltages, the difficulty of generating dual voltage supplies is usually overcome by using input rectifier stages, whose voltage drops, however, limit efficiency in case of low input voltages. Energy conversion, as mentioned in Section I and shown in Fig. 1, is activated on local maxima of the rectified voltage. Energy is first extracted from the piezoelectric capacitance CP with
a switched inductor L1 forming a L1-CP resonant circuit. Then, energy is transferred
from L1 into a storage capacitor CO by forming a second L1-CO resonant circuit. Since
the L1-CO resonant circuit is never connected to the piezoelectric transducer, a
measure of the capability of a SECE interface to extract power is given by the energy stored in the inductor at the end of the first phase.
Fig. 11. Schematic, voltage transfer characteristic and transient behavior during SECE with: (a) BR; (b) NVC.
Let us suppose that VP(t) = VP0 sin(2ft) is the voltage generated across the
transducer in open circuit, where f is the vibration frequency. If a full-wave bridge rectifier (BR) is adopted (Fig. 11a) as input interface, in case of conduction the rectified voltage is VR(t) = |VP(t)| – 2V where V is the threshold voltage of a single
diode and VR(t) ≥ 0. When SECE is activated on a voltage peak, the transducer is
discharged through the rectifier and the inductor until VR(t) = 0. Then, the rectifier
turns off and a residual voltage ±2V is left on VP(t). From this condition, since a
peak-to-peak elongation produces a voltage variation 2VP0 on the transducer, a
maximum voltage 2(VP0 – V) can be reached on VP(t).
If is defined as = V/VP0, with 0 < < 0.5, the energy stored in L1 at the end of
the first phase can be computed by solving the differential equations of the L1-CP
circuit, as demonstrated in [16]: , ) 2 1 ( 2 20 2 /( ) ) ( C V e 01 ELBR P P (3.1)
where = 2L1/R1, with R1 assumed to be the resistance of switches, inductor and
transducer of L-CP, and 011L1CP .
In case a NVC is used (Fig. 11b), VR(t) = VP(t) as long as |VP(t)| > V, where V is
the absolute value of the highest MOSFET threshold voltage. With respect to diodes, MOSFETs offer negligible voltage drops and energy losses. However, on the activation of SECE, during the discharge of VP(t), the NVC turns off when
|VP(t)| = V. For lower voltages, conduction may still occur through the FET body
diodes, which would introduce significant losses, so that energy extraction should safely stop at VT. Then, at the end of the subsequent elongation, a maximum absolute
voltage 2VP0 – V will be reached on VP(t).
Defining = VT/VP0, with 0 < < 1, the energy stored in L1 after the transducer
has discharged from 2VP0 – Vto VT can be determined:
01 2 arccos 2 2 0 ) ( 2 1 C V e E NVC P P L (3.2)In the above two cases no power is harvested for absolute input voltages lower than the minimum conduction thresholds of 2V and VT, and residual charges
|QBR| = 2CPV and |QNVC| = CPVT are left at the end of every conversion. Such residual
charge has to be first canceled during the subsequent peak-to-peak elongation before the sign of VP(t) changes.
As a term of comparison, a lossless SECE with an ideal rectifier with V = 0 (IR)
would leave no residual charge and store in L1 the following energy for a single
activation: . 2 20 /( ) ) ( C V e 01 ELIR P P (3.3)
In this section an input interface based on a NVC with residual charge inversion (RCI) is proposed and it is shown in Fig. 12. This allows to reduce energy losses through the MOSFET bridge and to remove all the charge QPP = 2CPVP0 generated in
a peak-to-peak elongation. The inversion of residual charge applies a more favorable voltage offset for the next peak-to-peak elongation. Other types of pre-biasing techniques, in which the offset charge is drawn from the output, were introdu ced in [47] and showed to significantly increase the performance. However, in case of low output voltages, e.g. when high load currents are applied, the advantages of the pre-bias are reduced. Differently, the inverted residual charge is exploited as a pre-bias, which otherwise would impact negatively output power. This approach improves the performance especially in case of low vibrations, when the input voltage is comparable to the conduction threshold and the losses would otherwise be significant. The inversion of residual charge is also performed in other synchronized switch techniques, such as for example SSHI, in which charge inversion is mostly required for keeping a rectifier bridge in a conducting state for most of the time. However, the conversion efficiency is still bias dependent. Differently, besides producing significantly higher piezoelectric voltages, performing RCI with SECE also introduces a bias independent energy conversion efficiency, because the transducer is never directly connected to the output node.
As shown in Fig. 12, with respect to SECE, an inductor L2 and two switches MN3,
MN4 are introduced. An additional signal C is activated for inverting the residual
charge left on the transducer. This is accomplished by letting the resonant circuit CP
-L2 oscillate for a half period /02, where 021/ L2CP is its resonance frequency.
This new initial offset would ideally allow to reach a higher maximum voltage 2VP0 + kV on VP(t), where k=exp(– /(02)), τ2=2L2/R2eq and R2eq is the series
resistance of L2 and of the RCI switches (MN3 and MN4 in Fig. 12). It can be found
that the energy stored in L1 after the transducer has discharged from 2VP0 + kVT to VT
is:
Fig. 12. Schematic and circuit simulations of a SECE circuit based on a NVC with the proposed RCI. Circuit simulations were performed with VP0 = 2 V, f = 50 Hz,
L1 = 10 mH, L2 = 2.5 mH, CO = 1 F. MN1..4 and MP1,2 are standard MOSFETs with |VT| = 1.3 V A zoomed view of an individual energy conversion is also shown.
2 01 2 arccos 2 2 4 1 2 0 ) ( 2 1 k k P P RCI L C V k e E (3.4)
Typical values for the components that have been considered for analytical evaluations are V0.35 V for low threshold Schottky diodes, e.g. BAT754, and
VT1.3 V for discrete MOSFETs with low gate charge and compatible with
piezoelectric voltages of up to 20 V, e.g. BSS138PW and NTR1P02T1, and VT0.7 for integrated MOSFETs available in standard 0.35 μm CMOS technologies.
Hence, in practical cases, it roughly holds that 2…3.
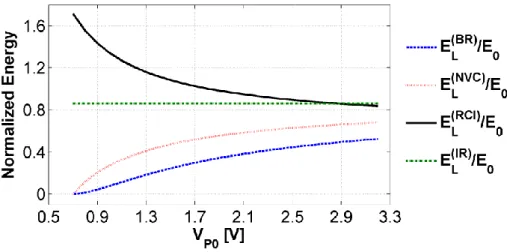
The corresponding energy ratios of (3.1), (3.2), (3.3) and (3.4) normalized to 2CPVP02, i.e. E0, are functions of δ and for a given set of circuit parameters. A
comparison plot is shown in Fig. 13. As it can be noticed, Schottky rectifiers underperform with respect to NVC whereas RCI is the best option, especially for low input voltages. However, this holds for an integrated circuit perspective. For a discrete components design, Schottky rectifiers perform better than NVC for low input voltage due to typical higher VT of MOSFET unless RCI is employed.
Fig. 13. Normalized energy (E0 = 2CPVP02) extracted from CP and stored in L1 at the
end of the first phase of SECE with different types of the input interface: full -wave bridge rectifier (BR), NVC, NVC with RCI enabled (RCI), and ideal rectifier (IR). The parameters used for the generation of the figure are: VT = 0.7 V (corresponding to a generic 0.35 μm integrated process), V = 0.35 V, C = 52 nF, L = L = 560 μH,
The OSECE topology [81] is an interesting improvement of classic SECE topology. Differently from the latter, it exploits three coupled inductors and diodes. OSECE has a lower circuit complexity (switches and their controllers) and is surely more suitable than SECE for an implementation with off-the-shelf components, although some works implementing SECE converters have been reported [16]. However, in order to improve efficiency, reduce size and costs on large volumes, an integrated solution is advisable. Several works [12], [15], [82] use active rectifiers for diodes replacement as they have lower losses and lower inverse leakage current than diodes. The command energy required for the MOSFET and its driver is very small for integrated circuits compared to PCB circuits with discrete components and, furthermore, it can be tailored on application requirements (i. e. switching frequency, turn-on delay and on-resistance). In such a perspective, an integrated version of OSECE with active rectifiers might offer better performance than the PCB solution and even outperform an integrated SECE. A drawback of active switches and rectifiers is their inability to operate without a supply and therefore a start-up mechanism is required (e.g. a secondary passive rectifier in parallel with the active one).
However, a significant difference between SECE with RCI and OSECE lie in the amount of inverted charge on the piezoelectric transducer. With SECE-RCI such amount of charge is independent from both the load and the input parameters and depends only on the characteristics of the MOSFETs employed in the NVC (i.e. their VGS,th). Differently, in OSECE the amount of inverted charge strongly depends on the
output voltage (i.e. load), transformer turns ratio and diodes characteristics. With high turns-ratio of the transformer, the inverted charge might be very low and provide a less favorable offset than SECE-RCI.
3.2 Two-Way Energy Storage Policy
A typical issue of self-powered harvesting systems exploiting active converters (i.e. not a bare BR) is the start-up time required for transition from passive to active harvesting mode. Systems with a single energy storage element [21,22,28-30] rely on
such energy reservoir both for supplying both the converter supply and the load. Since application requirements, e.g. for sustaining a wireless sensor node transmission, require a minimum amount of stored energy and a minimum voltage to enable operation, usually large capacitors or supercapacitors are used. As a consequence, a considerable amount of time ranging from seconds to hours [12], [68] may be required for switching from a passive harvesting interface to an active power conversion interface, which also require a minimum operating voltage. During this period, the efficiency of energy extraction is negatively affected. A second issue is the inability of the load to consume all the energy in the storage element without compromising the operations of the converter by bringing it back into passive mode. This limits the energy available to the load because a considerable amount of energy is locked in the storage capacitor just for keeping the output voltage high enough for enabling the power converter and without the possibility of being used by the load. In systems with a huge energy storage, e.g. a tens of mF supercapacitor, such amount of wasted energy is intolerable, especially if a second buck-boost regulator is placed between the harvester and the load with the task of generating a stable and regulated supply voltage
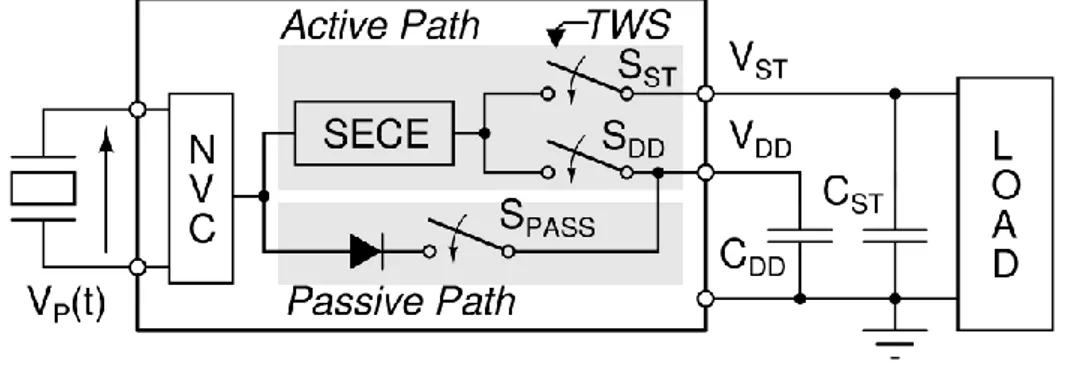
The proposed power management policy is similar to that introduced in [83]–[86] and makes use of two different capacitors, as shown in Fig. 14: the converter power supply is provided by CDD whereas the load is powered from CST. Furthermore, this
scheme, which will be referred to in this paper as two-way energy storage (TWS), allows the load to completely drain CST without affecting the operation of the active
power converter. In [84]–[86], CDD is charged initially through a passive path to start
the active converter and, when the voltage on CST is sufficient, the two capacitors are
shorted or connected through a diode so that the incoming power sustains both the converter and the load. In the presented architecture, during the start-up phase CDD is
passively charged trough a secondary passive rectifier, implemented with a NVC with a diode in series (NVCD), until the minimum voltage VDDmin required for properly
powering the active conversion process. This phase is expected to be much shorter than in single storage systems because of the significantly lower value of CDD with
voltage VDDact,max in order to keep the converter supply in the required operating
range, which is a priority task as it will be shown in the next paragraph. VDDact,max is
not the maximum allowed supply voltage, but it is the higher threshold voltage of an hysteretic level comparator used for routing energy alternatively to CST and CDD (i.e.
for activation of SST or SDD in Fig. 14). Then, the energy flow is diverted to CST as
long as VDD remains above a second threshold voltage VDDact,min chosen for preserving
a high conversion efficiency. Below this voltage, energy is diverted to CDD again to
keep the power converter functional. It holds that VDDmin < VDDact,min < VDDact,max.
In order to assess the advantages of TWS, it is useful to compare the energy extracted by the NVCD passive interface, i.e. when the minimum baseline voltage is still not reached in a single storage system with a large capacitor, with the energy extracted by SECE. The output energy in passive operation (i.e. when SECE is not activated) EP,BR per half-wave can be evaluated by integrating the current through the
diode in the passive path in Fig. 14 with a fixed output VDD, assumed to be constant in
the half-period (e.g. with a large capacitor or a supercapacitor) and the resulting expression for EP,BR is the following:
V V V
V C
EP,BR 2 P DD P0 DD (3.5)
The SECE process has an intrinsic efficiency value ηS, defined as the energy
transferred to the output divided by the energy removed from the transducer in a
Fig. 14. Block diagram showing the active and passive charging paths in the converter and TWS for the active path.
single charge extraction, which is also dependent on circuit parameters and components. In an ideal case it holds that ηS = 1. In order to evaluate the
performances of TWS, the effectiveness of SECE with NVC and BR are compared using the ratio ηP = EP,BR / EL(NVC). The ratio ηP accounts for the efficiency of SECE
with NVC and, approximating to unity the exponential term in EL(NVC), it can be
written as: 0 0 1 1 P DD T P DD S P V V V V V V . (3.6)
The numerical evaluation of (3.6) is illustrated in Fig. 15 for some values of VP0
and it is clearly shown that the theoretical efficiency of the ideal SECE (ηS = 1) is
higher than the BR in any case (as ηP < 1). This also holds with a non-ideal SECE
with a sub-optimal efficiency ηS = 0.5. Therefore, it is advisable to use SECE with
respect to a passive rectifier in any configuration, as soon as it is possible. In addition, if a supercapacitor (from mF to the F range) is required, the use of a single
Fig. 15. Efficiency of passive charging of storage element (NVC+Diode) for start-up with respect to SECE. As can be pointed out, the efficiency is less than 50% even for SECE with a low conversion efficiency (ηS=0.5). The values used for the evaluation are VT=0.7 V for generic MOSFETs and Vγ=0.35 V for diodes.
energy storage element for supplying both the converter and the load is not optimal for the start-up phase, i.e. from 0 V to VDDmin, because this phase relies on a passive
rectifier for energy harvesting. In the above considerations, RCI was not considered. Anyway, enabling also RCI reinforces the above conclusions, as it will be shown experimentally in Chapter 3.4.
3.3 Architecture of Single Source SECE Converter
The architecture of the proposed converter implementing a self-starting SECE with RCI and TWS, which has been designed in a 0.32 μm BCD technology from STMicroelectronics, is depicted in Fig. 7.
The converter requires two external capacitors CDD and CST, two inductors L1 and
L2 and a variable resistor RRCI, which is used for setting the duration of RCI. In a
future version of the converter, a single inductor can be utilized rather than L1 and L2
as the utilization factor of each inductor is very low. In fact, the use of a second inductor L2 for the RCI circuit is not mandatory and only L1 might be used for both
the buck-boost converter and the RCI circuit, as the RCI phase can be executed immediately after a full cycle of the buck-boost converter. Since the main purpose of this work was to assess the effectiveness of RCI, two separate inductors were used in this design for ease of implementation.
Once the converter has started active operations (i.e. SECE) the transducer is always kept in open circuit by the switch SS, which is normally open. As the
converter operates as a buck-boost converter, there is never a direct conduction path from the transducer to VST or VDD. Moreover, RCI is performed directly on the
transducer nodes and thus RCI is not affected by the load and by VST or VDD. RCI
depends only on the rectifier characteristics, hence on the threshold voltage VGS,th of
the MOSFETs in the NVC, and on the series resistance of the associated L2-CP
The converter draws nominally a quiescent current IDDq equal to 160 nA when no
energy extraction cycles are preformed (i.e. in idle state) at VDD=2.7 V. The current
drawn from each sub-circuit, obtained by simulations, is listed in Table II.
TABLE IISIMULATED QUIESCENT CURRENT DRAWN BY EACH SUB-CIRCUIT OF THE CONVERTER.
Sub-circuit Current [nA]
Bias 48
UVLO1 16
UVLO2 16
Peak Detector 32
Bias (in Buck-boost converter) 16
Other1 32
1This current is drawn by a comparator detecting whether V
ST is greater than an
externally applied voltage reference. Such function is not used by the converter but its consumption has been considered in the evaluation of the quiescent current as well as in the experimental results.
The section of the circuit related to the passive start-up is shown in Fig. 17. The
Fig. 16. Block diagram of the designed integrated converter for a single piezoelectric transducer.
inverted). At start-up from a discharged state, a pMOS diode MPD and a depletion
nMOS MNd (i.e. a normally-closed switch) connect VR to VDD allowing the latter to
be passively charged. The converter starts to operate actively (i.e. SECE is activated) as soon as VDD ≥ VDDmin = 1.4 V. At that voltage, an under-voltage lock-out (UVLO1)
circuit triggers and MNd is turned off blocking the passive charging path towards CDD
and then the buck-boost converter is activated and SECE is performed. An hysteresis of about 100 mV is added to the UVLO in order to prevent undesired on-off switching due to noise and small variations on VDD.
Actually, the minimum required input voltage amplitude for a successful start -up operation is VP0=1.8 V. However, as CDD is usually comparable with the output
capacitance of the piezoelectric transducer (in this work CDD 200-470 nF), it only
takes a few oscillation periods in order to charge CDD up to VDDmin and start SECE.
Once SECE and RCI are started, the converter can successfully extract energy with input voltages down to 0.7 V. The passive start-up block draws 64 nA nominally and embeds a supply-independent bias circuit which generates a reference current of
16 nA and outputs the reference voltages VBP and VBN which are used as inputs for
biasing all the analog circuitry of the IC.
The NVC output VR is tracked by an ultra-low power peak detector and an energy
extraction cycle is performed on each maximum of VR. The circuit diagram of the
interface for the piezoelectric transducer is shown in Fig. 18. It is composed by an NVC for signal rectification, a switch for the connection to the main inductance L1, a
peak detector and the switches for RCI. The first stage of the peak detector is an input signal conditioning block and such stage is required in order to filter the input signals lower than the minimum value of VPmin = 700 mV. It also includes an RC filter (Rf
and Cf) with a -3dB cut-off frequency of 5.3 kHz in order to smooth the spikes
generated during RCI and prevent false peak detections. MF1 and MF3 are low
threshold nMOS transistors . The next stage is composed of a voltage tracking circuit and a hysteretic comparator with hysteresis Vh = ±15 mV.
The static current drawn by the peak detector is as low as 32 nA, equally divided between the voltage tracking block (OPAPK) and the hysteretic comparator (CMPPK).
The voltage tracking block charges C with M in order to keep V = V . As
when VRf ≤ (Vtrack-Vh) and, in this case, the PEAK signal is set to VDD. At the end of
an energy extraction cycle Ctrack is reset by MNr in order to rightly track the next
half-wave on VRf and detect the following maximum; VRESET is generated by the logic
controller on the falling edge of CONV signal, which is activated by the control logic only during energy extractions. As VP (and thus VR) can exceed VDD, the amplifier
OPAPK, the current mirror MP1-MP2 and the comparator CMPPK are supplied by the
highest voltage between VDD and VR by a dedicated bulk regulator circuit.
The switch connecting VR and VLX1 is composed by both a nMOS and a pMOS and
both gates are driven by a gate driver (GD) which, for the case of MPS, is constantly
supplied by the highest voltage between VDD, VLX1 and VR in order to completely turn
off MPS.
The RCI circuit is made of two nMOS switches MR1 and MR2, which connect VP1
and VP2 to the inductor L2. The RCI phase is started by the logic controller as soon as
the energy on CP has been extracted. In this implementation, the length of the RCI
phase is set by the value of a resistor RRCI which alters the RC constant in a pulse