Article
Self-Assembled InAs Nanowires as Optical Reflectors
Francesco Floris1, Lucia Fornasari1, Andrea Marini2, Vittorio Bellani1ID, Francesco Banfi3ID,
Stefano Roddaro4, Daniele Ercolani4ID, Mirko Rocci4 ID, Fabio Beltram4, Marco Cecchini4,
Lucia Sorba4and Francesco Rossella4,*
1 Dipartimento di Fisica, Università di Pavia, via Bassi 6, 27100 Pavia, Italy; [email protected] (F.F.); [email protected] (L.F.); [email protected] (V.B.)
2 ICFO-Institut de Ciencies Fotoniques, The Barcelona Institute of Science and Technology, 08860 Castelldefels (Barcelona), Spain; [email protected]
3 Interdisciplinary Laboratories for Advanced Materials Physics (I-LAMP) and Dipartimento di Matematica e Fisica, Università Cattolica del Sacro Cuore, Via Musei 41, 25121 Brescia, Italy; [email protected] 4 National Enterprise for Nanoscience and Nanotechnology (NEST), Scuola Normale Superiore and Istituto
Nanoscienze-CNR, Piazza S. Silvestro 12, 56127 Pisa, Italy; [email protected] (S.R.); [email protected] (D.E.); [email protected] (M.R.); [email protected] (F.B.); [email protected] (M.C.); [email protected] (L.S.)
* Correspondence: [email protected]; Tel.: +39-050-509-132
Received: 19 October 2017; Accepted: 16 November 2017; Published: 21 November 2017
Abstract: Subwavelength nanostructured surfaces are realized with self-assembled vertically-aligned InAs nanowires, and their functionalities as optical reflectors are investigated. In our system, polarization-resolved specular reflectance displays strong modulations as a function of incident photon energy and angle. An effective-medium model allows one to rationalize the experimental findings in the long wavelength regime, whereas numerical simulations fully reproduce the experimental outcomes in the entire frequency range. The impact of the refractive index of the medium surrounding the nanostructure assembly on the reflectance was estimated. In view of the present results, sensing schemes compatible with microfluidic technologies and routes to innovative nanowire-based optical elements are discussed.
Keywords: semiconductor nanowire; nanostructured optical surface; sub-wavelength nanostructures; specular reflectance; sensing
1. Introduction
New pathways for light manipulation [1] and unprecedented control of light-matter interaction at the nanoscale [2–4] were demonstrated exploiting the optical response of metamaterials [5–7], artificial media composed of repeating patterns of subwavelength elements fashioned from composite materials. In this context, metal-dielectric composite systems typically suffer from large absorption owing to Ohmic losses in the underpinning metallic building blocks, which can be detrimental for practical applications. Working in reflection geometry, nanostructured optical components overcome this limitation and offer enormous opportunities for optical manipulation [8], e.g., control of polarization [9] and orbital angular momentum of light [10], dispersive holograms [11] and spatial light modulators [12]. Dielectric systems remain however desirable at optical frequencies as they are largely free from Ohmic losses. Artificial arrangements of dielectric nanostructures including nanowires (NWs) [13] can yield engineered photonic-bandgap materials [14] and are of considerable importance for applications in next-generation light-harvesting and photovoltaics [15–20]. Silicon NWs vertically arranged and electromagnetically coupled to each other were shown to display frequency-dependent reflection spectra, enabling color matrix refractive index sensors [21]. III–V nanowire/Si triple-junction solar cells were proposed and theoretically discussed in recent years. The high absorbability of the NWs
and the greatly suppressed reflection were shown to yield excellent current matching between subcells, resulting in a cell efficiency of 31.4% [22]. In this context, non-periodic semiconductor-based nano-arrangements can in turn display unique optical responses and provide intriguing photonic platforms. This was recently pointed out in experimental and theoretical studies focusing on silicon nanostructure fractal arrays and mats [23,24]. As far as concerns III–V semiconductor NW ensembles, investigation efforts were devoted to GaP-based nano-materials for photovoltaic applications, and the experimental research aimed at addressing the optical properties of the systems under test by measuring their optical transmission and birefringence [25–28].
In this work, attention was focused on the study of the optical properties of non-periodic assemblies of InAs nanowires. Here, polarization- and angle-resolved optical micro-reflectivity was investigated, and strong modulations of the polarization-resolved reflectance as a function of photon energy and incidence angle were observed. Our experimental findings were rationalized for long wavelengths in the frame of an effective-medium model and were accurately reproduced in the whole wavelength range by numerical simulations. The changes in the relative reflectance variation produced by small changes in the refractive index of the medium filling the volume between the NWs were theoretically estimated. In the present implementation, the self-assembled NW technology was exploited, which enables fast and cost-effective realization of large surfaces covered by semiconductor nanostructures. Our work provides the experimental proof-of-concept that vertically aligned InAs NW arrangements represent a promising class of nanostructured optical reflectors. Our estimations of the impact of the refractive index of the medium filling the volume between the NWs are relevant in view of sensing applications, thanks to the exceptional surface-to-volume ratio due to the high aspect ratio of the NWs.
2. Nanowire Assemblies and Light Reflection
InAs NW assemblies were grown on (111)B InAs substrates exploiting gold-catalyzed chemical beam epitaxy [29]. This technically gives to the samples a hybrid metal-semiconductor character, since the InAs NWs have on top Au-rich nanoparticles. Nevertheless, the Ohmic losses due to the metal could be of relevance at normal or close to normal incidence only, while at increasing incidence angle, the optical response is expected, and indeed found, to be dominated by the semiconductor. Actually, the peculiar optical features presented in this work occur at high incidence angle. In this sense, our system can be thought of as a purely semiconducting one. For this study, a subset of samples was selected, characterized by very similar average NW length (⇡1 µm) and diameter (⇡50 nm) and different NW densities, i.e., different substrate coverages, in the range from⇡5 NW/µm2
to⇡50 NW/µm2(see the Supporting Information).
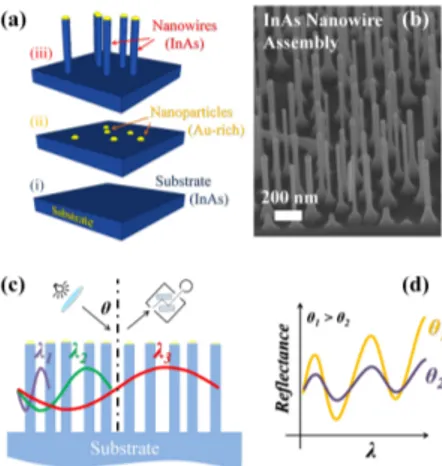
As mentioned above, the semiconductor nanostructures can in principle compete with the Au-rich NW tips (Figure1a(iii),b) in determining the optical response of the assembly, in particular since the metallic nanoparticles may support surface plasmon resonances. However, the latter are known to be strongly dependent on the specific photon incident wavelength and angle and are thus relatively easy to identify. In the present case, as will be shown further on, significant features ascribable to the metallic tips were not observed, neither in the experimental reflectance spectra, nor in the calculated ones. This can be due to the small cross-section of the metallic tip, rapidly becoming negligible with respect to that of the whole semiconductor volume of the NW for increasing incidence angle and to the chemical composition of the catalyst, where the indium amount can reach⇡35%. Sets of three types of samples were investigated (see Figure1a): the bare InAs substrate, the substrate with the dispersed Au-rich nanoparticles (NPs) and the substrate with the InAs NWs. For different substrate coverages, it was verified that the density of the NPs equals the density of the NWs. The Fourier analysis of binarized top-view scanning electron microscopy (SEM) micrographs of the samples returns spot-less spectra, consistent with the absence of long-range order in the NW motif. Details on the growth and the morphological characterization of the samples are reported in the Methods and the Supporting Information.
Figure 1. (a) Schematics of a set of samples used in this work: (i) the InAs substrate; (ii) the InAs substrate with dispersed Au-rich catalyst nanoparticles; (iii) the InAs substrate with the InAs nanowire (NW) assembly; (b) ⇡ 45 tilted scanning electron micrograph of InAs NWs (density ⇡ 30 NW/µm2, diameter ⇡ 50 nm, length ⇡ 950 nm); (c) as light impinges on the NW assembly, photons with a short wavelength interact with few individual NWs, while large wavelengths see the whole assembly as an effective-medium; (d) diffraction and interference effects give rise to reflectance oscillations versus photon wavelength and incidence angle.
As white light impinges on the NW assembly with a characteristic NW-to-NW distance, photons can either interact with individual NWs and undergo multiple scattering within the NWs (short wavelengths) or experience the effective optical response of the system (long wavelengths), as schematically illustrated in Figure1c. This yields interference effects (due to relative phase difference between reflected waves) that in general depend on the incident photon wavelength, thus affecting the far-field response that may display the appearance of peculiar features (such as oscillations) in the spectrally-resolved reflectance of the assembly (Figure1d). Reflectance modulations not strictly dependent on the geometry of the arrangement make the optical response particularly robust and stable and protect it from fluctuations of the NW-to-NW distance. This, together with the very large surface-to-volume ratio, due to the high aspect ratio of the NWs, makes the present system very attractive for sensing applications.
3. Experimental Results: Optical Reflectance
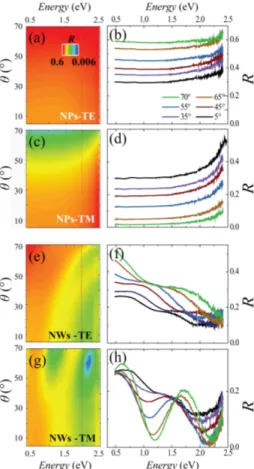
In order to probe the capability of InAs NW assemblies to manipulate an impinging electromagnetic field, we experimentally investigate the far-field optical response by angle-resolved specular reflectance (R) measurements [14,30]. Figure2shows R for the case of an InAs NW sample with⇡30 NW/µm2(Panels e–h)
and for the substrate with the dispersed NPs only (Panels a–d). R was measured for transverse electric (TE) and magnetic (TM) polarized light covering the visible and near-IR frequency range, as a function of the photon incidence angle q (between 5 and 70 ). The spectra of the bare substrate (not shown) and of the substrate with dispersed NPs display almost identical features, indicating that the Au-rich NPs dispersed on the substrate do not play a significant role in the explored range of photon energy and incidence angle. TE and TM reflectance plots for the InAs substrate with the Au NPs are reported in Figure2a,c in a logarithmic color scale as a function of photon energy and incidence angle. They show a monotonic behavior both in the angle- and energy-dependence of the reflectance. The cross-cuts at different photon angles reported in Figure2b,d reveal almost flat, featureless spectra for both polarizations. The reflectance increases (decreases) at increasing photon incident angle for TE (TM) polarization and eventually vanishes as q approaches the Brewster angle (qB ⇡75 ) for TM-polarized light. Similar featureless spectra were measured also
for low-density InAs NW samples with substrate coverage10 NW/µm2(see Supporting Information).
Figure2e,g shows the color-plot of the reflectance for a high-substrate coverage (⇡30 NW/µm2) InAs
NWs sample, while the spectra corresponding to crosscuts at different angles are shown in Figure2f,h. For the TE case, even though the general increase of reflectance as a function of q qualitatively mimics the
behavior observed on the substrate, the spectra reveal an evident monotonic decrease of R with photon energy, with marked changes in the slope within each spectrum and between spectra measured at different angles. For the TM case, the InAs NWs display a strong oscillating optical response, as highlighted in Figure
2g,h: the color plot and the spectra are drastically different from those measured on the InAs substrate with dispersed NPs (see Figure2c,d). In fact, the TM reflectance for the InAs NWs displays marked oscillations as a function of photon energy at different q.
In particular, the reflectance vanishes for q⇡60 at⇡2.1 eV (⇡590 nm), indicating resonant transmission of the assembly followed by absorption in the substrate for this impinging photon energy and angle. TE reflectance modulations are less strong with respect to the TM ones, as evidenced in Figure2and also confirmed by the simulations reported further ahead (Figures3and4). This behavior can be ascribed to the strong anisotropy of the NWs [31] and to a more advantageous coupling between the TM field and the lateral surface of the NWs. In fact, increasing the incidence angle from 0 to 70 , for TE waves, the direction of the electric field is unchanged, and the cross-sections between the electric field and the NWs are small; while for TM waves, the direction of the electric field changes, and its component along the NW axis increases significantly. Further analysis of the observed trends for the InAs NWs (e.g., dependence of the intensity and energy position of peaks and valleys upon the incidence angle) is reported in the Supporting Information.
Figure 2. Angle- and energy-resolved reflectance modulations. Logarithmic color plot of the angle- and energy-resolved specular reflectance measured on the InAs substrate with the dispersed Au-rich NPs (a,c) and on the InAs NWs (e,g). Reflectance spectra measured at different incident photon angle q (indicated by different color curves) for the Au-rich NPs dispersed on the InAs substrate (b,d) and for the InAs NWs (f,h). Transverse electric (TE) and magnetic (TM) light polarizations are indicated by labels. Marked reflectance modulations versus photon energy and incidence light angle occur in the InAs NWs, while almost featureless reflectance is observed for the InAs substrate with dispersed Au-rich NPs.
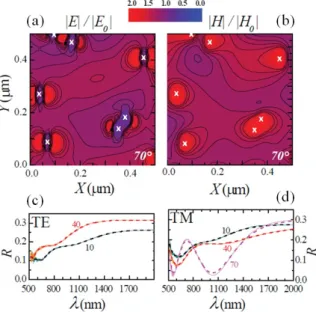
Figure 3. Effective-medium calculation of reflectance modulations. Logarithmic color plot of the angle-and energy-resolved reflectance calculated for InAs NWs using the effective-medium approximation for (a) TE polarization and (c) TM polarization, respectively. Reflectance spectra calculated at several different angles, for (b) TE and (d) TM polarizations.
Figure 4. Numerical simulations of the near-field spatial distributions and reflectance. Normalized spatial distribution of the electric (a) and magnetic (b) field, calculated for the InAs NWs (density ⇡ 30 NW/µm2, length 950 nm, diameter ⇡ 45 nm) for TM-wave at 70 and at l ⇡ 1035 nm. The white crosses indicate the centers of the NWs. E0 and H0represent the incident electric and magnetic field, respectively. (c,d) Calculated (dashed line) and measured (solid line) reflectance for the two polarizations.
4. Theoretical Results: Analytical and Numerical Simulations
An effective medium model was adopted to account for the observed phenomenology and to catch the physics of the reflectance behavior in the subwavelength reflector. We assumed a medium composed of InAs cylinders with surface density NCand radius r much smaller than the optical wavelength l. In
this limit, the composite medium behaves like a material with effective dielectric constants given by the Maxwell–Garnett average over the transverse plane perpendicular to the NW growth direction, e?,InAs, and the arithmetic average over the wires axis, ez,InAs[32]:
ez,InAs=peC+ (1 p)eB, (2)
where p = p2r2NC is the cylinder medium filling factor (i.e., areal NW packing fraction), eC is the
dielectric constant of the cylinder medium, eBis the dielectric constant of the background medium and
fC= 2eB/(eC+ eB). For the sake of completeness, the metallic nanoparticles on top of the nanowires have
been taken into account, making a similar average to achieve the effective dielectric constants e?,Au and ez,Au. In order to calculate optical propagation, we assumed monochromatic waves with angular frequency w and wavevector k = (kx, kz) impinging on the effective-medium described above. The full
analytical solutions of Maxwell’s equations (Supporting Information) can be split into two sub-sets of solutions for TE- and TM-polarized waves, and the results are reported in Figure3. The dependence of the calculated reflectance on photon incidence angle and energy reproduces the main experimental trends, and in general, our model better reproduces the experimental features at smaller incident photon energy. This occurs since the assumptions of the effective-medium approximation ceases to hold as the wavelength becomes shorter and thus light probes individual NWs rather than the NW assembly as a whole. Some minor differences between experimental and calculated curves are observed: for TM polarization, in the range 20 q 40 , a dip appears at ¯hw ⇡1.5 eV; the measured data display, superimposed on the oscillations, a general decrease of R at increasing photon energy, which is not observed in the theoretical curves; calculated peaks and dips of R are slightly blue-shifted with respect to the measured ones; the experimental reflectance is quenched with respect to the theoretical one.
In order to fully recover the fine details of the experimental curves over the whole range of energy and angles, Maxwell’s equations were solved numerically by resorting to a finite-difference time-domain (FDTD) code [33,34] in a model system composed of a quasi-random motif of vertically-aligned, identical NWs with diameters, lengths and densities mimicking the investigated InAs NWs. This allowed us to address the far- and near-field response of our system. Figure4a,b reports the electric and magnetic near-field spatial distributions for the InAs NWs. Our calculations show a significant electric field at the NW lateral surfaces (near field) and confirm the occurrence of marked resonances in the reflectance (far field): the light scattered within and reflected from the NW surface displays a large modulation that depends on the polarization, wavelength and incidence angle of the radiation. Panels c and d in Figure4show the reflectance spectra calculated for InAs NWs at different q (dashed curves) together with the corresponding experimental spectra (solid curves): the agreement is remarkable in the whole wavelength range examined. The longitudinal electric field expansion was also simulated for different angles of incidence, and the results can be found in the Supporting Information.
5. Discussion: Sensing Applications
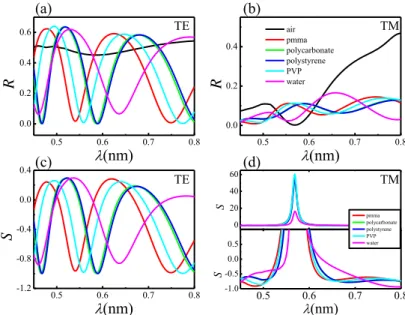
Owing to their large surface-to-volume ratio, NWs and NW-based systems bear great potential for sensing applications. For instance, semiconductor nanowire field-effect sensor devices were proposed as a powerful detection platform for a broad range of biological and chemical species in solution [35]. Here, the attention is focused on a different, all-optical sensing paradigm. To this end, the optical response of the NW assembly was analytically estimated for different filling media (i.e., different refractive indexes in the space surrounding the NWs), in the frame of the effective model presented above. A similar approach was recently used for the theoretical estimation of the influence of wetting states on the reflectance of Si nanopillars [36,37]. As the filling medium, besides air, we considered water in light of its relevance for biosensing applications. We also considered transparent thermoplastics (polymethyl methacrylate (PMMA) and polycarbonate) and synthetic aromatic polymers (polystyrene and polyvinylphenol or polyvinylpyrrolidone (PVP)), commonly used in the science and technology of semiconductors. Panels a and b in Figure5show the reflectance versus wavelength at fixed incidence angle in the case of air, water and four different polymers, for the TE and TM case, respectively. Panels c and d in Figure5show the sensitivity S calculated as the relative reflectance variation, i.e., S = (R Rair)/Rair. In these calculations, an incident angle
q= 55 at which a set of reflectance resonances is observed was chosen. We notice that TE modulations
medium with permittivity higher than air surrounding the NWs yields a longer effective optical path, affecting interference (and diffraction) phenomena and thus reflectance modulations. From the present calculations, it can be estimated that, over the whole photon energy range, a variation4n⇡0.01 of the refractive index n of the filling medium causes a change up to4R⇡0.05 of the reflectance, which is well above the present detection limit, as shown by the experimental curves in Figure2. In particular, assuming water as the medium filling the NW reflector, for4n⇡0.01, we get4R⇡0.01, which appears compatible with the present experimental arrangement.
0.5 0.6 0.7 0.8 0.0 0.2 0.4 0.6
R
(nm) 0.5 0.6 0.7 0.8 0.0 0.2 0.4R
(nm) air pmma polycarbonate polystyrene PVP water 0.5 0.6 0.7 0.8 -1.2 -0.8 -0.4 0.0 0.4S
(nm) 0 20 40 60 0.5 0.6 0.7 0.8 -1.0 -0.5 0.0 0.5 pmma polycarbonate polystyrene PVP water S (nm) S TE TM TE TM (a) (c) (b) (d)Figure 5. Effect of different media filling the InAs nanowire assembly. Optical response calculated for different media surrounding the NWs, for TE (a) and TM (b) polarization. The filling media are indicated in (b). Sensitivity or relative reflectance variation S = (R - Rair)/Rairfor TE (c) and TM (d) polarizations. The incidence angle is 55 .
An experimental demonstration of sensing functionalities in our system goes beyond the purpose of the present work. However, the present investigation can be of relevance for the development of all-optical cost-effective NW-based sensing platforms compatible with microfluidic integration [38,39], where the sensing area of the chip is made of NWs, light is focused at a fixed incidence angle and the reflectance versus wavelength is probed. For instance, when a small quantity of fluid is driven within a microfluidic circuit into the NW-based reflector (with a size scalable down to a few micrometers), the liquid fills the gaps around the NWs, and the reflectance spectrum changes. A straightforward application would be the measurement of the liquid refractive index by comparing the experimental curve against a calibration library. The present platform enables label-free detection and does not involve surface plasmon resonance and complex system modeling. Furthermore, we believe that an important application would be the detection of a specific biological-complex formation [40,41]. To this aim, for different specific binding events considered, different biorecognition elements should be used to functionalize the NW surfaces. The analyte molecules present in the solution spread between the NWs, bind to the biorecognition elements and cause an increase in the refractive index n at the NW surface. The change of n produced by the binding event depends on the properties of the molecules and on the concentration of the analyte molecules at the NW surface. If the binding occurs within a thin layer at the NW surface, the sensor response will be proportional to the binding-induced n change and ultimately to the analyte surface concentration, i.e., the ratio between the analyte-molecule mass and the NW area. In this scenario, the high surface-to-volume ratio characteristic of NWs can play a very favorable role. Finally, it is worth noting that the present sensing strategy, based on disordered
disposition of nanowires, is recently being pursued also in other frames such as that of the granular nanoparticle system for gas and liquid sensing applications [42].
Here, starting from quasi-randomly textured NW assemblies characterized by a relatively broad distribution of diameter and, to a lesser extent, length, we have shown that non-trivial optical response (reflectance) can be achieved for a suitable average areal NW packing fraction and that the observed phenomenon could be exploited for sensing applications. With a different approach, the flexibility of the epitaxial-growth technique (in terms of materials, heterostructure architectures and dimensions) could be combined with the accurate control of NW morphology and location (achievable using electron beam lithography to define the arrangement of the Au catalyst nanoparticles). These, together with a robust modeling effort yielding predictive input for the NW array design, could be the key ingredients for the realization of fully-engineered all-dielectric NW-based optical elements and metasurfaces, opening the way toward exciting opportunities for light manipulation at the nanoscale.
6. Methods
InAs NWs were grown by Au-assisted chemical beam epitaxy in a Riber Compact 21 system, employing pressure control in the metalorganic lines to determine precursor fluxes during the growth. The precursors involved in the NW growth are tri-methylindium (TMIn) and tertiarybutylarsine (TBAs). A nominally 0.5 nm-thick Au film was first deposited on (111)B InAs wafers by thermal evaporation. Before the growth was initiated, the sample was heated at 470±10 C under TBAs flow for 20 min in order to de-wet the Au film into nanoparticles and to remove the surface oxide from the InAs substrate. The NWs were grown at a temperature of⇡385±10 C, with TMIn and TBAs flux of
⇡0.3 Torr and⇡0.7 Torr, respectively, for a time of⇡45 min.
Variable-angle specular reflectance was measured over the spectral range from 2000 to 20,000 cm 1(0.248–2.479 eV). The light of a Xe arc-lamp was collimated and then focused on the
sample into a spot having a diameter of 1–100 µm and divergence less than 2 . A home-made micro-reflectometer setup associated with a Fourier transform spectrophotometer Bruker IFS66 (spectral resolution of 0.15 cm 1) was used to investigate the samples. For the dispersion measurements,
the in-house built goniometer allows varying the incidence angle q between 5 and 70 , while the reflected beam was collected at 2q. A Glan Taylor polarizer was used to select TE (s) or TM (p) polarized light. In order to measure the reflectance, two silicon and an InSb photodiodes (with detectivity extending from 400 nm to 1200 nm and from 1000 nm to 5000 nm, respectively) were used.
Finite-difference time-domain (FDTD) numerical simulations of the electric field distributions and of the optical reflectance spectra were performed using Lumerical FDTD Solutions software. The bare nanostructures were modeled as bulk substrates overlaid with an assembly of vertically-aligned nanowires. In our code, we used five randomly-displaced deterministic non-periodic arrays that mimic the non-periodic and non-deterministic NW texture. The result is a good approximation, for our purpose, of the NWs assemblies used in the present experiments. The electromagnetic field (ELM) field was calculated in several planes parallel to the xy one at different values of z.
7. Conclusions
In conclusion, the optical reflection in assemblies of vertically-aligned InAs nanowires was investigated. Marked reflectance oscillations were achieved that are not critically driven by the detailed arrangement of the nano-objects, but instead stem from a suitable choice of substrate filling factor (or areal NW packing fraction), a macroscopic property, together with the refractive-index contrast occurring at the nanoscale. Theoretical modeling, which provides a nice agreement with the experiments, strongly supports this viewpoint. In fact, an effective-medium model and numerical simulations allow one to rationalize and accurately reproduce the experimental findings in the whole energy range examined. The large surface-to-volume ratio assured by the characteristic aspect ratio of the NWs is a very desirable feature for sensing applications and may pave the way toward a new class of robust, semiconductor technology-compatible, cost-effective, all-optical nanoscale sensors. Change C4:
The bio-sensing paradigm here presented can be summarized as follows. The biomolecules to be detected are dispersed in the liquid, which infiltrates in the InAs nanowire forest. When these target molecules selectively anchor to the probes that were previously immobilized on the nanowire surface, a change in the optical constants occurs, which in turn modifies the optical response of the infiltrated NW forest. Supplementary Materials: The following are available online at www.mdpi.com/2079-4991/7/11/400/s1. Details on the growth and characterization of the samples. Reflectance data for the low-substrate coverage NW sample. Energy dispersion of the reflectance minima for InAs NWs. Full analytical solutions of Maxwell’s equations for the effective-medium model.
Acknowledgments: Francesco Rossella, Mirko Rocci and Francesco Banfi acknowledge the support by the MIUR through the program “Fondo per gli Investimenti della Ricerca di Base (FIRB)—Futuro in Ricerca 2013” (Grant No. RBFR13NEA4). Stefano Roddaro and Lucia Sorba acknowledge the support by the CNR through the Russian Foundation for Basic Research (RFBR) bilateral program 2015–2017. Vittorio Bellani acknowledges the support by the Spanish Ministry of Economy and Competitiveness, under Projects MINECO/FEDER MAT2013-46308-C2-1-R and MAT2016-75955-C2-2-R. Francesco Rossella acknowledges enlightening discussions with A. Pitanti and M.J. Rodriguez-Douton.
Author Contributions: Francesco Rossella conceived and designed the experiment. Daniele Ercolani and Lucia Sorba grew and characterized the nanowire samples. Francesco Floris, Lucia Fornasari and Vittorio Bellani performed the experiment. Francesco Floris, Andrea Marini, Francesco Rossella, Marco Cecchini and Fabio Beltram analyzed the data. All authors contributed to the writing and discussion of the manuscript.
Conflicts of Interest: The authors declare no conflict of interest. References
1. Yao, J.; Liu, Z.; Liu, Y.; Wang, Y.; Sun, C.; Bartal, G.; Stacy, A.M.; Zhang, X. Optical negative refraction in bulk metamaterials of nanowires. Science 2008, 321, 930–930.
2. Krishnamoorthy, H.N.S.; Jacob, Z.; Narimanov, E.; Kretzschmar, I.; Menon, V.M. Active hyperbolic metamaterials: Enhanced spontaneous emission and light extraction. Science 2012, 336, 205–209.
3. Noginov, M.A.; Li, H.; Barnakov, Y.A.; Dryden, D.; Nataraj, G.; Zhu, G.; Bonner, C.E.; Mayy, M.; Jacob, Z.; Narimanov, E.E. Controlling spontaneous emission with metamaterials. Opt. Lett. 2010, 35, 1863–1865. 4. Kauranen, M.; Zayats, A.V. Nonlinear plasmonics. Nat. Photonics 2012, 6, 737–748.
5. Belardini, A.; Centini, M.; Leahu, G.; Hooper, D.C.; Li Voti, R.; Fazio, E.; Haus, J.W.; Sarangan, A.; Valev, V.K.; Sibilia, C. Chiral light intrinsically couples to extrinsic/pseudo-chiral metasurfaces made of tilted gold nanowires. Sci. Rep. 2016, 6, 31796.
6. Lemoult, F.; Kaina, N.; Fink, M.; Lerosey, G. Wave propagation control at the deep subwavelength scale in metamaterials. Nat. Phys. 2013, 9, 55–60.
7. Jacob, Z.; Kim, J.Y.; Naik, G.V.; Boltasseva, A.; Narimanov, E.E.; Shalaev, V.M. Engineering photonic density of states using metamaterials. Appl. Phys. B Laser Opt. 2010, 100, 215–218.
8. Yu, N.; Capasso, F. Flat optics with designer metasurfaces. Nat. Mater. 2014, 13, 139–150.
9. Zhao, Y.; Alù, A. Manipulating light polarization with ultrathin plasmonic metasurfaces. Phys. Rev. B 2011,84, 205428.
10. Karimi, E.; Schulz, S.A.; De Leon, I.; Qassim, H.; Upham, J.; Boyd, R.W. Generating optical orbital angular momentum at visible wavelengths using a plasmonic metasurface. Light Sci. Appl. 2014, 3, e167.
11. Wang, B.; Dong, F.; Li, Q.-T.; Yang, D.; Sun, C.; Chen, J.; Song, Z.; Xu, L.; Chu, W.; Xiao, Y.-F.; et al. Visible-Frequency Dielectric Metasurfaces for Multiwavelength Achromatic and Highly Dispersive Holograms. Nano Lett. 2016, 16, 5235–5240.
12. Huang, Y.-W.; Lee, H.W.H.; Sokhoyan, R.; Pala, R.A.; Thyagarajan, K.; Han, S.; Tsai, D.P.; Atwater, H.A. Gate-Tunable Conducting Oxide Metasurfaces. Nano Lett. 2016, 16, 5319–5325.
13. Yan, R.; Gargas, D.; Yang, P. Nanowire photonics. Nat. Photonics 2009, 3, 569–576.
14. Soldano, C.; Rossella, F.; Bellani, V.; Giudicatti, S.; Kar, S. Cobalt Nanocluster-Filled Carbon Nanotube Arrays: Engineered Photonic Bandgap and Optical Reflectivity. ACS Nano 2010, 4, 6573–6578.
15. Brongersma, M.L.; Cui, Y.; Fan, S. Light management for photovoltaics using high-index nanostructures. Nat. Mater. 2014, 13, 451–460.
16. Zhu, J.; Yu, Z.; Burkhard, G.F.; Hsu, C.-M.; Connor, S.T.; Xu, Y.; Wang, Q.; McGehee, M.; Fan, S.; Cui, Y. Optical Absorption Enhancement in Amorphous Silicon Nanowire and Nanocone Arrays. Nano Lett. 2009, 9, 279–282.
17. Garnett, E.; Yang, P. Light trapping in silicon nanowire solar cells. Nano Lett. 2010, 10, 1082–1087.
18. Wallentin, J.; Anttu, N.; Asoli, D.; Huffman, M.; Åberg, I.; Magnusson, M.H.; Siefer, G.; Fuss-Kailuweit, P.; Dimroth, F.; et al. InP nanowire array solar cells achieving 13.8% efficiency by exceeding the ray optics limit. Science 2013, 339, 1057–1060.
19. Anttu, N.; Abrand, A.; Asoli, D.; Heurlin, M.; Aberg, I.; Samuelson, L.; Borgstrom, M. Absorption of light in InP nanowire arrays. Nano Res. 2014, 7, 816–823.
20. LaPierre, R.R.; Chia, C.E.; Gibson, S.J.; Haapamaki, C.M.; Boulanger, J.; Yee, R.; Kuyanov, P.; Zhang, J.; Tajik, N.; Jewell, N.; et al. III-V nanowire photovoltaics: Review of design for high efficiency. Phys. Status Solidi Rapid Res. Lett. 2013, 7, 815–830.
21. Khorasaninejad, M.; Abedzadeh, N.; Walia, J.; Patchett, S.; Saini, S.S. Color Matrix Refractive Index Sensors Using Coupled Vertical Silicon Nanowire Arrays. Nano Lett. 2012, 12, 4228–4234.
22. Wen, L.; Li, X.; Zhao, Z.; Bu, S.; Zeng, X.; Huang, J.; Wang, Y. Theoretical consideration of III–V nanowire/Si triple-junction solar cells. Nanotechnology 2012, 23, 505202.
23. Fazio, B.; Arton, P.; Iatì, M.A.; D’Andrea, C.; Lo Faro, M.J.; Del Sorbo, S.; Pirotta, S.; Gucciardi, P.G.; Musumeci, P.; Vasi, C.S.; et al. Strongly enhanced light trapping in a two-dimensional silicon nanowire random fractal array. Light 2016, 5, e16062.
24. Street, R.A.; Wong, W.S.; Paulson, C. Analytic Model for Diffuse Reflectivity of Silicon Nanowire Mats. Nano Lett. 2009, 9, 3494–3497.
25. Muskens, O.L.; Diedenhofen, S.L.; van Weert, M.H.M.; Borgström, M.T.; Bakkers, E.P.A.M.; Gómez-Rivas, J. Epitaxial Growth of Aligned Semiconductor Nanowire Metamaterials for Photonic Application. Adv. Funct. Mater. 2008, 18, 1039–1046.
26. Muskens, O.L.; Borgström, M.T.; Bakkers, E.P.A.M.; Gómez-Rivas, J. Giant optical birefringence in ensembles of semiconductor nanowires. Appl. Phys. Lett. 2006, 89, 233117.
27. Gómez-Rivas, J.; Diedenhofen, S.L.; Muskens, O.L.; Grzela, G. Tailoring light scattering of nanowires for photovoltaic applications. SPIE Newsroom 2010, 10–12, doi:10.1117/2.1201008.003092.
28. Strudley, T.; Zehender, T.; Blejean, C.; Bakkers, E.P.A.M.; Muskens, O.L. Mesoscopic light transport by very strong collective multiple scattering in nanowire mats. Nat. Photonics 2013, 7, 413–418.
29. Gomes, U.P.; Ercolani, D.; Zannier, V.; Beltram, F.; Sorba, L. Controlling the diameter distribution and density of InAs nanowires grown by Au-assisted methods. Semicond. Sci. Technol. 2015, 30, 115012.
30. Caridad, J.M.; McCloskey, D.; Rossella, F.; Bellani, V.; Donegan, J.F.; Krsti´c, V. Effective Wavelength Scaling of and Damping in Plasmonic Helical Antennae. ACS Photonics 2015, 2, 675–679.
31. Wilhelm, C.; Larrue, A.; Dai, X.; Migasd, D.; Soci, C. Anisotropic photonic properties of III–V nanowires in the zinc-blende and wurtzite phase. Nanoscale 2012, 4, 1446–1454.
32. Pollard, R.J.; Murphy, A.; Hendren, W.R.; Evans, P.R.; Atkinson, R.; Wurtz, G.A.; Zayats, A.V.; Podolskiy, V.A. Optical Nonlocalities and AdditionalWaves in Epsilon-Near-Zero Metamaterials. Phys. Rev. Lett. 2009, 102, 127405. 33. Giudicatti, S.; Valsesia, A.; Marabelli, F.; Colpo, P.; Rossi, F. Plasmonic resonances in nanostructured
gold/polymer surfaces by colloidal lithography. Phys. Status Solidi A 2010, 4, 935–942.
34. Floris, F.; Figus, C.; Fornasari, L.; Patrini, M.; Pellacani, P.; Marchesini, G.; Valsesia, A.; Artizzu, F.; Marongiu, D.; Saba, M.; et al. Optical Sensitivity Gain in Silica-Coated Plasmonic Nanostructures. J. Phys. Chem. Lett. 2014, 5, 2935–2940.
35. Patolsky, F.; Lieber, C.M. Nanowire nanosensors. Mat. Today 2005, 8, 20–28.
36. Xu, X.; Vereecke, G.; Chen, C.; Pourtois, G.; Armini, S.; Verellen, N.; Tsai, W.-K.; Kim, D.-W.; Lee, E.; Lin, C.-Y.; et al. Capturing Wetting States in Nanopatterned Silicon. ACS Nano 2014, 8, 885–893.
37. Gwon, M.; Kim, S.; Li, J.; Xu, X.; Kim, S.-K.; Lee, E.; Kim, D.-W.; Chen, C. Influence of wetting state on optical reflectance spectra of Si nanopillar arrays. J. App. Phys. 2015, 118, 213102.
38. Peli, S.; Nembrini, N.; Damin, F.; Chiari, M.; Giannetti1, C.; Banfi, F.; Ferrini, G. Discrimination of molecular thin films by surface-sensitive time-resolved optical spectroscopy. Appl. Phys. Lett. 2015, 107, 163107. 39. Travagliati, M.; Nardi, D.; Giannetti, C.; Gusev, V.; Pingue, P.; Piazza, V.; Ferrini, G.; Banfi, F. Interface
nano-confined acoustic waves in polymeric surface phononic crystals. Appl. Phys. Lett. 2015, 106, 021906. 40. Sackmann, E.K.; Fulton, A.L.; Beebe, D.J. The present and future role of microfluidics in biomedical research.
41. Kim, J.; Junkin, M.; Kim, D.H.; Kwon, S.; Shik Shin, Y.; Kin Wong, P.; Gale, B.K. Applications, techniques, and microfluidic interfacing for nanoscale biosensing. Microfluid Nanofluid 2009, 7, 149–167.
42. Benetti, G.; Caddeo, C.; Melis, C.; Ferrini, G.; Giannetti, C.; Winckelmans, N.; Bals, S.; van Bael, M.J.; Cavaliere, E.; Gavioli, L.; et al. Bottom-Up Mechanical Nanometrology of Granular Ag Nanoparticles Thin Films. J. Phys. Chem. C 2017, 121, 22434–22441.
c 2017 by the authors. Licensee MDPI, Basel, Switzerland. This article is an open access article distributed under the terms and conditions of the Creative Commons Attribution (CC BY) license (http://creativecommons.org/licenses/by/4.0/).
1
,*
,
Supporting Information
1. InAs nanowire samples and morphological characterization
Exploiting the chemical beam epitaxy technique, we have grown gold catalyzed InAs nanowire (NW) samples characterized by different average length (from 250-to 2000 nm), average diameter (from 25 to
60 nm) and NW density (from ≈ 5 to ≈ 50 NWs/µm2). Each sample was imaged using scanning electron
microscopy (SEM), and the images were processed using a in house developed Mathematica code [Gomes, U.P. et al, Semicond. Sci. Technol. 30, 115012 (2015)]. that performs automatic morphological analysis of a statistical population of individual NWs (> 1000). Typically, standard deviations for NW diameter and length were ≈ 8 nm and ≈100 nm, respectively.
Among the samples analyzed, those with average length of ≈ 1 µm and average diameter of ≈ 50 nm displayed high NW homogeneity and narrow distributions, and allowed to preserve these characteristics
for different coverage of the substrate with NWs, from ≈ 5 NWs/µm2 to ≈ 50 NWs/µm2.
As an example, in Figs. SI.1 a-c we report 45° tilted SEM micrographs of three InAs NW assemblies (samples A, B and C) characterized by about the same NW average length (≈ 1 µm) and NW average diameter (≈ 50 nm) but different substrate coverage.
2
sample A
≈5 NWs/μm
2(b)
sample B
≈30 NWs/μm
2(c)
sample C
≈50 NWs/μm
2Figure SI.1. (a-c) 45° tilted SEM micrographs of InAs NW samples with similar NW average dimensions (≈ 1 µm length and ≈
50 nm diameter) but different substrate coverage, as indicated.
We carried out the 2D Fourier analysis of several top-view SEM micrographs of each samples
taken with different magnifications. This gave us an indication of the random character of the
NW arrangements. This is evident in Fig.SI.2, where we report SEM images (quasi top-view) of
sample B. Binarized images such as the one shown in panel (c) were processed using the FFT
tool of free image processing software (ImageJ). The results - see the plot shown in panel (d) -
confirm the absence of long range order in the NW arrangement and likely reflect the average
shape (hexagonal) of the NW cross-section.
200 nm
1 μm
200 nm
1 μm
3
Figure SI.2. (a,b) quasi top-view SEM micrographs of InAs NW sample B; (c) the same SEM micrograph as in (a) after being
binarized. (d) fast Fourier transform (FFT) of the image reported in (c). The absence of dot patterns accounts for the disordered NW arrangement.
2. Optical response in low-substrate coverage InAs NWs sample
We have observed non-negligible features in the reflectance spectra only for NW samples characterized
by substrate coverage well exceeding 10 NWs/μm2. For samples with ≤ 10 NWs/μm2, the reflectance
spectra were practically indistinguishable from the spectra measured for the bulk substrate or for the
substrate covered with catalyst nanoparticles (with NPs/μm2 ≈ NWs/μm2 ). As an example in Fig. SI.3 we
compare the reflectance spectra (both transverse-electric, TE, and transverse-magnetic, TM) measured for
the sample A (see Fig. SI.1a), characterized by a substrate coverage of ≈5 NWs/μm2, and the spectra
4
Figure SI.3. Specular reflectance spectra measured for TE and TM configuration as function of the incidence angle varying
between 5° and 70°, for a low-substrate coverage g InAs NW sample and for a substrate simply covered with NPs: (a) substrate with NPs, TM configuration; (b) same configuration for InAs NW sample; (c) substrate with NPs, TE configuration; (d) same configuration for InAs NW sample.
3. Angular dispersion of the intensity and energy of the TM reflectance minima
Reflectance spectra were measured in the InAs NW assembly for TM light polarization, increasing the incidence angle from 5° to 70°. The experimental curves display a minimum at about 1 eV (Min-1) and a minimum at about 2 eV (Min-2). We probed a marked change of the intensity and energy position of these minima, as reported in Fig. SI.4 In particular, blue-shift of ~0.1 eV and ~0.16 eV for Min-1 and Min-2 were detected, respectively. The peak-to-valley ratio evolves with θ as well, increasing for both minima.
.
Figure SI. 4. Angular dispersion of the minima observed in TM polarization. (a) Intensity of the reflectance at Min-1 and MIN-2. (b)
Energy position of Min-1 and Min-2.
0 20 40 60 80 0.00 0.05 0.10 0.15 0 20 40 60 80 1.1 1.2 2.0 2.1 2.2 Ref le ct a n ce (deg) En erg y (eV) Min-1 Min-2 (deg)
5
simulated resorting to the FDTD code described in the manuscript. The resulting local electric field shape changes are reported in Fig. SI.5. The outcomes of the calculation is consistent with the experimental trends reported in Fig. 2 of the manuscript. In fact, the increase of the angle of incidence involves a strengthening of the local field intensity associated to the formation of a dip in the reflection. In addition, it is evident the confinement of the field mainly at the upper surface of the NWs, that can represent a useful feature for sensing application.
Figure SI.5. Longitudinal electric field intensity distribution around a NW with respect to the angle of incidence (θ) in TM polarization for the Min-1. (a) θ=0°. (b) θ=55°. (c) θ=70°.
It’s worth noting that, placing an appropriate gold coating at the top of the nanowires i.e. in the region where the field is maximum, the nanostructures could become even more suitable for sensing applications. In Fig. SI.6 we report the results for a 30 nm thick Au-coating. The latter is found to yield a significant enhancement of the electric field in the proximity of the nanowire-Au contact area, that can be likely ascribed to localized plasmon effects.
Figure SI.6. Electric field intensity distribution with respect to the angle of incidence (θ) in TM polarization for a gold coated structure. (a) θ=0°. (b) θ=55°. (c) θ=70°.
6
We assume monochromatic waves with angular frequency and wavevector k k x k zxˆ zˆ impinging
on the effective multi-layer described in the main text. Maxwell’s equations provide:
0 0
0
i
i
i
i
i
k
E
k E
H
k H
E
Thus, the problem can be split into two sub-problems for TE and TM-polarized waves. For the sake of compactness, we rename the effective dielectric constants of the layer of gold nanoparticles (with radius
a
) and of the underlying nanowire assembly of lengthl
as 1, z1 and 2, z2, respectively. Thedielectric constant of the bulk substrate is indicated as S. Reflectance properties of the multi-layer
medium are studied below as a function of the incidence angle i
atan
k k
x z of the impinging opticalbeam.
TE polarization. We first assume a TE polarized field
E
xE
z0
:2 1
cos cos sin
cos cos cos cos sin
0 sin 1 1 ˆ , , 0 1 ˆ ˆ , , cos sin , , i i i i i i i i i i z i z i x i t c c c I R i z i z i z i z i x i t c c c c c i R I i I R i z c x z t E e E e e y z x z t E e E e x E e E e z e c x z t E e E E H E 2 1 2 2 2 2 1 1 1 1 sin sin
sin sin sin sin sin
2 1 1 1 1 1 0 2 ˆ 0 1 ˆ ˆ , , sin sin , , i i i i i i i i z i x i t c c i z i z i z i z i x i t c c c c c i i i e e y z a x z t E e E e x E e E e z e c x z t E e H E 2 2 2 2 2 2 2 2 2 2 2 2
sin sin sin 2
sin sin sin sin sin
2 2 2 2 2 2 0 ˆ 1 ˆ ˆ , , sin sin i i i i i i i i z i z i x i t c c c i z i z i z i z i x i t c c c c c i i E e e y a z x z t E e E e x E e E e z e c H 2 2 sin sin sin sin 2 0 ˆ , , 1 ˆ ˆ , , sin sin i S i i S i i x i z i t c c S i x i z i t c c i S i S l x z t E e y z l x z t z x E e c E H
7
all the interfaces one gets
Me
b
where:1 1 2 2 1 1 2 2 2 2 2 2 2 2 2 1 1 2 2 1 1 1 1 2 2 2 2
sin , sin , sin
, 1 1 1 0 0 0 cos 0 0 0 0 0 0 0 0 0 0 0 0 0 S S i i S S i i iq A iq A iq A iq A iq A iq A iq A iq A iq L iq L iq L iq L iq L iq L S q q q A a c L l c q q e e e e M q e q e q e q e e e e q e q e q e 1 1 2 2 1 cos 0 1 0 0 0 R i I S E E E E E E E e b
Thus, the reflection coefficient can be calculated by inverting the system above:
R
TEe
1
2.TM polarization. We assume a TM polarized field
E
y0
:cos cos sin cos cos sin
cos cos sin
0
1
ˆ ˆ
, , cos cos sin sin
0 1 ˆ , , , , i i i i i i i i i i z i z i x i t i z i z i x i t c c c c c c I i R i I i R i i z i z i x i t c c c I R i x z t E e E e e x E e E e e z z x z t E e E e e y c x z t E e E H E 2 2 2 2 1 1 1 1 1 1 1 1
1sin 1sin sin 1 1sin 1sin sin
1 1 1 2 1 1 1 1 1 2 0 1 1 1 sin ˆ ˆ sin 1 , , sin i i i i i i z z z z z i z i x i t i z i z i x i t c c c i c c c z i z z E e e x E e E e e z x z t c H 2 2 1 1 1 1 1 1 2 2 2 2 2 2 2 2 2
sin sin sin
1 1
sin sin sin 2
2 2 2 2 2 2 2 2 0 ˆ sin ˆ , , sin i i i z z i i i z z ic z ic z i x i t c i ic z ic z i x i t ic i c z i z z a E e E e e y x z t E e E e e x E e E 2 2 2 2 2 2 2 2 2 2 2 2 2 2 2
sin sin sin
2
sin sin sin
2 2 2 2 0 2 2 2 2 ˆ 1 ˆ , , sin sin ˆ , , sin i i i z z i i i z z z ic z i x i t c ic z ic z i x i t c i z i S S i E e e z a z l x z t E e E e e y c x z t E x E H E 2 2 sin sin sin sin 2 0 ˆ 1 ˆ , , sin S i i S i i i z i x i t c c S i z i x i t S c c S S i z e e z l x z t E e e y c H
8
orthogonal displacement vector at all the interfaces one gets
Me
b
where:1 1 2 2 1 1 2 2 2 2 2 2 2 2 1 2 1 1 2 2 1 2 1 1 1 2 1 2 1 1 2 1 2 2 2
sin , sin , sin
, cos 1 1 0 0 0 0 0 0 0 0 0 0 0 0 0 0 0 0 S i i S S i z z i iq A iq A iq A iq A iq A iq A iq A iq A iq L iq L iq L iq L S S q q q A a c L l c q e e e e M q e q e q e q e e e e q e q 2 1 1 1 2 2 2 cos 0 1 0 0 0 S R i I iq L iq L S S E E q E E E E e q e E e b
Thus, also in this case, the reflection coefficient can be calculated by inverting the system above:
2
1
TM