Contents lists available atScienceDirect
Neuropharmacology
journal homepage:www.elsevier.com/locate/neuropharm
Glutamate/GABA co-release selectively influences postsynaptic glutamate
receptors in mouse cortical neurons
Giorgia Fattorini
a,c,∗,1, Cristian Ripoli
b,d,1, Sara Cocco
b, Matteo Spinelli
b, Andrea Mattera
b,
Claudio Grassi
b,d, Fiorenzo Conti
a,caDepartment of Experimental and Clinical Medicine, Section of Neuroscience and Cell Biology, Università Politecnica delle Marche, 60026, Ancona, Italy bInstitute of Human Physiology, Università Cattolica del Sacro Cuore, 00168, Rome, Italy
cCenter for Neurobiology of Aging, INRCA, IRCCS, Ancona, Italy
dFondazione Policlinico Universitario A. Gemelli - IRCCS, 00168, Rome, Italy
H I G H L I G H T S
•
Mixed synapses of mouse cortical neurons co-release Glu and GABA.•
Mixed and glutamatergic synapses share similar presynaptic features.•
Mixed synapses have fewer postsynaptic AMPA receptors than glutamatergic synapses. A R T I C L E I N F O Keywords: Co-release Glutamate GABA AMPA receptors Excitation-inhibition balance Cerebral cortex A B S T R A C TCultured rat cortical neurons co-expressing VGLUT1 and VGAT (mixed synapses) co-release Glu and GABA. Here, mixed synapses were studied in cultured mouse cortical neurons to verify whether in mice mixed synapses co-release Glu and GABA, and to gain insight into how they may influence excitation/inhibition balance. Results showed the existence of synapses and autapses that co-release Glu and GABA in cultured mouse cortical neurons, and the ability of both neurotransmitters to evoke postsynaptic responses mediated by ionotropic receptors. We studied the short-term plasticity of glutamatergic, GABAergic, and mixed responses and we found that the ki-netics of mixPSC amplitude depression was similar to that observed in EPSCs, but it was different from that of IPSCs. We found similar presynaptic release characteristics in glutamatergic and mixed synapses. Analysis of postsynaptic features, obtained by measuring and NMDAR-mediated currents, showed that AMPAR-mediated currents were significantly higher in pure glutamatergic than in mixed synapses, whereas NMDAR-mediated currents were not significantly different from those measured in mixed synapses. Overall, our findings demonstrate that glutamatergic and mixed synapses share similar electrophysiological properties. However, co-release of GABA and Glu influences postsynaptic ionotropic glutamatergic receptor subtypes, thus selectively influencing AMPAR-mediated currents. These findings strengthen the view that mixed neurons can play a key role in CNS development and in maintaining the excitation-inhibition balance.
1. Introduction
Glutamate (Glu) and γ-aminobutyric acid (GABA) are the main mediators of excitatory and inhibitory synaptic transmission in the central nervous system (CNS; Cherubini and Conti, 2001; Conti and Weinberg, 1999). It has long been thought that Glu and GABA are re-leased from independent populations of neurons that can be identified,
among other features, by specific vesicular transporters: VGLUT1-VGLUT3 (also known as SLC17A7, SLC17A6, and SLC17A8, in the order) for glutamatergic neurons (Fremeau et al., 2004; Gras et al., 2002; Takamori, 2006) and VGAT (also known as SLC32A1) for GA-BAergic neurons (McIntire et al., 1997; Sagné et al., 1997; Takamori et al., 2000). Morphologically, two types of synapses have been de-scribed in the cerebral cortex: asymmetric ones release Glu
https://doi.org/10.1016/j.neuropharm.2019.107737
Received 11 December 2018; Received in revised form 24 July 2019; Accepted 6 August 2019
∗Corresponding author. Department of Experimental and Clinical Medicine, Section of Neuroscience and Cell Biology, Università Politecnica delle Marche, Via Tronto 10/A, 60126, Ancona, Italy.
E-mail address:[email protected](G. Fattorini). 1GF and CR contributed equally.
Neuropharmacology 161 (2019) 107737
Available online 07 August 2019
0028-3908/ © 2019 The Authors. Published by Elsevier Ltd. This is an open access article under the CC BY-NC-ND license (http://creativecommons.org/licenses/BY-NC-ND/4.0/).
accumulated in synaptic vesicles by VGLUT1 or VGLUT2, whereas symmetric synapses release GABA carried into synaptic vesicles by VGAT (Chaudhry et al., 1995; Colonnier, 1968; Dumoulin et al., 1999; Kaneko et al., 2002).
In 2006, Safiulina and colleagues demonstrated that VGLUT1 and VGAT co-localize in mossy fibers of the developing hippocampus (Safiulina et al., 2006). In 2009, we reported that in the adult rat neocortex the two vesicular neurotransmitters transporters are co-ex-pressed in axon terminals forming both asymmetric and symmetric synapses, and that at these synapses they are sorted to the same vesicles that are involved in the exo-endocytotic cycle (Fattorini et al., 2009). We also found that VGLUT1 and VGAT co-localization occurs in other rat brain regions, as well as in the mouse brain, although in smaller amounts (Fattorini et al., 2017).Moreover, we showed that in cultured rat cortical neurons: i) Glu and GABA are released from neurons co-expressing VGLUT1 and VGAT (mixed synapses); ii) co-release evokes monosynaptic Glu and GABA responses; and iii) the number of mixed synapses is regulated in an activity-dependent manner (Fattorini et al., 2015).
Here, mixed synapses were studied in cultured mouse cortical neurons by electrophysiology in order to: 1) verify whether in mice mixed synapses co-release Glu and GABA, as observed in rats; and 2) define their basic electrophysiological features, to gain insights into how they may influence excitation/inhibition balance, in light of the observation that their number is affected by excitation-inhibition im-balance (Fattorini et al., 2015).
2. Material and methods
2.1. Animals
P0–P2 C57BL/6 mice (Animal Facility of Catholic University) were used in the study. Animal procedures were approved by the Ethics Committee of the Catholic University and were fully compliant with Italian (Ministry of Health guidelines, Legislative Decree No. 26/2014) and European Union (Directive No. 2010/63/UE) animal research legislation.
2.2. Dual whole-cell recordings from primary neuronal cultures
Primary cultures of cerebral cortical neurons were obtained from P0–P2 C57BL/6 mice as previously described (Ripoli et al., 2014), with minor modifications. Cells were plated on 20 mm coverslips precoated with poly-L-lysine (0.1 mg/ml; Sigma) at a density of 1.2 × 10⁴cells.
Twenty-four hours later, the culture medium was replaced with a mixture of 96.5% Neurobasal medium, 2% B-27 (both from Invitrogen), 0.5% glutamine (2 mM), and 1% penicillin-streptomycin-neomycin antibiotic mixture. After 72 h, the medium was replaced with the same medium without glutamine. Neurons were studied at DIV 14–21.
Simultaneous recordings were obtained from pairs of neighboring neurons in the primary cultures. Basal synaptic transmission was stu-died using the patch-clamp technique in the whole-cell configuration as previously described (Attar et al., 2012; Fattorini et al., 2015; Ripoli et al., 2013, 2014). Data were collected with a MultiClamp 700A am-plifier (Molecular Devices), digitized at 10 kHz using the Digidata 1440A data acquisition system (Molecular Devices), and analyzed with Clampfit software (Molecular Devices). Patch-clamp electrodes (3–5 MΩ), obtained from borosilicate glass capillaries with the aid of a micropipette puller (PC-10; Narishige), were filled with a solution containing (in mM): 130 K-gluconate, 10 KCl, 1 EGTA, 10 HEPES, 2 MgCl2, 4 MgATP, and 0.3 Tris-GTP. During recordings, cells were constantly perfused with Tyrode's solution containing (in mM): 140 NaCl, 2 KCl, 10 HEPES, 10 glucose, 4 MgCl2, and 4 CaCl2, pH 7.4, 312 mOsm (external solution). Tyrode's solution containing freshly pre-pared 1(S),9(R)-(−)-Bicuculline methiodide (Sigma-Aldrich) was ap-plied through a perfusion system consisting of a multibarrelled pipette
placed within 100-200 μm of the patched cells and connected to syr-inges by means of Teflon tubes. The amplitude and frequency of spontaneous miniature postsynaptic currents (PSCs) were evaluated in 60 s recordings at a membrane potential of −70 mV. The detection threshold was set at 3.5 times the baseline standard deviation. Evoked PSCs were recorded at −70 mV in neurons excited by pairs of stimuli mimicking action potentials (2 ms at 0 mV; interspike interval 50 ms) delivered at 10 s intervals. NMDA currents were evoked using Mg-free Tyrode's solution containing 10 μM of the AMPA receptor blocker NBQX (Tocris Bioscience); a selective NMDA receptor blocker (100 μM APV, Tocris Bioscience) was also used to further confirm NMDA receptor activation.
The size of the readily releasable pool (RRP) of synaptic vesicles was estimated by extracellular application of a hypertonic (0.5 M) sucrose solution for 4 s, as reported previously (Ripoli et al., 2013, 2014). The total RRP charge was estimated as the integral of the fast, transient inward current component after subtraction of the steady state com-ponent. RRP refilling was investigated in paired-pulse experiments in which 0.5 M sucrose solution was applied for 4 s at 4 s interpulse in-tervals. To evaluate short-term plasticity, PSCs were recorded from neurons stimulated with a 20 Hz train. The paired-pulse ratio (PPR) consisted of the ratio of the amplitude of the second PSC to that of the first PSC recorded in the 20 Hz train. Access resistance and membrane capacity were monitored before and at the end of the experiments, to ensure recording stability and cell health. All experiments were con-ducted at room temperature (21–25 °C).
2.3. Statistical analysis
Unless otherwise stated, data are mean ± standard error of the mean (s.e.m). n refers to the number of elements analyzed.
Each series of data was analyzed with the ROUT method (Q = 1%) (Motulsky and Brown, 2006) for detecting outliers that were not in-cluded in statistical analysis and graphs.
We used D'Agostino-Pearson normality test to correctly apply parametric or non-parametric statistics. Statistical significance was evaluated by Friedman test or Mann-Whitney U test or Kruskal-Wallis test for non-parametric statistics; unpaired t-test or one-way/two-way ANOVA for parametric statistics. When the sample size did not allow us to carry out the normality test, we applied non-parametric statistics. Comparison fit provides for the null hypothesis “straight line” and for the alternative hypothesis “one-phase decay” using the GraphPad Prism Software (v. 6.0; GraphPad Software, San Diego, CA, USA).
3. Results
3.1. Electrophysiological properties
Dual patch-clamp recordings performed in low-density cultures of mouse cortical neurons were used to explore the electrophysiological properties of pure glutamatergic, pure GABAergic, and mixed synapses (Fig. 1A). To identify the synaptic connection between two voltage-clamped neurons, the two neurons were excited by pairs of stimuli (interspike interval 50 ms) mimicking action potentials (2 ms at 0 mV from holding potential of −70 mV), delivered at 10 s intervals (Fig. 1B). In our conditions, 84 neurons made 134 contacts (autapses and/or synapses). The receptor-mediated currents were largely gluta-matergic (excitatory PSCs, EPSCs), since 68 (50.75%) of the 134 cur-rents studied were insensitive to the GABAAreceptor blocker bicucul-line (20 μM, Fig. 1C and D). Following perfusion with 20 μM bicuculline, we found that 20 PSCs (14.92%) showed a reduction of responses, indicating Glu and GABA co-release (mixed PSCs; mixPSCs), and 46 currents (34.33%) showed a complete blockage of responses identifying pure GABA contacts (inhibitory PSCs, IPSCs) (Fig. 1C and D). Mean amplitude of PSCs was −376.90 ± 37.13 pA for EPSCs; −283.80 ± 65.27 pA for mixPSCs; and −123.90 ± 14.92 pA for
IPSCs (Fig. 1D). The amplitude of mixed currents did not differ sig-nificantly from either glutamatergic or GABAergic currents (Kruskal-Wallis test with Dunn's multiple comparisons test). These data are in agreement with our previous findings in rats (Fattorini et al., 2015).
Since receptor-mediated currents were largely glutamatergic, we compared neurons forming mixed contacts (synaptic and autaptic) with those forming pure glutamatergic contacts (synaptic and autaptic). In line with the data reported above, we did not observe significant dif-ferences either in the charge transfer of the transient synaptic currents induced by 0.5 M sucrose (a reliable measure of Glu release from docked vesicles;Rosenmund and Stevens, 1996) (Fig. 1E) or in the ratio of the paired stimuli of the hypertonic sucrose solutions delivered at 4 s intervals (a measure of RRP refilling rate;Fig. 1F). This observation suggests that the size of the RRP of synaptic vesicles of glutamatergic contacts (synaptic and autaptic) was similar to that of mixed contacts (synaptic and autaptic). In addition, we found that in the cells where evoked PSCs were measured, spontaneous miniature synaptic currents
were not significantly different in the two types of synapses (Fig. 1G–I); indeed, their mean amplitude was respectively 8.62 ± 0.68 pA and 8.74 ± 1.06 pA in neurons showing EPSCs and mixPSCs (Fig. 1H), while their frequency was respectively 12.00 ± 1.49 Hz and 13.13 ± 1.92 Hz in neurons showing EPSCs and mixPSCs (Fig. 1I). These data indicate the presence of a similar number of functional sy-naptic inputs in the two groups of neurons.
3.2. Autaptic and synaptic currents
In our experimental conditions, 50 neurons out of 84 (59.52%) showed both autaptic and synaptic currents; 20 neurons (23.81%) only synaptic currents; and 14 (16.67%) only autaptic currents.
The receptor-mediated autaptic currents were largely glutamatergic (EPSCs), since 41 of the 64 studied autaptic currents (64.06%) showed PSCs insensitive to the GABAA receptor blocker bicuculline (20 μM, Fig. 2A). Following perfusion with 20 μM bicuculline, we found that
Fig. 1. Dual patch-clamp recordings. A: Schematic representation of dual patch-clamp experiments. B: Representative traces of stimulation and recording. With the
membrane potentials held at −70 mV, two neighboring neurons were excited by pairs of stimuli mimicking action potentials (2 ms at 0 mV; 50 ms interspike intervals) delivered at 10 s intervals. x = autapse of neuron 1; w = autapse of neuron 2; y = synapse of neuron 2 on neuron 1; z = synapse of neuron 1 on neuron 2. C: Representative traces of current recordings from synapses classified as glutamatergic (green), GABAergic (red), and mixed (blue); gray: residual current after perfusion with 20 μM bicuculline. D: Scatter plot of the amplitude of glutamatergic (green; n = 67, 1 oulier removed), GABAergic (red; n = 45, 1 outlier removed), and mixed (blue; n = 18, 2 outliers removed) currents. Kruskal-Wallis test (p < 0.0001), Dunn's multiple comparisons test (Glutamatergic vs. GABAergic p < 0.0001 ****). E: Charge transfer in the 0.5 M sucrose-induced transient synaptic current. Scatter plot of charge transfer in glutamatergic (green; n = 9) and mixed (blue; n = 5) neurons. F: Scatter plot of paired stimuli of hypertonic sucrose solution, delivered at 4 s intervals to glutamatergic (green; n = 9) and mixed (blue; n = 5) neurons. G: Spontaneous miniature currents recorded in mixed (blue) and glutamatergic (green) neurons. H: Scatter plot of the mean amplitude of spontaneous miniature synaptic currents in glutamatergic (green; n = 18) and mixed (blue; n = 10) neurons. I: Scatter plot of the mean frequencies of spontaneous miniature synaptic currents in glutamatergic (green; n = 18) and mixed (blue; n = 10) neurons. In E, F, H and I, lines represent mean ± s.e.m. Outliers detected by the ROUT method (Q = 1%) were not included in graphs and statistics.
8 PSCs (12.50%) showed a reduction of responses, indicating Glu and GABA co-release (mixPSCs), and 15 autaptic currents (23.44%) showed a complete blockage of responses, thus identifying pure GABA autapses (IPSCs) (Fig. 2A). Mean amplitude of autaptic PSCs was −440.00 ± 53.48 pA for EPSCs; −397.50 ± 99.01 pA for mixPSCs; and −187.40 ± 36.61 pA for IPSCs (Fig. 2A) revealing no statistically significant differences between mixed autaptic currents and either glutamatergic or GABAergic autaptic currents.
We also studied 70 receptor-mediated synaptic currents and ob-served that 27 (38.57%) PSCs were insensitive to the GABAAreceptor blocker bicuculline (20 μM,Fig. 2A) and were glutamatergic (EPSCs). Following perfusion with 20 μM bicuculline, we found that 12 PSCs (17.14%) showed a reduction of responses, indicating Glu and GABA co-release (mixPSCs) and 31 synaptic currents (44.29%) showed a complete blockage of responses identifying pure GABA synapses (IPSCs) (Fig. 2A). Mean amplitude of synaptic PSCs was −283.40 ± 42.03 pA for EPSCs; −211.50 ± 82.24 pA for mixPSCs; and −71.28 ± 9.92 pA for IPSCs (Fig. 2A) revealing no statistically significant differences be-tween mixed synaptic currents and either glutamatergic or GABAergic synaptic currents.
Study of release probability by PPR analysis, focused on mixed contacts, did not highlight significant differences between mixed au-tapses and the others autaptic types (Fig. 2B), as well as between mixed and glutamatergic synapses. Instead the PPR was statistically different between the mixed and the GABAergic synapses (Kruskal-Wallis test, Dunn's multiple comparisons test p = 0.0422) (Fig. 2B).
3.3. Short-term plasticity
Next, we studied the short-term plasticity of glutamatergic, GABAergic, and mixed responses using a train of 40 stimuli delivered at 20 Hz. Data collected from autapses and synapses were analyzed separately and pooled together. The kinetics of mixPSC amplitude depression was different from that of EPSCs and from IPSCs. Friedman test (p < 0.0001) and Dunn's multiple comparisons test demonstrated that
the kinetics of amplitude depression was statistically different between the three types of responses (p < 0.0001), without discriminating between synapses and autapses (Fig. 3A) or in autapses (Fig. 3D) and in synapses (Fig. 3G) alone. Data interpolation indicated that mixed and GABA re-sponses follow a one phase decay model [Y= (Y0-Plateau)*exp(-k*X) +Plateau] in all three groups of contacts (Fig. 3B, E, H), whereas glutamatergic responses are interpolated from a straight line (Y=YIntercept + X*slope) without discriminating between synapses and autapses (slope −22.72; Fig. 3B) and in synapses alone (slope −15.5;Fig. 3H), whereas in autapses they exhibit a one phase decay profile [Y= (Y0-Plateau)*exp(-k*X)+Plateau] (Fig. 3E). Moreover, there was no difference in the extent of recovery between mixed (71.40% ± 6.80%) and glutamatergic or GABAergic contacts (92.13 ± 5.35%; 61.47 ± 6.75% respectively) both without discriminating between autapses and synapses (Fig. 3C) and in autapses (mixed: 73.41% ± 12.53%; glutamatergic: 90.23 ± 3.88%; GABAergic: 65.22 ± 5.75%; Fig. 3F) and in synapses alone (mixed: 69.90% ± 8.08%; glutamatergic: 101.10 ± 11.90%; GABAergic: 54.87 ± 6.73%;Fig. 3I) as shown by PSCs recorded 1.5 s after the end of the depleting stimulus train. These observations indicate that the rate of RRP refill from the reserve pool is similar between mixed contact and glutamatergic or GABAergic contacts.
3.4. Postsynaptic AMPA and NMDA currents
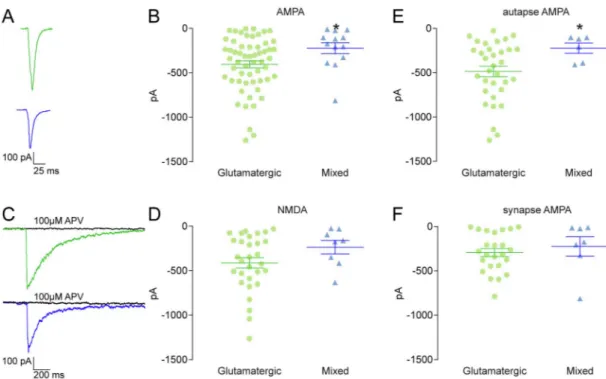
Information on postsynaptic features was obtained by measuring alpha-amino-3-hydroxy-5-methyl-4-isoxazolepropionate receptor- (AMPAR-) and N-methyl-D-aspartate receptor- (NMDAR-)-mediated currents. In the
pre-sence of 20 μM bicuculline, AMPAR-mediated currents were significantly higher in pure glutamatergic than in mixed contacts (autaptic and synaptic) (−404.40 ± 40.50 pA vs −223.20 ± 61.57 pA; p = 0.0264 Mann-Whitney U test; Fig. 4A and B). Conversely, NMDAR-mediated currents were not significantly different from those measured in mixed contacts (autaptic and synaptic) (−412 ± 58.06 pA vs −235.40 ± 75.37 pA; p = 0.1482 unpaired t-test;Fig. 4C and D). We also analyzed whether the
Fig. 2. Autaptic and synaptic currents. A: Scatter plot
of the amplitude of glutamatergic (empty green; n = 40, 1 outlier removed), GABAergic (empty red; n = 15), and mixed (empty blue; n = 7, 1 outlier removed) autaptic currents and glutamatergic (green; n = 27), GABAergic (red; n = 26, 5 outliers re-moved), and mixed (blue; n = 11, 1 outlier removed) synaptic currents. Kruskal-Wallis test (p = 0.0034) for synaptic currents, Dunn's multiple comparisons test (Glutamatergic vs. GABAergic synaptic current p = 0.0024 **). Kruskal-Wallis test (p = 0.0214) for autaptic currents, Dunn's multiple comparisons test (Glutamatergic vs. GABAergic autaptic current p = 0.0219 *). Unpaired t-test glutamatergic sy-napses vs. autapses (p = 0.0376 *). Mann Whitney test GABAergic synapses vs. autapses (p = 0.0008 ***). B: Scatter plot of the PPR of glutamatergic (empty green; n = 37, 4 outlier removed), GABAergic (empty red; n = 15), and mixed (empty blue; n = 8) autapses and glutamatergic (green; n = 26, 1 outlier removed), GABAergic (red; n = 30, 1 outlier removed), and mixed (blue; n = 12) sy-napses. Kruskal-Wallis test (p < 0,0001), Dunn's multiple comparisons test (Glutamatergic vs. GABAergic synapses p = 0.0002 ***; Mixed vs. GABAergic synapses p = 0.0422 *). Lines represent mean ± s.e.m. Outliers detected by the ROUT method (Q = 1%) were not included in graphs and statistics.
difference in the AMPA component was present at both the autaptic and synaptic levels. In autapses, we found that AMPAR-mediated currents were significantly higher in pure glutamatergic than in mixed autapses
(−485.80 ± 58.47 pA vs −222.50 ± 58.30 pA; p = 0.0474 Mann-Whitney U test;Fig. 4E); whereas in synapses AMPAR-mediated currents were not significantly different from those measured in mixed synapses
Fig. 3. Assessment of short-term plasticity by a train of 40 stimuli delivered at 20 Hz. A: Normalized (% of first PSC amplitude) amplitude of the PSCs of
gluta-matergic (green; n = 50), GABAergic (red; n = 30), and mixed (blue; n = 15) currents, mean ± s.e.m. Friedman test (p < 0.0001). B: Comparison of fits. Null hypothesis (straight line) [Y=YIntercept + X*slope]; alternative hypothesis (one-phase decay) [Y= (Y0-Plateau)*exp(-k*X)+Plateau]. The slope of glutamatergic neurons (green) is −22.72. GABAergic neurons (red) one-phase decay best-fit values: Plateau = 6.749; K = 5.218; Half Life = 0.1328; Tau = 0.1916. (p < 0.0001, F = 2540, DFn = 1, DFd = 1078). Red dot: GABAergic outlier. Mixed neurons (blue) one-phase decay best-fit values: Plateau = 44.12; K = 5.423; Half Life = 0.1278; Tau = 0.1844. (p < 0.0001, F = 70.82, DFn = 1, DFd = 598). C: Scatter plot of recovery revealed by PSCs recorded 1.5 s after the end of the depleting stimulus train (% of first PSC amplitude) in glutamatergic (green; n = 47, 2 outliers removed), GABAergic (red; n = 28, 2 outliers removed), and mixed (blue; n = 14, 1 outlier removed) currents. Kruskal-Wallis test (p < 0.001), Dunn's multiple comparisons test (Glutamatergic vs. GABAergic p < 0.001 ***). D: Normalized (% of first PSC amplitude) amplitude of the PSCs of glutamatergic (green; n = 25), GABAergic (red; n = 7), and mixed (blue; n = 6) autapses, mean ± s.e.m. Friedman test (p < 0.0001). E: Comparison of fits. Null hypothesis (straight line) [Y=YIntercept + X*slope]; alternative hypothesis (one-phase decay) [Y= (Y0-Plateau)*exp(-k*X)+Plateau] (p < 0001; F = 519.5, DFn = 1, DFd = 310). Glutamatergic neurons (green) one-phase decay best-fit values: Plateau = 52.52; K = 1.575; Half Life = 0.4402; Tau = 0.6351. (p < 0.0001, F = 38.42, DFn = 1, DFd = 998). GABAergic neurons (red) one-phase decay best-fit values: Plateau = 4.563; K = 7.363; Half Life = 0.09414; Tau = 0.1358. (p < 0.0001, F = 486.4, DFn = 1, DFd = 278). Mixed neurons (blue) one-phase decay best-fit values: Plateau = 24.63; K = 16.17; Half Life = 0.04288; Tau = 0.06186. (p < 0.0001, F = 187.2, DFn = 1, DFd = 238). F: Scatter plot of recovery revealed by PSCs recorded 1.5 s after the end of the depleting stimulus train (% of first PSC amplitude) in glutamatergic (green; n = 24, 1 outlier removed), GABAergic (red; n = 6, 1 outlier removed), and mixed (blue; n = 6) autapses. Kruskal-Wallis test (p < 0.05), Dunn's multiple comparisons test (Glutamatergic vs. GABAergic p < 0.05 *). G: Normalized (% of first PSC amplitude) amplitude of the PSCs of glutamatergic (green; n = 25), GABAergic (red; n = 23), and mixed (blue; n = 9) synapses, mean ± s.e.m. Friedman test (p < 0.0001). H: Comparison of fits. Null hypothesis (straight line) [Y=YIntercept + X*slope]; alternative hypothesis (one-phase decay) [Y= (Y0-Plateau)*exp(-k*X)+Plateau] (p < 0001; F = 519.5, DFn = 1, DFd = 310). The slope of glutamatergic neurons (green) is −15.5. GABAergic neurons (red) one-phase decay best-fit values: Plateau = 7.776; K = 5.143; Half Life = 0.1348; Tau = 0.1944. (p < 0.0001, F = 1871, DFn = 1, DFd = 826). Red dot: GABAergic outlier. Mixed neurons (blue) one-phase decay best-fit values: Plateau = 48.07; K = 1.57; Half Life = 0.4415; Tau = 0.6369. (p = 0.0091, F = 6.88, DFn = 1, DFd = 358). I: Scatter plot of recovery revealed by PSCs recorded 1.5 s after the end of the depleting stimulus train (% of first PSC amplitude) in glutamatergic (green; n = 24), GABAergic (red; n = 21, 2 outliers removed), and mixed (blue; n = 8, 1 outlier removed) synapses. Ordinary one-way ANOVA (F = 6.095; DFn = 2; DFd = 50; p = 0.0043 **), Tukey's multiple comparisons test (Glutamatergic vs. GABAergic p = 0.0033 **). In C, F and I lines represent mean ± s.e.m. Outliers detected by the ROUT method (Q = 1%) were not included in graphs and statistics.
(−292.30 ± 44.74 pA vs −223.80 ± 107.90 pA; p = 0.2342 Mann-Whitney U test;Fig. 4F).
Since the AMPA current is different in glutamatergic synapses and in autapses (Fig. 2A), we evaluated whether the same difference is also present between mixed autapses and synapses, and found that mixed currents did not differ in autapses and synapses (Fig. 5).
Although we found similar presynaptic release features in gluta-matergic and mixed contacts (Figs. 1 and 2), our data nevertheless in-dicate that in mixed contacts AMPAR-mediated currents are selectively scaled down, particularly at autapses, whereas those mediated by NMDARs are unaffected.
Overall, our findings demonstrate that although mixed synapses exhibit some unique features, they share similar electrophysiological properties with glutamatergic and/or GABAergic terminals. However, co-release of GABA and Glu influences postsynaptic ionotropic gluta-matergic receptor subtypes, thus selectively influencing AMPAR-medi-ated currents, especially in autapses.
4. Discussion
4.1. Glu and GABA co-release is also found in mixed synapses and autapses of mouse cortical neurons
Here, we describe for the first time the existence of synapses and autapses that co-release Glu and GABA in cultured mouse cortical neurons, and the ability of both neurotransmitters to evoke ionotropic postsynaptic responses, in line with previous observations in rats (Fattorini et al., 2015). However, the percentage of mixed synapses is lower in mouse than in rat neurons (Fattorini et al., 2015), consistently with the lower number of VGLUT1- and VGAT-positive puncta reported in the mouse cerebral cortex (Fattorini et al., 2017). The lower per-centage of puncta characterizing the mouse cerebral cortex prompted us to examine in the present study a larger number of contacts com-pared to our previous studies (134 vs 27), to overcome the risk of sampling too many mixed synapses, a decision that may have resulted in a smaller percentage of mixed currents.
We found that even in mouse cortical neurons both mixed autaptic currents and mixed synaptic currents were present. The characteristics of the mixed currents were similar both to the “self” and to the “non-self” (Liu et al., 2013), and are located in an intermediate position between the features of excitatory currents and inhibitory currents, thus resulting not statistically different from any of the two. We confirmed that a difference in the amplitude of AMPA current does exist between glutamatergic synapses and autapses (Liu et al., 2013; Mennerick et al.,
Fig. 4. AMPA and NMDA currents. A: Representative traces of AMPA currents in glutamatergic (green) and mixed (blue) synapses. B: Scatter plot of AMPA current
amplitudes in glutamatergic (green; n = 57) and mixed (blue; n = 13) synapses and autapses. Mann-Whitney U test (*p = 0.0264). C: Representative traces of NMDA currents in glutamatergic (green) and mixed (blue) synapses. D: Scatter plot of NMDA current amplitudes in glutamatergic (green; n = 30, 3 outliers removed) and mixed (blue; n = 8) synapses and autapses. Unpaired t-test (p = 0.1482). E: Scatter plot of AMPA current amplitudes in glutamatergic (green; n = 33) and mixed (blue; n = 6) autapses. Mann-Whitney U test (*p = 0.0474). F: Scatter plot of AMPA current amplitudes in glutamatergic (green; n = 24) and mixed (blue; n = 7) synapses. Mann-Whitney U test (p = 0.2342). In B, D, E and F lines represent mean ± s.e.m. Outliers detected by the ROUT method (Q = 1%) were not included in graphs and statistics.
Fig. 5. AMPA currents. Scatter plot of AMPA current amplitudes in mixed
sy-napses (blue; n = 7) and mixed autapses (empty blue; n = 6). Lines represent mean ± s.e.m. Outliers detected by the ROUT method (Q = 1%) were not included in graphs and statistics.
1995), and added the observation that such a difference is not present in the AMPA component of mixed currents.
4.2. Mixed contacts resemble Glu contacts (that also release GABA)
The assessment of short-term plasticity by application of a train of 40 stimuli delivered at 20 Hz showed that the PSC amplitude depression kinetics of mixed responses was different from that of Glu and GABA contacts, standing in the middle of the two (Fig. 3A). Exploration of their presynaptic features, i.e., RRP size, vesicle refill time and PPR suggests that there are no differences between mixed and Glu synapses. This seems to indicate that, based on their presynaptic features, mixed contacts can be considered as Glu terminals, where glutamic acid dec-arboxylase can be observed (Fattorini et al., 2009), and where at least some synaptic vesicles express also VGAT (Fattorini et al., 2009). These considerations suggest that mixed and Glu synapses could also share similar postsynaptic features, a hypothesis that we tested by measuring AMPA and NMDA currents.
4.3. Mixed synapses may regulate the excitation-inhibition balance
The measurement of AMPA and NMDA currents indicated that mixed synapses showed a statistically significant and selective reduc-tion of AMPA currents, suggesting that Glu release is unaffected, and in line with the close similarity of the presynaptic terminals of mixed and of Glu synapses.
In mammalian brain, postsynaptic AMPA receptors play an im-portant role in fast excitatory transmission, and AMPA overactivation induces excitotoxicity; notably, the modulation of AMPA receptors has neuroprotective effects (Jayakar and Dikshit, 2004). The AMPA re-ceptor reduction documented here in the postsynaptic element of mixed synapses, in particular if “self”, may well be the key to the role of these distinctive synapses. In fact, AMPA receptors are negatively modulated by synaptic activity, since increased excitation induces their post-synaptic reduction (O'Brien et al., 1998); this in turn results in a duction of EPSPs, in line with the neuroprotective role of these re-ceptors (Jayakar and Dikshit, 2004; O'Brien et al., 1998). However, increased excitation also raises the number of mixed synapses (Fattorini et al., 2015), the same synapses that according to the present findings already have a limited number of postsynaptic AMPA receptors. Alto-gether, these data suggest that mixed synapses could play a significant role in maintaining the excitation-inhibition balance.
4.4. Neuropathological implications
Mixed synapses could also play a major role in conditions involving AMPA and GABAA receptor regulation, like attention-deficit/hyper-activity disorder, autism, and homeostatic recovery of neural attention-deficit/hyper-activity following auditory or sleep deprivation (Balaram et al., 2018; del Cid-Pellitero et al., 2017; Naaijen et al., 2017). They may also exert effects on neurogenesis and neuroinflammation, since both processes are to some extent linked to excitotoxicity (Nato et al., 2015; Olloquequi et al., 2018; Viviani et al., 2014); in turn, excitotoxicity may be im-plicated in conditions such as stroke, Alzheimer's disease, Parkinson's disease or in psychiatric disorders such as schizophrenia and depres-sion. Finally, mixed synapses play a well-established role in epilepsy (Gutiérrez, 2005), and levetiracetam, a widely prescribed anti-epileptic drug (Kaminski et al., 2012), induces a reduction in AMPA currents in cortical neurons (Carunchio et al., 2007).
5. Conclusions
The mixed neurons of the mouse cerebral cortex co-release Glu and GABA. Mixed and glutamatergic synapses and autapses share highly similar presynaptic elements, but a significantly different number of postsynaptic AMPA receptors in particular on “self”. These findings
strengthen the view that mixed neurons can play a key role in CNS development and in maintaining the excitation-inhibition balance. Funding
This work was supported by grants from Università Cattolica (CG) and by Ministero dell’Istruzione, dell’Università e della Ricerca (FFABR, 2017 to GF; and PRIN, 2010JFYFY2 to FC).
References
Attar, A., Ripoli, C., Riccardi, E., Maiti, P., Li Puma, D.D., Liu, T., Hayes, J., Jones, M.R., Lichti-Kaiser, K., Yang, F., Gale, G.D., Tseng, C. -h., Tan, M., Xie, C.-W., Straudinger, J.L., Klarner, F.-G., Schrader, T., Frautschy, S.A., Grassi, C., Bitan, G., 2012. Protection of primary neurons and mouse brain from Alzheimer's pathology by mo-lecular tweezers. Brain 135, 3735–3748.https://doi.org/10.1093/brain/aws289. Balaram, P., Hackett, T.A., Polley, D.B., 2018. Synergistic transcriptional changes in
AMPA and GABAA receptor genes support compensatory plasticity following uni-lateral hearing loss. Neuroscience 407, 108–119.https://doi.org/10.1016/j. neuroscience.2018.08.023.
Carunchio, I., Pieri, M., Ciotti, M.T., Albo, F., Zona, C., 2007. Modulation of AMPA re-ceptors in cultured cortical neurons induced by the antiepileptic drug levetiracetam. Epilepsia 48, 654–662.https://doi.org/10.1111/j.1528-1167.2006.00973.x. Chaudhry, F.A., Lehre, K.P., Lookeren Campagne, M. van, Ottersen, O.P., Danbolt, N.C.,
Storm-Mathisen, J., 1995. Glutamate transporters in glial plasma membranes: highly differentiated localizations revealed by quantitative ultrastructural
im-munocytochemistry. Neuron 15, 711–720.https://doi.org/10.1016/0896-6273(95) 90158-2.
Cherubini, E., Conti, F., 2001. Generating diversity at GABAergic synapses. Trends Neurosci. 24, 155–162.https://doi.org/10.1016/S0166-2236(00)01724-0. Colonnier, M., 1968. Synaptic patterns on different cell types in the different laminae of
the cat visual cortex. An electron microscope study. Brain Res. 9, 268–287.https:// doi.org/10.1016/0006-8993(68)90234-5.
Conti, F., Weinberg, R.J., 1999. Shaping excitation at glutamatergic synapses. Trends Neurosci. 22, 451–458.https://doi.org/10.1016/S0166-2236(99)01445-9. del Cid-Pellitero, E., Plavski, A., Mainville, L., Jones, B.E., 2017. Homeostatic changes in
GABA and glutamate receptors on excitatory cortical neurons during sleep depriva-tion and recovery. Front. Syst. Neurosci. 11, 17.https://doi.org/10.3389/fnsys.2017. 00017.
Dumoulin, A., Rostaing, P., Bedet, C., Levi, S., Isambert, M.F., Henry, J.P., Triller, A., Gasnier, B., 1999. Presence of the vesicular inhibitory amino acid transporter in GABAergic and glycinergic synaptic terminal boutons. J. Cell Sci. 112, 811–823. Fattorini, G., Antonucci, F., Menna, E., Matteoli, M., Conti, F., 2015. Co-expression of
VGLUT1 and VGAT sustains glutamate and GABA co-release and is regulated by activity in cortical neurons. J. Cell Sci. 128, 1669–1673.https://doi.org/10.1242/jcs. 164210.
Fattorini, G., Ciriachi, C., Conti, F., 2017. Few, activity-dependent, and ubiquitous VGLUT1/VGAT terminals in rat and mouse brain. Front. Cell. Neurosci. 11.https:// doi.org/10.3389/fncel.2017.00229.
Fattorini, G., Verderio, C., Melone, M., Giovedì, S., Benfenati, F., Matteoli, M., Conti, F., 2009. VGLUT1 and VGAT are sorted to the same population of synaptic vesicles in subsets of cortical axon terminals. J. Neurochem. 110, 1538–1546.https://doi.org/ 10.1111/j.1471-4159.2009.06251.x.
Fremeau, R.T., Kam, K., Qureshi, Y., Johnson, J., Copenhagen, D.R., Storm-Mathisen, J., Chaudhry, F.A., Nicoll, R.A., Edwards, R.H., 2004. Vesicular glutamate transporters 1 and 2 target to functionally distinct synaptic release sites. Science 304, 1815–1819.
https://doi.org/10.1126/science.1097468.
Gras, C., Herzog, E., Bellenchi, G.C., Bernard, V., Ravassard, P., Pohl, M., Gasnier, B., Giros, B., el Mestikawy, S., 2002. A third vesicular glutamate transporter expressed by cholinergic and serotoninergic neurons. J. Neurosci. 22, 5442–5451.https://doi. org/10.1523/jneurosci.22-13-05442.2002.
Gutiérrez, R., 2005. The dual glutamatergic-GABAergic phenotype of hippocampal granule cells. Trends Neurosci. 28, 297–303.https://doi.org/10.1016/j.tins.2005.04. 005.
Jayakar, S.S., Dikshit, M., 2004. AMPA receptor regulation mechanisms: future target for safer neuroprotective drugs. Int. J. Neurosci. 114, 695–734.https://doi.org/10. 1080/00207450490430453.
Kaminski, R.M., Gillard, M., Klitgaard, H., 2012. Targeting SV2A for discovery of anti-epileptic drugs. In: Noebels, J., Avoli, M., Rogawski, M., Olsen, R., Delgado-Escueta, A. (Eds.), Jasper's Basic Mechanisms of the Epilepsies. Oxford University Press, pp. 974–983.https://doi.org/10.1093/med/9780199746545.003.0076.
Kaneko, T., Fujiyama, F., Hioki, H., 2002. Immunohistochemical localization of candi-dates for vesicular glutamate transporters in the rat brain. J. Comp. Neurol. 44, 39–62.https://doi.org/10.1002/cne.10129.
Liu, H., Chapman, E.R., Dean, C., 2013. “Self” versus “Non-Self” connectivity dictates properties of synaptic transmission and plasticity. PLoS One 8 e62414. https://doi. org/10.1371/journal.pone.0062414.
McIntire, S.L., Reimer, R.J., Schuske, K., Edwards, R.H., Jorgensen, E.M., 1997. Identification and characterization of the vesicular GABA transporter. Nature 389, 870–876.https://doi.org/10.1038/39908.
Mennerick, S., Que, J., Benz, A., Zorumski, C.F., 1995. Passive and synaptic properties of hippocampal neurons grown in microcultures and in mass cultures. J. Neurophysiol.
73, 320–332.https://doi.org/10.1152/jn.1995.73.1.320.
Motulsky, H.J., Brown, R.E., 2006. Detecting outliers when fitting data with nonlinear regression - a new method based on robust nonlinear regression and the false dis-covery rate. BMC Bioinf. 7, 123.https://doi.org/10.1186/1471-2105-7-123. Naaijen, J., Bralten, J., Poelmans, G., Glennon, J.C., Franke, B., Buitelaar, J.K., Faraone,
S., Asherson, P., Banaschewski, T., Buitelaar, J., Franke, B., P Ebstein, R., Gill, M., Miranda, A., Oades, R.D., Roeyers, H., Rothenberger, A., Sergeant, J., Sonuga-Barke, E., Anney, R., Mulas, F., Steinhausen, H.C., 2017. Glutamatergic and GABAergic gene sets in attention-deficit/hyperactivity disorder: association to overlapping traits in ADHD and autism. Transl. Psychiatry 7 e999–e999. https://doi.org/10.1038/tp. 2016.273.
Nato, G., Caramello, A., Trova, S., Avataneo, V., Rolando, C., Taylor, V., Buffo, A., Peretto, P., Luzzati, F., 2015. Striatal astrocytes produce neuroblasts in an excitotoxic model of Huntington's disease. Development 142, 840–845.https://doi.org/10. 1242/dev.116657.
O'Brien, R.J., Kamboj, S., Ehlers, M.D., Rosen, K.R., Fischbach, G.D., Huganir, R.L., 1998. Activity-dependent modulation of synaptic AMPA receptor accumulation. Neuron 21, 1067–1078.https://doi.org/10.1016/S0896-6273(00)80624-8.
Olloquequi, J., Cornejo-Córdova, E., Verdaguer, E., Soriano, F.X., Binvignat, O., Auladell, C., Camins, A., 2018. Excitotoxicity in the pathogenesis of neurological and psy-chiatric disorders: therapeutic implications. J. Psychopharmacol. 32, 265–275.
https://doi.org/10.1177/0269881118754680.
Ripoli, C., Cocco, S., Li Puma, D.D., Piacentini, R., Mastrodonato, A., Scala, F., Puzzo, D., D'Ascenzo, M., Grassi, C., 2014. Intracellular accumulation of amyloid-β (Aβ) protein
plays a major role in Aβ-induced alterations of glutamatergic synaptic transmission and plasticity. J. Neurosci. 34, 12893–12903.https://doi.org/10.1523/JNEUROSCI. 1201-14.2014.
Ripoli, C., Piacentini, R., Riccardi, E., Leone, L., Li Puma, D.D., Bitan, G., Grassi, C., 2013. Effects of different amyloid β-protein analogues on synaptic function. Neurobiol. Aging 34, 1032–1044.https://doi.org/10.1016/j.neurobiolaging.2012.06.027. Rosenmund, C., Stevens, C.F., 1996. Definition of the readily releasable pool of vesicles at
hippocampal synapses. Neuron 16, 1197–1207. https://doi.org/10.1016/S0896-6273(00)80146-4.
Safiulina, V.F., Fattorini, G., Conti, F., Cherubini, E., 2006. GABAergic signaling at mossy fiber synapses in neonatal rat hippocampus. J. Neurosci. 26, 597–608.https://doi. org/10.1523/JNEUROSCI.4493-05.2006.
Sagné, C., El Mestikawy, S., Isambert, M.F., Hamon, M., Henry, J.P., Giros, B., Gasnier, B., 1997. Cloning of a functional vesicular GABA and glycine transporter by screening of genome databases. FEBS Lett. 417, 177–183. https://doi.org/10.1016/S0014-5793(97)01279-9.
Takamori, S., 2006. VGLUTs: “Exciting” times for glutamatergic research? Neurosci. Res. 55, 343–351.https://doi.org/10.1016/j.neures.2006.04.016.
Takamori, S., Rhec, J.S., Rosenmund, C., Jahn, R., 2000. Identification of a vesicular glutamate transporter that defines a glutamatergic phenotype in neurons. Nature 407, 189–194.https://doi.org/10.1038/35025070.
Viviani, B., Boraso, M., Marchetti, N., Marinovich, M., 2014. Perspectives on neuroin-flammation and excitotoxicity: a neurotoxic conspiracy? Neurotoxicology (Little Rock) 43, 10–20.https://doi.org/10.1016/j.neuro.2014.03.004.