Research Article
Exhaled Nitric Oxide and Exhaled Breath Temperature as
Potential Biomarkers in Patients with Pulmonary Hypertension
Giovanna Elisiana Carpagnano,
1Alessandro Radaeli
,
2Donato Lacedonia,
1Michele Correale,
3Giuseppe Carpagnano,
3Antonio Palmiotti,
3Maria Pia Foschino Barbaro,
1Matteo Di Biase,
3Natale Brunetti
,
3Giulia Scioscia,
1and Mario Malerba
41Sezione di Malattie dell’Apparato Respiratorio, Dipartimento di Scienze Mediche e Chirurgiche, Universita’ di Foggia, Foggia, Italy 2Dipartimento di Emergenza Urgenza, Spedali Civili di Brescia, Brescia, Italy
3Cardiologia Universitaria, Dipartimento di Scienze Mediche e Chirurgiche, Universita’ di Foggia, Foggia, Italy
4Malattie dell’Apparato Respiratorio, Dipartimento di Medicina Traslazionale, Universit`a del Piemonte Orientale, Novara, Italy
Correspondence should be addressed to Mario Malerba; [email protected]
Received 2 May 2018; Revised 6 July 2018; Accepted 13 August 2018; Published 26 August 2018 Academic Editor: Enrico Heffler
Copyright © 2018 Giovanna Elisiana Carpagnano et al. This is an open access article distributed under the Creative Commons Attribution License, which permits unrestricted use, distribution, and reproduction in any medium, provided the original work is properly cited.
Background. Pulmonary hypertension (PH) is a progressive fatal disease thus, noninvasive prognostic tools are needed to follow
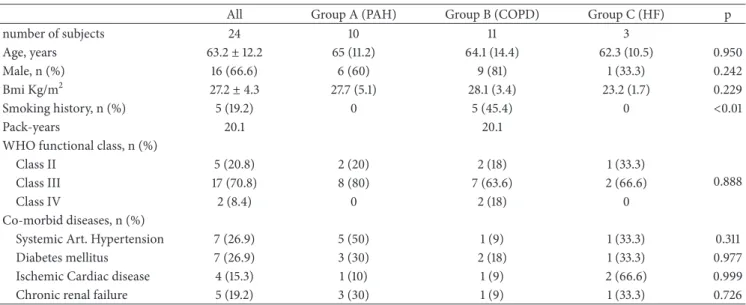
these patients. The aim of our study was to evaluate fractional exhaled nitric oxide (FeNO) and exhaled breath temperature (EBT) values in patients with PH from different causes and to correlate them with respiratory functional data. Methods. Twenty-four PH patients underwent spirometry, carbon monoxide diffusion (DLCO) test, transthoracic echocardiography, right-heart catheterization, and FeNO and EBT measurements. Results. We studied 3 groups according to the type of PH: 10 patients with pulmonary arterial hypertension (PAH) (group A), 11 patients with PH due to chronic obstructive pulmonary disease (COPD) (group B), and 3 patients with PH associated with left heart disease (group C). Mean FeNO values tend to be higher in group B (15.0± 9.3ppb) compared with other groups (respectively, 9.9 ± 5.7 and 8.5 ± 5.2 ppb in groups A and C; p = 0.271) but no statistical significance has been reached. Mean values of alveolar NO concentration (CANO) were higher in groups A and B compared to group C (respectively, 16.9± 12.6; 13.9 ± 6.8; and 6.7 ± 2.0 ppb) (p = 0.045). EBT mean values were significantly lower in group C when compared with other groups (group C: 29.0 +- 1.3∘C, groups A and B: 30.9± 1.3 and 31.2 ± 1.2∘C, respectively: p = 0.041). EBT levels were inversely correlated to mean pulmonary artery pressure (PAPm) levels (Spearman coefficient -0.481; p = 0.017).
Conclusions. eNO, CANO, and EBT have been evaluated in three groups of PH patients. Interestingly EBT reduction was correlated
with PAPm increase, whereas FeNO was higher in COPD patients and CANO in PAH and COPD groups. Further studies are needed to clarify EBT, FeNO, and CANO roles as biomarkers in the monitoring of patients with PH.
1. Background
Pulmonary hypertension (PH) is a disorder associated with multiple clinical conditions; it is characterized by increased vascular resistance and pressure overload of the right ventri-cle. PH can be correlated to the majority of cardiovascular and respiratory disorders in different stages of these diseases. PH is defined as an increased mean pulmonary arterial pressure (PAPm)≥25 mmHg at rest as assessed by right-heart
catheterization (RHC) [1]. The mechanism leading to PH is an imbalance between vasoconstrictors agents and vasodilators such as nitric oxide (NO) in pulmonary circulation [2]. PH is a progressive fatal disease; thus, easy usable and noninvasive prognostic tools are needed for the management of the follow-up of these patients. NO is a strong vasodilator agent and it is synthesized from L-arginine by NO synthase located in different cells of the respiratory tract [3]. A part of NO exhaled during breath flows throughout airways and
Volume 2018, Article ID 7292045, 9 pages https://doi.org/10.1155/2018/7292045
it is detectable in the expired air as fractional exhaled NO (FeNO). FeNO is usually used as a noninvasive marker of lung inflammation in asthma and other pulmonary diseases since it has been observed that its concentration in the exhaled air is related to the presence of eosinophilic infiltration of the airways [4]. FeNO in patients with PH has been evaluated in a limited number of studies [5–10] with very different results. The alveolar contribution to the exhaled NO (CANO) can be estimated by an extended NO analysis [11]. This has been widely applied in a variety of lung diseases and also in patients with PH founding increased alveolar NO concen-trations probably reflecting dysfunctional alveolocapillary diffusion [12]. Other biomarkers in the exhaled air have been determined and among them the exhaled breath temperature (EBT) achieved great interest [13]. Whereas mucosal blood flow is the major contributor to airway temperature, EBT has been used as a marker of inflammation and airway vascularization especially in patients with asthma [14] and COPD [15]. Although the clinical use of this parameter is still uncertain, this measurement is now validated and clear reference limits in healthy subjects have been determined [16].
The aim of this study is to describe FeNO, EBT, and functional test data of the study population. The secondary endpoint is to look for a correlation between FeNO, CANO, and EBT values and pulmonary and cardiac functional data in a group of patients affected by different causes of PH.
2. Patients and Methods
2.1. Patients. We conducted a cross-sectional, observational study including patients with PH in follow-up at the Car-diac Unit, University Hospital of Foggia. All participants voluntarily signed the informed consent form. The study was conducted in accordance with the principles of the Helsinki Declaration and was approved by Local Ethic Institutional Board (Approval Number 17/CE/2014).
Demographics, comorbid diseases, PH type, World Health Organization (WHO) functional class status, and right-heart catheterization findings assessed at the time of diagnosis have been recorded. All patients underwent pul-monary function tests, carbon monoxide diffusion (DLCO) test, six-minute walking distance determination, transtho-racic echocardiography, and FeNO and EBT levels determi-nation. Exclusion criteria were smoking within the preceding 6 months, respiratory tract infection within the preceding 2 weeks, history of hyperreactive airways disease, pregnancy, corticosteroid use with equivalent dose>10 mg of prednisone daily, and use of L-arginine, nitrates, or phosphodiesterase inhibitors.
2.2. Pulmonary Function Tests. Static and dynamic lung volumes were measured using the nitrogen washout method and a pneumotachograph with volume integrator (CAD/Net system 1070; Medical Graphics Corporation; St. Paul, MN) in accordance with the criteria of the American Thoracic Society (ATS) [17]. Lung carbon monoxide diffusion capac-ity (DLCO) was assessed by means of the single-breath
method (PF/DX system; Medical Graphics Corporation) with the patients in the sitting position [18]. The indexes were expressed as percentages of the predicted normal.
2.3. Six Minutes Walking Distance. Walking capacity was evaluated by means of the distance covered during a six-minute walking test (6MWD) according to the ATS statement [19]
2.4. Echocardiography. Conventional echocardiography was used to assess left ventricular dimensions and ejection frac-tion, peak velocities of trans-mitral early (E) and late diastolic (A) LV filling, the ratio of trans-mitral early to late (E/A ratio) left ventricular filling velocity, and E-deceleration time.
Pulmonary artery systolic pressures were estimated using the approach of calculating the systolic pressure gradient between right ventricle and right atrium by the maximum velocity of the tricuspid regurgitant jet, using the modified Bernoulli equation, and then adding to this value the esti-mated right atrial pressures based on both the size of the inferior vena cava and the change in calibre of this vessel with respiration, according to international recommenda-tions [20].
Transthoracic echocardiography was performed with the use of iE33 (Philips Medical Systems, Andover, MA, USA). All echocardiographic studies were performed and inter-preted by experienced physicians. They were blinded of the clinical data.
2.5. Right-Heart Catheterization. Hemodynamic assessment was performed by right-heart catheterization (RHC), accord-ing to recent guidelines [1]. Pulmonary arterial (systolic, diastolic, and mean), right atrial, and pulmonary artery wedge pressures (PAWP) were recorded at the end of a quiet respiratory cycle. Oxygen saturations in the supe-rior vena cava, infesupe-rior vena cava, pulmonary artery, and femoral artery were obtained. Pulmonary vein saturation was assumed at 98%. Pulmonary and systemic flows were obtained by the Fick principle using table-derived oxygen consumption values and calculated oxygen content at the correspondent different sites. Pulmonary and systemic vas-cular resistance indices were calculated using the standard formula.
2.6. Exhaled Breath Temperature Measurement. EBT was measured with X-halo device (Delmedica Investments, Sin-gapore) according to previously validated methods [13]. Briefly, patients were requested to inhale freely through the nose and then to exhale into the device at a rate and depth typical of their normal tidal-breathing rhythm. Ambient temperature was tested and recorded for each measurement with an external thermometer. We measured EBT to different ambient temperature that ranged from 0 to 32∘C.
2.7. Measurement of Fractional Exhaled NO. Measurement of FeNO was performed according to recent guidelines (American Thoracic Society) [4, 21]. The Medisoft FeNO+
Table 1: Demographic characteristics of patients studied.
All Group A (PAH) Group B (COPD) Group C (HF) p
number of subjects 24 10 11 3 Age, years 63.2± 12.2 65 (11.2) 64.1 (14.4) 62.3 (10.5) 0.950 Male, n (%) 16 (66.6) 6 (60) 9 (81) 1 (33.3) 0.242 Bmi Kg/m2 27.2± 4.3 27.7 (5.1) 28.1 (3.4) 23.2 (1.7) 0.229 Smoking history, n (%) 5 (19.2) 0 5 (45.4) 0 <0.01 Pack-years 20.1 20.1
WHO functional class, n (%)
Class II 5 (20.8) 2 (20) 2 (18) 1 (33.3)
0.888
Class III 17 (70.8) 8 (80) 7 (63.6) 2 (66.6)
Class IV 2 (8.4) 0 2 (18) 0
Co-morbid diseases, n (%)
Systemic Art. Hypertension 7 (26.9) 5 (50) 1 (9) 1 (33.3) 0.311
Diabetes mellitus 7 (26.9) 3 (30) 2 (18) 1 (33.3) 0.977
Ischemic Cardiac disease 4 (15.3) 1 (10) 1 (9) 2 (66.6) 0.999
Chronic renal failure 5 (19.2) 3 (30) 1 (9) 1 (33.3) 0.726
Data reported as mean± standard deviation or frequencies.
PAH: pulmonary arterial hypertension; COPD: chronic obstructive pulmonary disease; HF: heart failure; WHO: World Health Organization; Art.: arterial; n.s.: not significant; and p: p value among the groups studied (ANOVA or Chi square)
device, which is a semiportable for repeatable multiflow mea-surement of exhaled NO with offline meamea-surement, was used. It has a software package that provides step-by-step online quality control. The measurement range is 0–600 ppb [22]. FeNO was measured using a previously described restricted breath technique, which employed expiratory resistance and positive mouth pressure to close the velum and exclude nasal NO: expiratory flow measurements at 50 mL/s, 100 mL/s, and a 350 mL/s have been evaluated. Repeated exhalations were performed until three plateaus agreed within 5% of interobservation difference. All the enrolled patients were able to complete the measurements. The contributions of the bronchi (bronchial NO flux) and the alveoli (alveolar concentration of NO: CANO) to FeNO will be derived from regression analysis, with NO output as the dependent and exhalation flow rate as the independent factor. The slope and intercept of the regression line are approximate values of alveolar NO concentration and bronchial NO flux, respectively [23].
2.8. Statistical Analysis. Statistical analysis has been per-formed using SPSS 21.0 software (SPSS 21.0 for Windows; SPSS, Chicago, Illinois). Descriptive statistics were reported as mean, standard deviation (SD), median, and minimum-maximum. Categorical variables were expressed as case numbers and percentages. The normality of distribution of variables was examined using Kolmogorov-Smirnov and Shapiro-Wilk tests. Comparison between two variables was assessed using the paired t-test or Wilcoxon test where appropriated. Comparisons among more than two variables were performed by ANOVA or Kruskal-Wallis test as appro-priate. Comparisons of categorical variables were made using the square 𝜒 test. Spearman correlation test was used to examine the relationship between the variables. A p<0.05 was considered as statistical significant.
3. Results
Demographic characteristics of the studied patients are reported in Table 1. In total 24 patients were enrolled. Patients were divided into 3 groups according to the classification of PH adopted by European Society of Cardiology guidelines [1]: group A was composed of 10 patients with pulmonary arterial hypertension (PAH) (3 patients with idiopathic PH, 6 patients with PH secondary to connective tissue disease, and 1 patient with portal hypertension). Group B was composed of 11 patients with PH secondary to chronic obstructive pulmonary disease (COPD) (in accordance with GOLD recommendations) [24]. Finally, data about 3 patients with heart failure (HF) have been analysed as a separate group (group C: PH associated with HF). Smoking history was present in 5 patients (19.2%) (average 20.1 pack-years) and all patients quit smoking before the study as established by inclusion criteria of the study.
The whole cohort of patients had a moderate to severe WHO functional class: five patients were in class II, 17 in class III, and two in class IV. Patients were mostly men (69.2%) with normal BMI (patients in the group C showed a lower BMI compared to other groups as reported in Table 1). Four patients showed chronic respiratory failure (all of them included in group B). No patients had a documented interstitial lung disease. The prevalences of comorbid diseases are reported in Table 1.
The PAPm was 35.5 ± 8.3 mmHg, mean pulmonary capillary wedge pressure (PAWP) was 13.0 ± 4.6 mmHg, and pulmonary vascular resistance was 4.7 ± 2.2 wood units (WU) at right-heart catheterization. PAPm was higher in group C compared with the other two groups (data reported in Table 2). Patients with PH associated with res-piratory disease (COPD) had lower mean values of Tiffeneau index (FEV1/FVC) compared with other groups (bronchial
T able 2: R ig h t-he ar t ca th et er iza tio n and p u lmo n ar y func tio n d at a o f p at ien ts st udied . G ro u p A (P H A )G ro u p B (C O P D )G ro u p C (H F ) p M ea n PAP (mm H g) 35.5 (8.3) 38.2 (8.3) 59 .3 (2 4) 0.011 32 .5 (2 8-5 3) 37 (2 3-47) 65 (3 3-80) Sy st o lic PA P (mm H g) 72.7 (21.1) 81 .7 (22.3) 101.6 (18.9) 0.158 70 (4 8-1 0 5) 83 (5 0-113) 11 0 (80-115) CI (l/min) 2.98 (0.88) 2.8 9 (0.79) 3.3 3 (0.57) 0.7 10 2.98 (2-5) 2.8 (1 -4) 3 (3-4) P u lm on ar y ca p il lar y w ed ge pre ssu re (m m H g) 13 (4.6) 14.5 (4.4) 16 (1.4) 0.5 98 13 (8-22) 14 (1 0-22) 15 (1 7-21) Pu lmo n ar y vas cu la r resist ance (WU) 4.7 (2.2) 5.1(3.8) 4.8 (1.8) 0.47 8 5.7 (1.8-8.3) 3.6(1.7 -11.3) 5 (1.8-1 0) R ig h t at ri al p re ss u re (m m H g) 8.5 (3.6) 10.2 (2.1) 9.5 (2.2) 0.2 56 9 (2-13) 9 (8-13) 9 (5-1 6) FE V1 (L) 1.9 (8.8 5) 1.5 (0.4 3) 1.13 (0.2 7) 0.1 97 1.7 (1 -3.5) 1.5 (0.79-1.9) 1 (0.9-1.4 3) FE V1 (%p redic te d) 76.7 (1 7.2) 58.5 (15.9) 57 .3 (4.5) 0.07 1 81 (5 5-1 05) 65 (3 1-7 4) 57 (5 3-6 2) FV C (L) 2.5 5 (1.1) 2.9 (1) 1.4 (0 4 5) 0.158 2.4 (1.1 -4.8) 2.8 (1.3-4.4) 1.3 (1 -1.9) FV C (% p re dic te d) 82.5 (21.5) 82.8 (1 9.4) 59 .6 (7 .6) 0.1 95 85 (5 0-11 8) 76 (57 -120) 58 (5 3-6 8) FE V1/FV C 74.3 (12.4) 54.6 (11.8) 79 .6 (16) 0.0 07 73 (5 3-9 3) 54 (3 5-7 1) 73 (6 8-98) D L C O (%p redic te d) 37 .7 (12.4) 41.4 (13.6) 71.6 (7 .6) 0.0 03 36 (2 4-5 9) 4 4 (2 3-6 3) 70 (6 5-80) 6MWD (met er s) 33 6 (1 4 0.3) 35 5.3 (15 3) 27 8.3 (158.5) 0.88 1 29 9(1 6 0-49 7) 39 1(1 0 0 -5 20) 207(1 0 0 -5 20) D at a rep o rt ed as me an (st anda rd d ev ia tio n) and media n (minim um-maxim um). PA P : p u lm o n ar y ar ter y p re ssur e; C I: ca rdiac in dex; W U: w o o d uni ts; FE V1: fo rced exp ira to ry vo lum e in 1 se co n d; F V C : fo rced vi tal ca paci ty ; D L C O: ca rb o n mo no xide diff u sio n; 6MWD: six-min u te walkin g d ist anc e; n .s .: not si gn ifi can t; and p :p va lu e among th e group s stu d ie d (A NO V A )
Table 3: FENO, CANO, and EBT data of all patients with pulmonary hypertension and compared among groups (ANOVA). Mean(SD) Median (min-max)
All patients
FENO50 ppb 11.9 (7.6) 10 (2.2-27.6)
CANO ppb 14.1 (9.7) 12.6 (3-41)
EBT∘C 30.7 (1.4) 30.9 (27.9 – 33.2)
Group A (PAH) Group B (COPD) Group C (HF) p
FENO50 9.9 (5.7) 15.0 (9.3) 8.5 (5.2) 10 (2.8-20.9) 11.8 (2.2-27.6) 8.0 (3.5-14) 0.271 CANO 16.9 (12.6) 13.9 (6.8) 6.7 (2.0) 12.6 (6-41) 13.0 (3-28) 6.3 (5-9) <0.045 EBT 30.9 (1.3) 31.2 (1.2) 29.0 (1.3) <0.041 30.9 (29.1-33.2) 31.4 (29.2-33.1) 28.5 (27.9-30.5)
Data reported as mean (standard deviation) and median (minimum-maximum).
FENO50: fractional exhaled nitric oxide at expiratory flow 50 ml/sec; CANO: alveolar concentration of nitric oxide; EBT: exhaled breath temperature; PAH: pulmonary arterial hypertension; COPD: chronic obstructive pulmonary disease; n.s.: not significant; and p: p value among the groups studied (ANOVA).
obstruction pattern at pulmonary function tests). Patients with PAH and with PH associated with COPD (groups A and B) showed impaired DLCO (<70% predicted). Right-heart catheterization and respiratory function data are represented in Table 2. FeNO measurements have been completed by all patients. Mean FeNO50 values were 11.9 ± 7.6 ppb in the study population. These data conform to what is generally considered the normal limits of FeNO (10.8± 47ppb) [25]. Mean CANO and EBT values were 14.1± 9.7 ppb and 30.7 ± 1-4∘C, respectively.
We recorded some interesting differences among the different PH groups in the comparison between FeNO and EBT values (results are reported in Table 3). Mean FeNO values were higher in group B: 15.0± 9.3 ppb compared with group 1 and group 3 (respectively, 9.9± 5.7 and 8.5 ± 5.2 ppb) even if this trend was not statistically significant (p = 0.271, Figure 1).
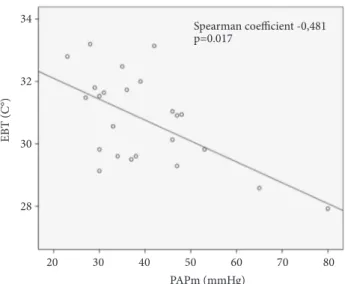
Mean values of CANO were higher in groups A and B (16.9± 12.6; and 13.9 ± 6.8 ppb) compared with the values observed in group C (6.7± 2.0 ppb) (p = 0.045 Figure 2). We also found lower mean EBT values in the group C (PH associated with HF) if compared with groups A and B ones (30.9 ± 1.3∘C versus 30.6 ± 1.3 and 31.2 ± 1.2∘C, respectively, p = 0.041 Figure 3). EBT levels were inversely correlated to PAPm levels, with a Spearman coefficient of -0.481; p = 0.0217 (Figure 4). On the other hand, FeNO and CANO levels showed no correlation with any other vari-able analysed or with comorbidities in the patients studied groups.
4. Discussion
We conducted a cross-sectional, observational study on a group of patients with PH, whose diagnosis was confirmed by RHC, evaluating pulmonary function tests and FeNO and EBT determination. This is one of the few studies directly assessing RHC data and correlating with the respiratory functional ones. FEN O50 (p pb) p=0.271 Group A (PAH) Group B (COPD) Group C (HF) 25 30 20 15 10 0 5
Figure 1: Boxplot showing FENO50(fractional exhaled nitric oxide at 50 ml/sec flow) values in the studied groups. Thick line showing median, box showing 25% and 75% interquartile ranges, and error bars showing minimum and maximum values. Small circles indicate outlier values. Groups were compared by ANOVA (PAH, pulmonary artery hypertension; COPD, chronic obstructive pulmonary disease; and HF, heart failure).
The main findings of this study were as follows: (i) FeNO values were different between groups, even though nonstatis-tically significant, with higher values observed in respiratory group (group B) showing the presence of enhanced NO from the large airways; (ii) CANO levels were higher in PAH and respiratory groups (groups A and 2) probably reflecting the reduced diffusion capacity from alveolar to vascular space as demonstrated by the impaired DLCO observed in these patients; and (iii) EBT was lower in group C showing an inverse relationship with PAPm values.
The role of endogenous production of NO in PH up to now is still uncertain and very controversial. Previous published data demonstrated that FeNO levels are reduced
p=0.045 p=0.02 0 10 20 30 40 50 Group A (PAH) Group B (COPD) Group C (HF) CAN O (p pb)
Figure 2: Boxplot showing CANO (alveolar concentration of nitric oxide) values in the studied groups. Thick line showing median, box showing 25% and 75% interquartile ranges, and error bars showing minimum and maximum values. Small circles indicate outlier values. Groups were compared by ANOVA and Wilcoxon test (PAH, pulmonary artery hypertension; COPD, chronic obstructive pulmonary disease; and HF, heart failure).
p=0.043 p=0.019 Group A (PAH) Group B (COPD) Group C (HF) EB T (C °) 34 32 30 28
Figure 3: Boxplot showing EBT (exhaled breath temperature) val-ues in the studied groups. Thick line showing median, box showing 25% and 75% interquartile ranges, and error bars showing mini-mum and maximini-mum values. Groups were compared by ANOVA and Wilcoxon test (PAH, pulmonary artery hypertension; COPD, chronic obstructive pulmonary disease; and HF, heart failure).
or normal in patients with PH, even considering the different classification groups of patients; [7, 26–28] some authors found that FeNO levels are especially elevated when asso-ciated with systemic sclerosis and interstitial lung diseases (ILD) [29]. In summary, available literature data about FeNO values in patients with PH describe reduced levels if compared with normal subjects except in cases of airways or
PAPm (mmHg) EB T (C °) Spearman coefficient -0,481 p=0.017 34 32 30 28 20 30 40 50 60 70 80
Figure 4: Scatterplot showing correlation between EBT (exhaled breath temperature) and PAPm (mean pulmonary arterial pressure) in the studied patients (whole group).
alveolar inflammation. The underlying mechanisms associ-ated with these reduced levels of FeNO in PH patients may include (I) the reduction of substrate for NO production as demonstrable by the fact that L-arginine oral administration increased NO levels in precapillary PH [30]; (II) reduced NO production by endothelial NO synthase (eNOS), as in idiopathic PAH the levels of dimethylarginine (a potent eNOS inhibitor) are higher [31]; and (III) reduced pulmonary expression of eNOS itself has been hypothesized in PAH too [32]. Finally a reduced diffusion capacity of NO from alveolar to vascular space due to pathological modifications of the pulmonary tissue may support the reduced FeNO values in PH patients. Probably our results are explained by the fact that the underlying respiratory disease in group B induces a certain degree of airway inflammation that supports the (modest) production of bronchial NO, although within the limits of normality [25].
An increase in CANO values has been already observed in previous published papers [7, 9]; it was related to the presence of a preserved alveolar synthesis of NO in presence of a reduced alveolar vascular-diffusion due to tissue pathological alterations. Our results are in line with these data as we observed reduced DLCO levels in case of higher CANO ones. If we consider the previous literature CANO normal levels ranging about 1.8± 0.2 ppb [7], the levels found in all the groups of our cohort were higher and this could be probably explained by the fact that all showed decrease DLCO values. It is interesting to highlight that elevated CANO levels were observed in PH patients with involvement in local pulmonary pathophysiology (IPAH, connective disease, COPD, etc.). Our data confirmed that CANO levels were lower in types of PH associated with heart failure.
To our best knowledge, this is the first study analysing EBT in PH patients. Recently EBT normal levels have been
established ranging about 30.66 C∘measured at 22∘C in non-smoking healthy subjects [16]. According to previous pub-lished data we confirmed that EBT was lower in patents with more severe PH (as demonstrated by the inverse relationship with PAPm). These data suggest that reduced EBT values may reflect a decreased bronchial vascularization due to vascular degeneration in more advanced stages of PH, as the matter of the fact that mucosal blood flow is the major contributor to airway temperature. Literature data about EBT underline a possible relationship between asthma inflammation and airways remodelling too [33]. Moreover, in asthma elevated rates of exhaled breath temperature changes and bronchial blood flow have been related to increased vascularity of the airway mucosa as a result of inflammation [34]. In the same way, we may hypothesize that some mechanisms leading to HP alteration of bronchial mucosal blood flow may be revealed by the reduction of EBT when compared to normal values, especially in patients with high levels of PAPm; this may reflect the changes in bronchial blood flow and heat exchange resulting in decreased bronchial vascularization. A comparison of cardiac index values did not show any significant difference among groups suggesting that blood flow alterations should be localized only in bronchial mucosa. According to our data, we observed a direct correlation between 6MWD and EBT (spearman = 0.539 p = 0.021) suggesting that low levels of EBT may predict the clinical severity of PH in these patients
One of the possible limitations of the study is the low number of subjects included, because PH types are numerous and with different underlying diseases due to equally different pathophysiological mechanisms. Therefore, the study of homogenous group of patients with PH is also difficult in relation to the relative rarity of the dis-ease. In particular, the small number of patients with HF enrolled in group 3 compels us to be extremely cautious in generalizing the results of the study. Another possible limitation could be the lack of data about airway inflamma-tory cell patterns of the studied patients. These limitations make difficult to establish whether patients enrolled with COPD could be classified as overlap of asthma and COPD (ACO); however, patients in group B had no history of atopy or asthma or bronchial reversibility exceeding 12% or 200 ml (which are major criteria for the diagnosis of ACO) [35]
5. Conclusions
In summary our data show that the different biomarkers evaluated in different groups of patients with PH could be in relation to the pathophysiological nature of the disease. The most original and interesting result is the association between EBT reduction and PAPm increase. This relationship could be due to an alteration of bronchial blood flow and reflects the presence of a “remodelling” of airways structures in these patients. These data, if confirmed by larger trials, open new perspectives for future studies aimed at assessing a possible role of FeNO, CANO, and particularly EBT as biomarkers in PH and in the clinical monitoring of these patients.
Abbreviations
6MWD: Six-minute walking distance ACO: Asthma COPD overlap BMI: Body mass index
COPD: Chronic obstructive pulmonary disease CANO: Nitric oxide alveolar concentration DLCO: Carbon monoxide diffusion EBT: Exhaled breath temperature FeNO: Fractional exhaled nitric oxide FEV1: Forced expiratory volume in 1 second FVC: Forced vital capacity
NO: Nitric oxide
PH: Pulmonary hypertension PAH: Pulmonary artery hypertension PAP: Pulmonary artery pressure PAPm: Mean pulmonary artery pressure PAWP: Pulmonary artery wedge pressure RHC: Right-heart catheterization SD: Standard deviation WHO: World health organization WU: Wood units.
Data Availability
The data used to support the findings of this study are available from the corresponding author upon request.
Ethical Approval
This study was conducted in accordance with Good Clinical Practice guidelines and the Declaration of Helsinki. The study was approved by Local Ethic Institutional Board (Approval Number 17/CE/2014).
Consent
All patients provided written informed consent prior to the performance of any screening evaluations.
Conflicts of Interest
The authors declare that they have no conflicts of interest.
Authors’ Contributions
Maria Pia Foschino Barbaro, Giovanna Elisiana Carpagnano, and Mario Malerba contributed conception and design. Alessandro Radaeli and Mario Malerba participated in draft-ing and writdraft-ing the manuscript. Donato Lacedonia, Michele Correale, and Giuseppe Carpagnano contributed to acquisi-tion of data. Antonio Palmiotti and Matteo Di Biase carried out analysis of data. Natale Brunetti and Giulia Scioscia car-ried out data interpretation. All coauthors critically revised the article and gave final approval of this version to be published.
References
[1] N. Gali`e, M. Humbert, J.-L. Vachiery, S. Gibbs, I. Lang, A. Torbicki et al., “2015 ESC/ERS Guidelines for the diagnosis and treatment of pulmonary hypertension,” European Heart Journal, vol. 37, no. 1, pp. 67–119, 2016, http://www.ncbi.nlm.nih.gov/ pubmed/26320113.
[2] M. Humbert, N. W. Morrell, S. L. Archer et al., “Cellular and molecular pathobiology of pulmonary arterial hypertension,”
Journal of the American College of Cardiology, vol. 43, no. 12, pp.
13S–24S, 2004.
[3] U. F¨orstermann and W. C. Sessa, “Nitric oxide synthases: regulation and function,” European Heart Journal, vol. 33, no. 7, pp. 829–837, 2012.
[4] R. A. Dweik, P. B. Boggs, S. C. Erzurum et al., “An official ATS clinical practice guideline: interpretation of exhaled nitric oxide levels (FENO) for clinical applications,” American Journal of
Respiratory and Critical Care Medicine, vol. 184, no. 5, pp. 602–
615, 2011.
[5] G. Cremona, T. Higenbottam, C. Borland, and B. Mist, “Mixed expired nitric oxide in primary pulmonary hypertension in relation to lung diffusion capacity,” QJM: An International
Journal of Medicine, vol. 87, no. 9, pp. 547–551, 1994.
[6] E. Clini, G. Cremona, M. Campana et al., “Production of endogenous nitric oxide in chronic obstructive pulmonary disease and patients with cor pulmonale: Correlates with echo-doppler assessment,” American Journal of Respiratory and
Critical Care Medicine, vol. 162, no. 2 I, pp. 446–450, 2000.
[7] R. E. Girgis, M. K. Gugnani, J. Abrams, and M. D. Mayes, “Partitioning of alveolar and conducting airway nitric oxide in scleroderma lung disease,” American Journal of Respiratory and
Critical Care Medicine, vol. 165, no. 12, pp. 1587–1591, 2002.
[8] R. E. Girgis, H. C. Champion, G. B. Diette, R. A. Johns, S. Permutt, and J. T. Sylvester, “Decreased exhaled nitric oxide in pulmonary arterial hypertension,” American Journal of
Respira-tory and Critical Care Medicine, vol. 172, no. 3, pp. 352–357, 2005.
[9] Z. Cao, S. C. Mathai, L. K. Hummers et al., “Exhaled nitric oxide in pulmonary arterial hypertension associated with systemic sclerosis,” Pulmonary Circulation, vol. 6, no. 4, pp. 545–550, 2016.
[10] N. O. Akbay, Z. Bingol, E. Kiyan et al., “Fractional Exhaled nitric oxide measurement in pulmonary hypertension: a follow-up study,” Clinical and Applied Thrombosis/Hemostasis, vol. 24, no. 3, pp. 483–488, 2018.
[11] C. Brindicci, K. Ito, O. Resta, N. B. Pride, P. J. Barnes, and S. A. Kharitonov, “Exhaled nitric oxide from lung periphery is increased in COPD,” European Respiratory Journal, vol. 26, no. 1, pp. 52–59, 2005.
[12] A. Malinovschi, D. Henrohn, A. Eriksson, J. O. Lundberg, K. Alving, and G. Wikstr¨om, “Increased plasma and salivary nitrite and decreased bronchial contribution to exhaled NO in pulmonary arterial hypertension,” European Journal of Clinical
Investigation, vol. 41, no. 8, pp. 889–897, 2011.
[13] T. A. Popov, T. Z. Kralimarkova, M. Labor, and D. Plavec, “The added value of exhaled breath temperature in respiratory medicine,” Journal of Breath Research, vol. 11, no. 3, 2017. [14] P. Paredi, S. A. Kharitonov, and P. J. Barnes, “Faster rise of
exhaled breath temperature in asthma: a novel marker of airway inflammation?” American Journal of Respiratory and Critical
Care Medicine, vol. 165, no. 2, pp. 181–184, 2002.
[15] P. Paredi, G. Caramori, D. Cramer et al., “Slower rise of exhaled breath temperature in chronic obstructive pulmonary disease,”
European Respiratory Journal, vol. 21, no. 3, pp. 439–443, 2003.
[16] G. E. Carpagnano, M. P. Foschino-Barbaro, C. Crocetta et al., “Validation of the exhaled breath temperature measure: reference values in healthy subjects,” CHEST, vol. 151, no. 4, pp. 855–860, 2017.
[17] M. R. Miller, J. Hankinson, V. Brusasco, F. Burgos, R. Casaburi, A. Coates et al., “Standardisation of spirometry,” European
Respiratory Journal, vol. 26, no. 2, pp. 319–338, 2005, http://www
.ncbi.nlm.nih.gov/pubmed/16055882.
[18] B. L. Graham, V. Brusasco, F. Burgos et al., “Executive Summary: 2017 ERS/ATS standards for single-breath carbon monoxide uptake in the lung,” European Respiratory Journal, vol. 49, no. 1, p. 16E0016, 2017.
[19] D. Brooks and S. Solway, “ATS statement on six-minute walk test,” American Journal of Respiratory and Critical Care
Medicine, vol. 167, no. 9, pp. 1287-1287, 2003.
[20] L. G. Rudski, W. W. Lai, J. Afilalo et al., “Guidelines for the echocardiographic assessment of the right heart in adults: a report from the American Society of Echocardiography endorsed by the European Association of Echocardiography, a registered branch of the European Society of Cardiology, and the Canadian Society of Echocardiography,” Journal of the
American Society of Echocardiography, vol. 23, no. 7, pp. 685–713,
2010.
[21] “ATS/ERS recommendations for standardized procedures for the online and offline measurement of exhaled lower respiratory nitric oxide and nasal nitric oxide, 2005,” American Journal of
Respiratory and Critical Care Medicine, vol. 171, no. 8, pp. 912–
930, 2005.
[22] M. Maniscalco, C. Vitale, A. Vatrella, A. Molino, A. Bianco, and G. Mazzarella, “Fractional exhaled nitric oxide-measuring devices: technology update,” Medical Devices: Evidence and
Research, vol. 9, pp. 151–160, 2016.
[23] N. M. Tsoukias and S. C. George, “A two-compartment model of pulmonary nitric oxide exchange dynamics,” Journal of Applied
Physiology, vol. 85, no. 2, pp. 653–666, 1998.
[24] “lobal Strategy for the Diagnosis, Management and Prevention of COPD, Global Initiative for Chronic Obstructive Lung Disease (GOLD) 2017,” http://goldcopd.org, 2017.
[25] M. Olivieri, G. Talamini, M. Corradi, L. Perbellini, A. Mutti, and M. Malerba, “Reference values for exhaled nitric oxide (reveno) study,” in Respiratory Research, vol. 7, 94 edition, 2006. [26] P. Carratu, C. Scoditti, M. Maniscalco et al., “Exhaled and
arterial levels of endothelin-1 are increased and correlate with pulmonary systolic pressure in COPD with pulmonary hyper-tension,” BMC Pulmonary Medicine, vol. 8, article 20, 2008. [27] A. R. Tonelli, S. Haserodt, M. Aytekin, and R. A. Dweik, “Nitric
oxide deficiency in pulmonary hypertension: pathobiology and implications for therapy,” Pulmonary Circulation, vol. 3, no. 1, pp. 20–30, 2013.
[28] M. Malerba, A. Radaeli, B. Ragnoli et al., “Exhaled nitric oxide levels in systemic sclerosis with and without pulmonary involvement,” CHEST, vol. 132, no. 2, pp. 575–580, 2007. [29] G. Rolla, P. Colagrande, E. Scappaticci et al., “Exhaled nitric
oxide in systemic sclerosis: relationships with lung involvement and pulmonary hypertension,” The Journal of Rheumatology, vol. 27, no. 7, pp. 1693–1698, 2000.
[30] N. Nagaya, M. Uematsu, H. Oya et al., “Short-term oral admin-istration of L-arginine improves hemodynamics and exercise
capacity in patients with precapillary pulmonary hypertension,”
American Journal of Respiratory and Critical Care Medicine, vol.
163, no. 4, pp. 887–891, 2001.
[31] J. T. Kielstein, S. M. Bode-B¨oger, G. Hesse, J. Martens-Lobenhoffer, A. Takacs, D. Fliser et al., “Asymmetrical dimethy-larginine in idiopathic pulmonary arterial hypertension,”
Arte-riosclerosis, Thrombosis, and Vascular Biology, vol. 25, no. 7, pp.
1414–1418, Apr 2005.
[32] A. Giaid and D. Saleh, “Reduced expression of endothelial nitric oxide synthase in the lungs of patients with pulmonary hypertension,” The New England Journal of Medicine, vol. 333, no. 4, pp. 214–221, 1995.
[33] G. L. Piacentini, D. G. Peroni, A. Bodini, M. Corradi, and A. L. Boner, “Exhaled breath temperature as a marker of airway remodelling in asthma: a preliminary study,” Allergy: European
Journal of Allergy and Clinical Immunology, vol. 63, no. 4, pp.
484-485, 2008.
[34] P. Paredi, S. A. Kharitonov, and P. J. Barnes, “Correlation of exhaled breath temperature with bronchial blood flow in asthma,” Respiratory Research, vol. 6, no. 1, 2005.
[35] D. D. Sin, “Asthma-COPD overlap syndrome: what we know and what we don’t,” Tuberculosis and Respiratory Diseases, vol. 80, no. 1, p. 11, 2017.