Research Article
Chemical and Microbiological Characterization for PDO
Labelling of Typical East Piedmont (Italy) Salami
V. Gianotti,
1S. Panseri,
2E. Robotti,
1M. Benzi,
1E. Mazzucco,
1F. Gosetti,
1P. Frascarolo,
1M. Oddone,
1M. Baldizzone,
1E. Marengo,
1and L. M. Chiesa
21Dipartimento di Scienze dell’Ambiente e della Vita, University of Piemonte Orientale, Viale T. Michel 11, 15121 Alessandria, Italy
2Dipartimento di Scienze Veterinarie e Sanita’ Pubblica, University of Milano, Via Celoria 10, 20133 Milano, Italy
Correspondence should be addressed to V. Gianotti; [email protected] Received 18 September 2014; Revised 26 December 2014; Accepted 6 January 2015 Academic Editor: Vibeke Orlien
Copyright © 2015 V. Gianotti et al. This is an open access article distributed under the Creative Commons Attribution License, which permits unrestricted use, distribution, and reproduction in any medium, provided the original work is properly cited. This study is focused on the characterisation of typical salami produced in Alessandria province (North West of Italy). Seventeen small or medium salami producers from this area were involved in the study and provided the samples investigated. The aim is double and consists in obtaining a screening of the characteristics of different products and following their evolution along ripening. The study involved five types of typical salami that were characterised for aroma components and nutritional features. This approach could provide a basis for a possible PDO or PGI label request. Principal Component Analysis and cluster analysis were used as multivariate statistical tools for data treatment. The overall results obtained point out that the products investigated do not deviate from analogous European products and show the possibility of characterising by specific parameters three main groups of samples: Salamini di Mandrogne, Muletta, and Nobile Giarolo; moreover some considerations can also be drawn with respect to the nutritional characterization considering the biogenic amines profile.
1. Introduction
The general term “salami” indicates stuffed meat products, very diffused and largely consumed because of their textu-ral, sensorial, and nutritional properties. Different kinds of salami can be distinguished as a function of several factors, that is, fineness of the meat, formulation, consistency, and storage conditions [1]. The different appearance and taste also depend on the production strategies, the addition of spices, the use of microbial starters, and the environmental parameters experienced during fermentation and ripening processes. To protect the peculiarity of a typical product, it is first necessary to identify and quantify those variables that better describe its characteristics. These features permit pro-moting the product through the development of a certificate of origin that also reports the production process and the geographical origin. To this purpose a series of chemical and microbiological analyses are generally performed. Volatile organic compounds (VOCs) characterisation is useful to investigate the aroma properties of meat products [2–7].
The typical aroma of the products depends on a large number of volatile species, whose nature and amount can be related to the raw matter composition and the different ingredients as well as to the processing conditions including fermentation and ripening. The aroma can arise from a complex pattern of chemical reactions that take place among components, as, for example, oxidation of unsaturated fatty acids or microbiological metabolisms of lipids, proteins, and carbohydrates. The analysis of the volatile fraction has been associated with the compositional, biochemical, and micro-biological characterisation to compare three Italian PDO (Protected Denomination of Origin) fermented sausages (namely, Varzi, Brianza, and Piacentino) [8]. Only few data are present regarding the characterisation of long ripened salami and, to our knowledge, no study simultaneously treats the chemical and microbiological data with methods of multivariate data analysis [7, 9]. Characterisation analyses concerning the distinctive properties of typical products are often promoted by authorities with the aim to support the possible request of PDO and PGI (Protected Geographical Volume 2015, Article ID 597471, 22 pages
Indication) labelling. The present paper presents a wide characterisation study of typical homemade salami produced in the Alessandria province (North West of Italy). The scope of this work regards screening the characteristics of five different products (Muletta Monferrina, Salame Nobile del
Giarolo, Filetto Baciato, Tipico Tortonese, and Salamini di Mandrogne) and following their evolution along ripening:
microbiological and chemical analyses were carried out regarding both nonvolatile and volatile fractions. The analysis of the nonvolatile fraction and the microbiological deter-minations gives information about taste, as well as about ripening time and hygienic conditions of production. In particular, the iodine value (index of the unsaturation degree of fat) [10, 11] and the saponification number (measure of the average molecular weight of all fat present in the sample) give useful information about the nutritional characteristics; metal content instead, in particular the rare earth elemental composition, can be very useful to provide information about the geographical provenience [12, 13]. All data collected were treated by multivariate statistical analysis techniques as Principal Component Analysis (PCA) and Cluster Analysis. PCA was firstly applied to the overall set of data collected at all the ripening stages considered, to provide a general description of the relationships existing between samples and variables. Then, the analysis was focussed on the samples collected at the selling stage only, to provide a description of the products as they reach the consumer table.
2. Materials and Methods
2.1. Salami Samples. Five different local salami products were
involved in the study, namely, Muletta Monferrina, Salame
Nobile del Giarolo, Filetto Baciato, Tipico Tortonese, Filzetta,
and Salamini di Mandrogne. The samples were provided by the 17 producers cooperating to the study, in particular, nine different producers regarding Salamini di Mandrogne and two different salami factories for the other salami products. Sam-ples were provided both at their production time (𝑇0) and at different time points during ripening, comprising the selling time. Different typical products show different monitoring schedule along time, as they show different optimal ripening periods until selling: 2, 3, 4, 5, and 6 months (𝑇2–𝑇6) for
Muletta Monferrina; 1, 2, 3, and 4 months (𝑇1–𝑇4) for Nobile
del Giarolo; 1 and 2 months (𝑇1-𝑇2) for Filetto Baciato and
Tipico Tortonese. Salamini di Mandrogne were analysed only
at the production time (𝑇0) as they are sold fresh. The salami analysed was identified by a four-character label: the first two letters indicate the type of sample (MU = Muletta, FI = Filetto, GI = Giarolo, SM = Salamini di Mandrogne, and SA = Tipico
Tortonese); the third letter indicates the manufacturer (A or
B); the fourth character is a number indicating the months of ripening and ranges from 0 (production time) to 6 (number of months of ripening). Samples were provided in triplicate by each producer for each ripening time; results for each determination were provided for each sample and the three replicates for each producer were then averaged.
2.2. Chemicals. KOH≥ 85.5%, CCl4 ≥ 99.8%, CH3COONa ≥ 99%, Na2SO4 ≥ 99.5%, Na2HPO4⋅12 H2O ≥ 99%, and
Na2C2O4 ≥ 98% were purchased from Carlo Erba (Milan, Italy). CuSO4≥ 99%, K2SO4≥ 99%, Se ≥ 99%, H2SO4≥ 95– 98%, NaOH≥ 98%, KI ≥ 99%, HCOOH ≥ 96% ACS, KNO2≥ 97%, CH3COONH4 ≥ 99.9%, Na2S2O3 ≥ 99%, 1% (w/V) water solution of starch indicator, L-lysine≥ 98%, tryptamine hydrochloride 99%, methyl red crystals ACS reagent, phe-nolphthalein RPE-ACS, and the C6–C22 series of𝑛-alkanes were purchased from Sigma-Aldrich (Schnelldorf, Germany). Acetonitrile ≥ 99.9% HPLC grade, HCOONH4 ≥ 99.9%, and HCl ≥ 37% were purchased from VWR International (Darmstadt, Germany). Ethyl alcohol ≥ 99.8%, cadaverine dihydrochloride> 99%, histamine dihydrochloride > 99%, dansyl chloride ≥ 99%, petroleum ether puriss. p.a. ACS reagent bp 40–60∘C, L-histidine≥ 99.5%, L-tyrosine ≥ 99%, octylamine≥ 99%, NaHCO3≥ 99%, and HNO3≥ 69.5% were purchased from Fluka (Buchs, Switzerland). H3PO4 ≥ 85%, KNO3 ≥ 99%, KCl ≥ 99.5%, and Symphony potentiometric buffer solutions (pH 4.00, 7.00, and 10.00) were purchased from Merck (Darmstadt, Germany). Hydromatrix was pur-chased from Varian (Palo Alto, CA, USA) and Wijs solution 0.1 M in acetic acid from Riedel de Haen (Seelze, Germany). MRS agar was purchased from LAB M (Bury, UK), Tryptone Soya Agar and Mannitol Salt Agar were purchased from Oxoid (Rodano Milan, Italy). Ultrapure water was produced by a Millipore Milli-Q system (Milford, MA, USA).
2.3. Equipment. The following apparatus were used for the
preparation of the samples: Stomacher Circulator (PBI Inter-national, Milan, Italy), oven EWTQ905 (Falc Instruments, Treviglio, Bergamo, Italy), muffle Pyro High Temperature Microwave (Milestone, Shelton, CT, USA), accelerated sol-vent extractor ASE 100 (Dionex, Sunnyvale, CA), cen-trifuge IC CL31R Multispeed (Thermo Electron Corporation, Waltham, MA, USA), and Sartorius balance CP225D-0CE (0.00001 g) (Goettingen, Germany). pH measurements were performed by a Symphony SB70P pH meter (VWR, Darm-stadt, Germany), equipped with a combined glass Ag/AgCl electrode. Conductivity was measured by a conductometer ATC HI 9033 (Hanna Instruments, Woonsocket, RI, USA). HPLC analyses of nitrite and nitrate ions were carried out by a Merck-Hitachi HPLC system (Tokyo, Japan) equipped with L-6200 intelligent pump interfaced to an L-4250 UV-Vis detector and to D-2500 Chromato-integrator. Biogenic amines and their precursor amino acids were determined by HPLC Spectra System (Providence, RI, USA), equipped with a Spectra System pump P4000, a Spectra System SCM 1000 degasser, an autosampler Spectra System AS 3000, UV 6000 LP detector, and the software ChromQuest. Metals determination was performed by a Thermo Fisher XSeries 2 ICP-MS (Winsford, UK), equipped with an Apex-Q fully-integrated inlet system (Elemental Scientific Inc. Omaha, USA) and the software PlasmaLab V2.5.4.289. The analysis of volatile compounds was carried out on a TraceGC Ultra gas chromatograph (Thermo Finnigan, Milan, Italy) equipped with a split/splitless (SSL) injector, a CombiPal (CTC analyt-ics, Zwingen, Switzerland) autosampler and coupled with a TRACE DSQ (Finnigan, Milan, Italy) mass spectrometer.
2.4. Sample Pretreatment. The salami samples delivered to
our laboratory were immediately sliced and minced. In a portion of the fresh sample, treated as successively described, pH, moisture, conductivity, nitrite, and nitrate content were immediately determined, while all other analyses were per-formed on the fraction stored in freezer at−25∘C. To measure pH, conductivity, nitrite, and nitrate, 10.0 g of fresh sample was kept in contact with 90.0 mL of ultrapure water in a stomacher bag and digested for 5.0 min at 270 rpm; then the extract was filtered on filter paper. For the determination of fat and iodine value, a sample of 10.0 g of thawed salami was put in an ASE (Accelerated Solvent Extraction) cell with 5.0 g of hydromatrix and extracted by petroleum ether performing 3 cycles of extraction of 10.0 min each, at 160.0∘C.
For ash percentage and metal ion determinations, 5.0 g of sample was treated in muffle under a linear temperature gradient reaching 820.0∘C in 1 h 20. The analysis of volatile compounds was performed on 10.0 g of sample cut in very thin slices and weighted into a 20.0 mL headspace vial, sealed with polytetrafluoroethylene- (PTFE-) coated silicone rubber septum (20 mm diameter), where they were left for 60 min at 25∘C. After each analysis the fibre was kept for 15 min at 280∘C.
2.5. Methods
2.5.1. HPLC Determination of Nitrite and Nitrate. Nitrite
and nitrate determination was performed on the stomacher aqueous extract filtered on a 0.22𝜇m PTFE filter (VWR International, Darmstadt, Germany) and diluted 1/10 v/v.
The mobile phase was an aqueous solution of octy-lamine 5.0 mM brought to pH 6.4 by o-phosphoric acid; the stationary phase was a Lichrospher C18e (250× 4 mm, 5𝜇m) column with a Lichrospher RP-18 (5 𝜇m) precolumn (Merck, Darmstadt, Germany). The mobile phase flow rate was 1.0 mL min−1, the injection volume was 100.0𝜇L, and wavelength of the UV detector was set at 205 nm.
2.5.2. HPLC Determination of Amino Acids and Biogenic Amines. The dansylation reaction of aminoacids and
bio-genic amines was performed on a solution obtained putting 10.0 g of sample in contact with 100.0 mL HCl 0.1 M in a stomacher bag and digested for 5.0 min at 270 rpm; the extract was centrifuged for 10.0 min at 8000 rpm (25000×g). 1200𝜇L of extract was put in contact with 1200 𝜇L of NaHCO3 and 1200𝜇L of a dansyl chloride solution 0.02 M in acetone. The mixture was kept at dark for 40.0 min at 65∘C and then centrifuged for 2.0 min at 10000 rpm and undergone to solid phase extraction (SPE). After conditioning the C18 SPE cartridge (50 mg of sorbent) (Phenomenex, Bologna, Italy) with 2.00 mL of methanol and 2.00 mL of a water/acetone 50/50 (v/v) mixture, 2.00 mL of the derivatized sample was loaded and a washing step was performed with 3.00 mL of Milli Q water. The cartridge was dried under nitrogen and the sample recovered in 2.00 mL of methanol. For the HPLC determination of biogenic amines and precursor aminoacids, a Lichrospher C18e (250× 4 mm, 5 𝜇m) column with a Lichrospher RP-18 (5𝜇m) precolumn (Merck, Darm-stadt, Germany) was employed, while the mobile phase was
a mixture of CH3COONH49.0 mM (at pH 3.40 for HCOOH) (41%) and acetonitrile (59%). The mobile phase flow rate was 1.0 mL min−1and the UV detector set at 254 nm.
2.5.3. Water Content. Water content was determined by the
comparison of the solid sample weights before (5.0 g) and after the oven treatment performed at 105.0∘C for 2.5 h [15].
2.5.4. Saponification Value. The saponification value (𝑆) was
determined directly on 5.0 g of salami put in contact with 25.00 mL of 0.5 N ethanol solution of KOH in a flask equipped with a reflux condenser. The system was heated for 20 min and then the mixture was centrifuged for 5 min at 5000 rpm; the supernatant was titrated with HCl 0.5 N, phenolphthalein being the indicator.
The saponification value was calculated through the fol-lowing equation:
𝑆 = (𝑉𝑏− 𝑉𝑤𝑠) ⋅ 28.05, (1) where 𝑉𝑏 is the volume (mL) of titrant used in the blank titration,𝑉𝑠is the volume (mL) obtained in the titration of the sample, and𝑤 is the weight (5.0 g) of the sample.
2.5.5. Fat Content. The fat content was determined by
weight-ing the residual of the ASE extract after complete solvent evaporation [16].
2.5.6. Iodine Value. The iodine value (𝐼) was determined by
adding 20.00 mL of CCl4to the ASE extract. After agitation for 5 min, 25.00 mL of Wijs solution was added and the resulting mixture was kept at dark for 1 h; after addition of 20.00 mL of KI solution 10% w/v, the solution was titrated with Na2S2O3 0.1 N with starch solution as indicator. The iodine value is calculated as follows:
𝐼 = (𝑉𝑏− 𝑉𝑠) ⋅ 12.69
𝑤 , (2)
where𝑉𝑏is the volume (mL) employed in the titration of the blank,𝑉𝑠is the volume (mL) employed in the titration of the sample, and𝑤 is the weight (g) of sample [17].
2.5.7. Ash Content. The ash content was determined by
weighting the muffle mineralised sample after 20 min of cooling at room temperature.
2.5.8. Protein Determination according to the Kjeldahl Method.
1.0 g of the sample was placed in Kjeldahl flask and added with 20.0 g of K2SO4, 0.55 g of CuSO4, 0.75 g of Se, and 35.0 mL of H2SO418 M. The flask was heated in a mantle for one hour at the solution fuming temperature. Then 100.0 mL of ultrapure water and 250.0 mL of NaOH 20% (w/v) were added to the cooled solution and the resulting mixture was heated. The first 50 mL of the distilled fraction was recovered in a flask, containing 50.0 mL of HCl 0.1 N. The excess of HCl was
titrated with NaOH 0.1 N, methyl red as the indicator. The % of nitrogen (%N) was calculated as
%N= eqH+⋅ 14.008
𝑤 ⋅ 100, (3)
where eqH+ are the equivalents of H+ consumed by the
distilled basic fraction and𝑤 is the weight (g) of the sample. Protein content was estimated by multiplying the Kjeldahl nitrogen content by 6.25 [18].
2.5.9. Determination of Volatile Compounds. The analysis
of volatile compounds was performed on 10.00 g of sam-ple cut in very thin slices and weighted into a 20.00 mL headspace vial, sealed with polytetrafluoroethylene- (PTFE-) coated silicone rubber septum (20 mm diameter), added with 1.00 mL of the internal standard 4-methyl-2-pentanone aqueous solution at the concentration of 2.00𝜇g mL−1. They were left for 60 min at 25∘C. Headspace was extracted by SPME technique using a CAR/PDMS fibre, 75𝜇m film thickness (Supelco, Bellefonte, PA, USA). Fibres exposition time of 90 min at 25∘C was adopted [19]. The fibre was then introduced into the injector of a gas chromatograph at 220∘C and the sample injected by splitless mode for 8 minutes. The source and transfer line temperatures were set at 250∘C and 230∘C, respectively. After each analysis the fibre was kept for 15 min at 280∘C. The GC system was equipped with a fused-silica capillary column (Rtx-WAX, 30 m× 0.25 mm i.d., film thickness 0.25𝜇m). Helium was used as carrier gas at 1 mL min−1 flow rate. The column temperature was held at 35∘C for 8 min, increased from 35∘C to 60∘C at 4∘C min−1, from 60∘C to 160∘C at 6∘C min−1, and from 160∘C to 200∘C at 20∘C min−1. The mass spectra were obtained by electron impact at 70 eV with the detector operating in scan mode (total ion current) from𝑚/𝑧 35 to 350 a.m.u., with scanning velocity of 2.48 scan s−1. The identification of volatile com-pounds was carried out by comparing GC retention time and MS spectra with those of standard compounds. Nist 98 and Wiley 275 mass spectral libraries were used when standard compounds were unavailable. A series of𝑛-alkanes (C6–C22) was also determined under the same conditions to obtain linear retention index (LRI) values for the aroma components. Quantitative analyses of samples were carried out by using the internal standard procedure and expressed as ng IS equivalents.
2.5.10. Microbiological Analysis. The microbiological
analy-ses were performed on 10.0 g of sample. Lactic acid bac-teria (lactobacillus) counts were determined by the over-lay technique using MRS agar and colonies counted after incubation in anaerobic conditions after 72 h at 30∘C; total count was performed on Tryptone Soya Agar after 72 h at 30∘C; Micrococcaceae were determined on Mannitol Salt Agar after 24 h at 42∘C. All bacteria counts were expressed as colony forming per gram of sample (CFU g−1).
2.6. Statistical Analysis. All statistical treatments, Principal
Component Analysis (PCA), and graphical representations
were carried out by Statistica version 7.1 (StatSoft Inc, USA) and Microsoft Excel (Microsoft Corporation, USA).
3. Results and Discussion
3.1. Physical-Chemical and Nonvolatile Fraction Analyses.
While PDO protocols are already available for other Italian Salami, as Varzi, Brianza, and Piacentino salami [8] and UNI standard values are reported for Felino or Milano [6,15,16], this is not yet the case for the salami here considered. Taking into account that the samples investigated are produced at homemade level, in order to identify parameters suitable for the definition of PDO and PGI, a high number of variables have been evaluated. As reported above, the products con-sidered are characterised by different ripening procedures:
Salamini di Mandrogne are sold without ripening, Muletta
after a six-month ripening period, and Filetto Baciato, Nobile
del Giarolo, and Tipico Tortonese after ripening times that vary
between two and three months. The analyses were performed at regular time intervals (one month) during the ripening period, ranging from the production time to the selling time for all products except for Salamini di Mandrogne, for which the analyses were performed only at the production-commercialisation time. Some considerations and compari-son can be made among the data reported in Tables1and2.
Water percentage (Table 1) varies from about 56% at the production time for Salamini di Mandrogne to about 20% at the end of ripening of Nobile del Giarolo samples. Weight loss during ripening varies from about 29% of MUA samples to about 7% of SAA samples: different variations can be ascribed to the ripening conditions, performed in a traditional cellar for Muletta and Nobile del Giarolo samples and in industrial climatic chambers for the other products. pH values at the production time are all lower than 6.0 and, in agreement with data found for other meat products [8] trend to increase during ripening. Likely due to an intense deaminase oxidative activity, induced in particular by moulds [8], pH values increase during ripening for MUA and GIB and in particular for GIA sample, probably due to the traditional room in which this product is ripened [9].Table 1also shows that the content of fat and proteins is similar, at the end of ripening, for nearly all samples, in agreement with literature data for typical north Italian salami [8,9,13], with the only exception of Filetto Baciato and Salamini di Mandrogne. The lower fat content for Filetto can be explained taking into account that this product is constituted by a central lean fillet of pork surrounded by a salami mixture. The iodine value largely varies within the different samples. The values at the selling time are generally lower than literature data for European salami [20] that, in turn, are lower than values obtained for products from other countries. Saponification number, providing a measure of chain length of fatty acids, ranges from 78 to 179 mg KOH g−1 and is consistent with average values for meat products [11]. Nitrite and nitrate contents (Table 1) must be compared with Italian law threshold con-centration levels, reported in the D.M. 27/02/1996 n. 209, that considers two different levels. One indicates the maximum amount that can be added (150 mg Kg−1 for sodium nitrite and 300 mg Kg−1 for sodium nitrate) while the other gives
T a ble 1: R esul ts o f p h ysical-c hemical an al ysis at th e p ro d u ct io n and se llin g times. Prote ins a % pH Co n d mS H2 O % Sa p o nifica tio n n um b er Mg K O H/g DM Fat % Io dine n um b er gI2 /10 0 g D M As h % Ni tr it e mg N aNO 2 Kg − 1 Ni tr at e mg N aNO 3 Kg − 1 MU A0 25 .4 ± 0.6 5.5 ± 0.2 5.9 ± 0.3 57 .4 ± 0.9 180 ± 2 11.7 ± 0.7 92 ± 35 .0 ± 0.1 61 ± 11 39 ± 3 MU A6 13.6 ± 0.3 6.4 ± 0.2 7. 7 ± 0.4 28.2 ± 0.4 12 8 ± 31 9. 1± 0.8 41 ± 27 .2 ± 0.2 29 ± 12 4 ± 1 MUB0 23 .9 ± 0.6 5.1 ± 0.2 5.8 ± 0.3 52 .5 ± 0.8 14 2 ± 21 5. 2 ± 0.9 9 6 ± 34 .8 ± 0.1 77 ± 12 4 8 ± 5 MUB6 34.6 ± 0.9 5.6 ± 0.2 8.5 ± 0.5 28.3 ± 0.4 14 3 ± 32 1. 5 ± 0.3 35 ± 1 6.8 ± 0.2 11 4 ± 25 7 ± 1 GI A0 29 .9 ± 0.7 5.5 ± 0.2 6.9 ± 0.4 4 0.2 ± 0.6 15 0 ± 2 14.9 ± 0.9 52 ± 2 4.6 ± 0.1 76 ± 14 9 ± 1 GI A4 13.0 ± 0.3 6.7 ± 0.2 8.5 ± 0.5 20.1 ± 0.3 113 ± 32 7 ± 22 5 ± 15 .6 ± 0.1 53 ± 17 2 ± 1 GIB0 28.6 ± 0.7 5.5 ± 0.2 6.7 ± 0.4 43 .1 ± 0.6 14 1± 21 3. 7 ± 0.8 73 ± 3 4.7 ± 0.1 10 6 ± 25 6 ± 1 GIB3 13 2 ± 3 6.2 ± 0.2 7. 4 ± 0.4 26.2 ± 0.4 13 5 ± 32 5 ± 23 0 ± 15 .7 ± 0.1 52 ± 14 7 ± 1 SAA0 22 .6 ± 0.6 5.9 ± 0.2 4.7 ± 0.3 4 4.3 ± 0.7 79 ± 1 10.0 ± 0.6 101 ± 43 .4 ± 0.1 37 ± 11 63 ± 3 SAA2 3.9 ± 0.1 5.3 ± 0.2 7. 7 ± 0.4 29 .9 ± 0.4 15 0 ± 3 18.1 ± 0.8 4 0 ± 24 .9 ± 0.1 110 ± 24 9 ± 1 SAB0 9. 4 ± 0.2 5.3 ± 0.2 6.8 ± 0.4 36.1 ± 0.5 92 ± 22 1. 5 ± 0.8 4 2 ± 24 .2 ± 0.1 76 ± 11 10 ± 2 SAB2 33 .6 ± 0.8 5.8 ± 0.2 8.9 ± 0.5 29 .4 ± 0.4 10 2 ± 21 7. 4 ± 0.9 4 8 ± 2 6.9 ± 0.2 95 ± 24 2 ± 1 FI A0 9. 5 ± 0.2 6.1 ± 0.2 4.7 ± 0.3 49 .0 ± 0.7 14 2 ± 2 6.3 ± 0.4 16 3 ± 63 .6 ± 0.1 4 2 ± 18 7 ± 2 FI A2 25 .4 ± 0.6 5.7 ± 0.2 8.5 ± 0.5 4 0.5 ± 0.6 107 ± 2 8.6 ± 0.5 10 3 ± 4 6.5 ± 0.2 108 ± 23 3 ± 1 FIB0 9. 7 ± 0.2 5.8 ± 0.2 6.9 ± 0.4 51 .9 ± 0.8 13 0 ± 2 6.0 ± 0.4 17 6 ± 63 .6 ± 0.1 4 4 ± 15 2 ± 1 FIB2 17 .1 ± 0.4 6.1 ± 0.2 10.1 ± 0.6 37 .1 ± 0.6 13 6 ± 21 2. 8 ± 0.8 10 3 ± 47 .2 ± 0.2 81 ± 26 2 ± 1 SM A0 18.7 ± 0.5 5.9 ± 0.2 4.1 ± 0.2 52 .1 ± 0.8 14 8 ± 2 4.4 ± 0.3 105 ± 33 .0 ± 0.1 49 ± 1 < LOD SM B 0 27 .9 ± 0.7 5.8 ± 0.2 3.5 ± 0.2 54.5 ± 0.8 15 0 ± 2 11.8 ± 0.7 88 ± 32 .5 ± 0.1 30 ± 1 < LOD SM C0 4.4 ± 0.1 5.6 ± 0.2 3.5 ± 0.2 56.4 ± 0.9 121 ± 19 .4 ± 0.6 13 0 ± 42 .4 ± 0.1 35 ± 1 < LOD SM D 0 7. 3 ± 0.2 5.7 ± 0.2 3.6 ± 0.2 56.8 ± 0.9 126 ± 15 .1 ± 0.3 10 4 ± 32 .6 ± 0.1 39 ± 1 < LOD SM E 0 15 .5 ± 0.4 5.8 ± 0.2 3.5 ± 0.2 53 .8 ± 0.8 126 ± 2 14.9 ± 0.9 81 ± 32 .7 ± 0.1 41 ± 11 9 ± 1 SM F 0 31 .9 ± 0.8 5.7 ± 0.2 4.1 ± 0.2 4 6.2 ± 0.7 13 7 ± 21 5. 6 ± 0.9 6 6 ± 22 .6 ± 0.1 43 ± 17 ± 1 SMG 0 17 .1 ± 0.4 5.6 ± 0.2 3.7 ± 0.2 45.8 ± 0.7 13 8 ± 29 .2 ± 0.6 10 4 ± 42 .4 ± 0.1 36 ± 13 ± 1 SM H0 19 .6 ± 0.5 5.6 ± 0.2 3.5 ± 0.2 52 .4 ± 0.8 14 1± 27 .7 ± 0.5 118 ± 42 .7 ± 0.1 38 ± 1 < LOD SMI0 19 .8 ± 0.5 5.8 ± 0.2 3.7 ± 0.2 56.4 ± 0.9 13 3 ± 1 10.4 ± 0.6 10 4 ± 32 .7 ± 0.1 4 0 ± 1 < LOD a det er m in ed by K je ldahl m etho d .D M = dr y m at te r; L O D N aN O3 =0 .1 0 m g L − 1 .
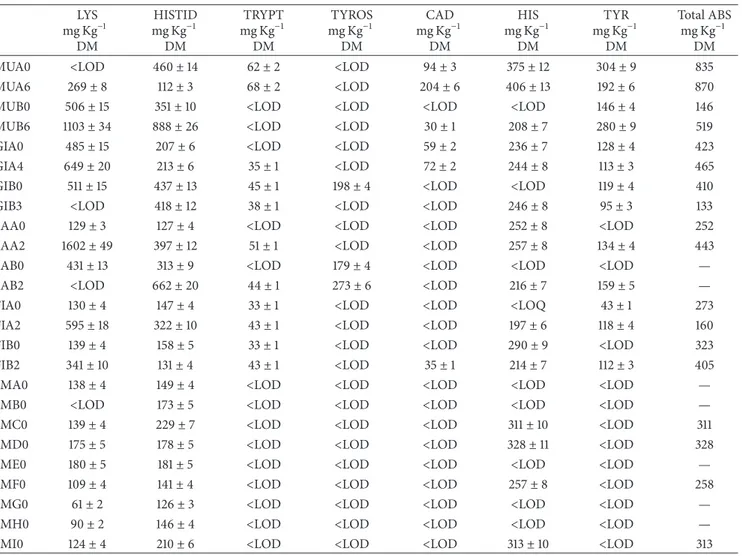
Table 2: Results of biogenic amines and precursor amino acids determination for the production and selling times. LYS mg Kg−1 DM HISTID mg Kg−1 DM TRYPT mg Kg−1 DM TYROS mg Kg−1 DM CAD mg Kg−1 DM HIS mg Kg−1 DM TYR mg Kg−1 DM Total ABS mg Kg−1 DM
MUA0 <LOD 460± 14 62± 2 <LOD 94± 3 375± 12 304± 9 835
MUA6 269± 8 112± 3 68± 2 <LOD 204± 6 406± 13 192± 6 870
MUB0 506± 15 351± 10 <LOD <LOD <LOD <LOD 146± 4 146
MUB6 1103± 34 888± 26 <LOD <LOD 30± 1 208± 7 280± 9 519
GIA0 485± 15 207± 6 <LOD <LOD 59± 2 236± 7 128± 4 423
GIA4 649± 20 213± 6 35± 1 <LOD 72± 2 244± 8 113± 3 465
GIB0 511± 15 437± 13 45± 1 198± 4 <LOD <LOD 119± 4 410
GIB3 <LOD 418± 12 38± 1 <LOD <LOD 246± 8 95± 3 133
SAA0 129± 3 127± 4 <LOD <LOD <LOD 252± 8 <LOD 252
SAA2 1602± 49 397± 12 51± 1 <LOD <LOD 257± 8 134± 4 443
SAB0 431± 13 313± 9 <LOD 179± 4 <LOD <LOD <LOD —
SAB2 <LOD 662± 20 44± 1 273± 6 <LOD 216± 7 159± 5 —
FIA0 130± 4 147± 4 33± 1 <LOD <LOD <LOQ 43± 1 273
FIA2 595± 18 322± 10 43± 1 <LOD <LOD 197± 6 118± 4 160
FIB0 139± 4 158± 5 33± 1 <LOD <LOD 290± 9 <LOD 323
FIB2 341± 10 131± 4 43± 1 <LOD 35± 1 214± 7 112± 3 405
SMA0 138± 4 149± 4 <LOD <LOD <LOD <LOD <LOD —
SMB0 <LOD 173± 5 <LOD <LOD <LOD <LOD <LOD —
SMC0 139± 4 229± 7 <LOD <LOD <LOD 311± 10 <LOD 311
SMD0 175± 5 178± 5 <LOD <LOD <LOD 328± 11 <LOD 328
SME0 180± 5 181± 5 <LOD <LOD <LOD <LOD <LOD —
SMF0 109± 4 141± 4 <LOD <LOD <LOD 257± 8 <LOD 258
SMG0 61± 2 126± 3 <LOD <LOD <LOD <LOD <LOD —
SMH0 90± 2 146± 4 <LOD <LOD <LOD <LOD <LOD —
SMI0 124± 4 210± 6 <LOD <LOD <LOD 313± 10 <LOD 313
DM = dry matter; LOD lysine = 40𝜇g L−1, cadaverine = 52𝜇g L−1, histamine = 104𝜇g L−1, histidine = 159𝜇g L−1, tyramine = 62𝜇g L−1, and tryptamine =
45𝜇g L−1.
the maximum residual content that can be present at the selling time and corresponds to 50 mg Kg−1for sodium nitrite and to 250 mg Kg−1 for sodium nitrate. Regarding nitrite, its amount is always larger than 29 mg Kg−1 and for five samples (namely, MUB6, SAA2, SAB2, FIA2, and FIB2) they are above the law limit at the selling time: this is a quite common situation since nitrite slowly transforms into nitrate during ripening and these products are not supposed to be consumed fresh.Table 2reports the amounts, corrected for moisture, obtained for cadaverine (CAD), histamine (HIS), histidine (HISTID), tyramine (TYR), tryptamine (TRYP), tyrosine (TYROS), and lysine (LYS). Both the total amount of BAs and the HIS/HISTID concentration ratio increase during ripening. At the selling time, tyramine is present in all samples at concentrations ranging from 95 to 280 mg Kg−1. Anyway the total BAs amount is always lower than the level (1000 mg Kg−1) reported as dangerous for human health [21], where 870 mg Kg−1is the maximum amount obtained at the selling time. However, a univocal toxic level is difficult to define since individual sensitivity can be very different and can also be related to the specific biogenic amine considered.
Regarding the content of BAs in fresh products (production time), the samples generally show content unexpectedly high of histamine and tyramine [1,22].
Salamini di Mandrogne do not contain tyramine,
cadav-erine, and tryptamine but the samples SMC, SMD, SMF, and
SMI show concentrations of histamine of about 300 mg Kg−1.
3.2. Microbiological Analyses. The results of microbiological
analyses are presented in Figures 1 and 2, in which lactic acid bacteria and Micrococcaceae are reported as a function of ripening time. The results showed that the raw mixtures (𝑇0)
were characterised by good hygienic conditions and suitable presence of lactic acid bacteria and Micrococcaceae that assists a correct fermentation process.
The microbiological trend is similar for all products. The counts of acid lactic bacteria and Micrococcaceae generally showed a maximum at one month of ripening (𝑇1) for all the samples and then decreased until the end of ripening. The only exception is represented by Muletta that showed the highest counts of lactic acid bacteria and
4.0 5.0 6.0 7.0 8.0 9.0 T0 T2 T4 T5 T6 MUA micrococcacee
MUA lactic MUB micrococcaceeMUB lactic
log c.f.u
. g
−1
Figure 1: Evolution of Micrococcaceae and lactic acid bacteria dur-ing ripendur-ing of Muletta salami (log c.f.u. g−1).
the growth of lactobacilli and Micrococcaceae. Also the amount of volatile compounds showed a similar trend, likely due to the formation of metabolites (e.g., esters, alcohols, and ketones) produced during the fermentation process. Salamini of Mandrogne (fresh sausages) showed a mean value of8 ∗ 106u.f.c. g−1for acid lactic bacteria.
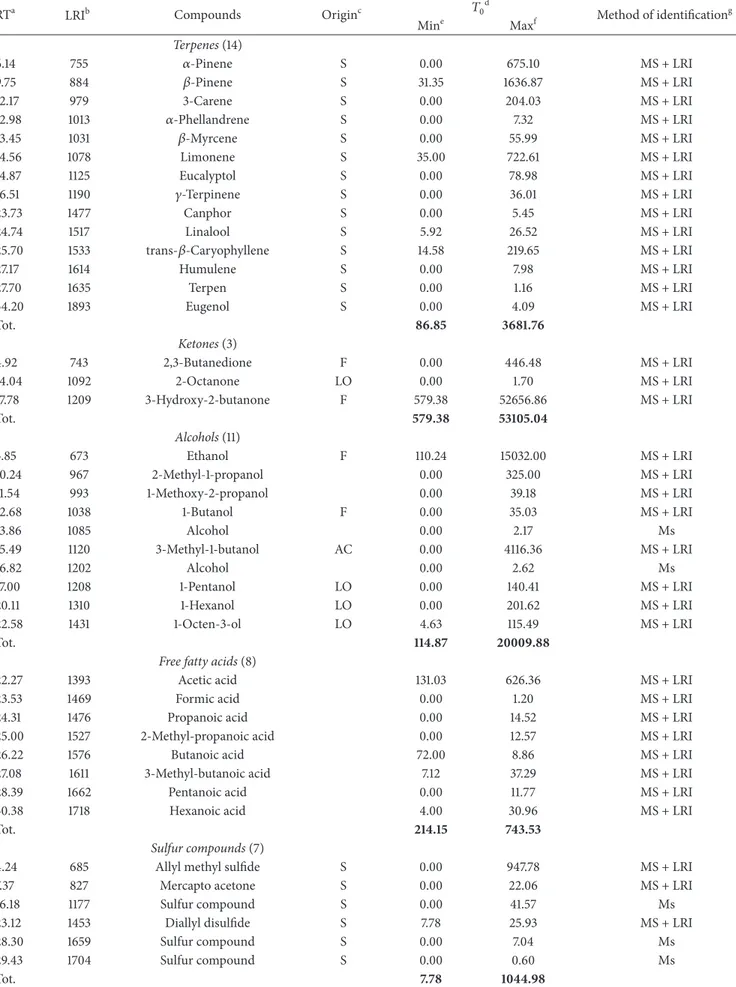
3.3. Volatile Compounds Analysis. About 70 volatile
sub-stances including terpenes, esters, ketones, alcohols, aldehy-des, and sulphur compounds were searched and determined in all samples (Tables3,4,5, and6).
The compounds were identified using both chromato-graphic (Kovats indices) and spectrometric (mass spectra, EI, 70 eV) criteria. Kovats indices were calculated for each chromatographic peak and compared with those stored in a proprietary database including about 250 volatile compounds usually found in food matrices [9,14,23,24]. Determination of the volatile constituents was carried out by spiking the salami, before the extraction, with 4-methyl-2-pentanone (2.0𝜇g mL−1), used as the internal standard since preliminary results indicated its absence in all the samples. The lowest content of volatile species was found in Filetto Baciato: the result is likely due to its composition, constituted by a central lean fillet of pork inside the salami texture. In all products the largest group of volatiles was represented by terpenes, where𝛼-pinene, 𝛽-pinene, sabinene, limonene, and 𝛽-caryophyllene are the most abundant. Terpenes can derive from animal feedstuffs and mainly from the spices as black pepper, nutmeg, and clove added during production. In particular nutmeg contains 𝛼-pinene, 𝛽-pinene, sabinene, and limonene and clove𝛽-caryophyllene [7,25]. The max-imum terpene compounds concentration was observed at the end of the ripening period in Nobile del Giarolo and
Filetto Baciato, while in Muletta it was reached at about 4
months of ripening (𝑇4) [26, 27]. Four sulphur containing
compounds were identified and quantified in Filetto Baciato
and Nobile del Giarolo and six compounds in Muletta, the most abundant being allyl methyl sulphide. Sulphur com-pounds mainly derive from garlic and represent important aroma compounds, since they are characterised by very low sensory thresholds [28]. The amounts of sulphur containing species increased during the ripening, except for Muletta that showed a decreasing trend after the 𝑇4 of ripening. Many ketones and alcohols were found to be present. The most abundant ketones were 2-butanone, 3-hydroxy-2-butanone (acetoin), and 2-propanone; their concentrations increased reaching a maximum at the end of ripening except in Muletta where the amount increases until𝑇5and then decreases.
The most abundant alcohols isolated were ethanol, 2-butanol, 3-methyl-1-2-butanol, 1-propanol, and 1-octen-3-ol, which in particular is produced during lipid oxidation and is recognised for a characteristic mushroom note and a very low sensory threshold [4].
High amounts of ethanol were found in all products, likely arising from the wine added during preparation. Also 3-methyl-1-butanol was found in all the products, likely formed through the reduction reaction of the corresponding aldehyde [3,19,29].
Several ethyl esters were isolated in particular in Muletta. Since esters can be formed in a complex chain of reactions such as alcohol-aldehyde-acid-ester, ethyl esters are usually present in fermented meat products and contribute to the fruity note of the flavour [6,20,30, 31]. The long ripening time undergone by Muletta likely favoured therefore their formation. Aldehydes were identified and quantified in Filetto
Baciato, Muletta, and Nobile del Giarolo. The total aldehyde
content increased during ripening, especially in Filetto
Baci-ato and Nobile del Giarolo, while showing a maximum at𝑇4
for Muletta. Many aldehydes are products of lipid oxidation. In particular hexanal, which is produced during the oxidation of n-6 unsaturated fatty acids, imparts a green odour and is considered a good indicator of oxidation [30]. The low amount of hexanal found in all the salami could likely be attributed to the antioxidative activity of terpenes of spices found at higher concentration levels in all the products. All the products contain benzenacetaldehyde that is considered one of the substances giving a specific flavour note to pork meat and can form from phenylalanine. Among free fatty acids the most abundant compounds identified in all the salami were acetic acid, butanoic acid, 2-methyl propanoic acid, and 3-methyl butanoic acid. The total amount of fatty acids increased during the ripening in Nobile del Giarolo and
Filetto Baciato, while reaching a maximum at𝑇4in Muletta. As regards such salami therefore we can conclude that a decrease of several volatile compounds occurred in the last ripening period, probably due to the natural loss from the matrix surface.
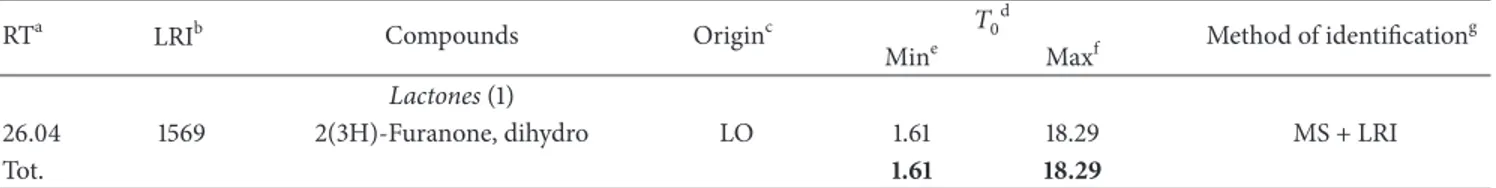
44 volatile compounds were identified and quantified in
Salamini di Mandrogne. As mentioned before, a different
behaviour characterizes Salamini di Mandrogne, which are sold just after production. The most abundant compounds were ketones, alcohols, terpenes, sulphur compounds, free fatty acids, and lactones. High concentrations of volatile species formed in carbohydrate fermentation were found,
T a ble 3: V o la tile co m p o unds det ec ted in “M ulet ta ” sala m i d ur in g ri p enin g (n g g − 1 ). RT a LRI b Co m p o u n d s O ri gi n c 𝑇0 d 𝑇2 𝑇4 𝑇5 𝑇6 M et h o d o f iden tifica tio n g Mi n e Ma x f Mi n M ax Mi n M ax Mi n M ax Mi n M ax Te rp en es (19) 5.5 5 75 5 𝛼 -P inene S 111.0 3 50 7. 39 34 5.67 11 43 .0 6 38.4 0 61 4 5.0 3 14 0.6 4 267 .7 1 31.9 9 30 9. 08 MS + L RI 5.8 4 76 6 𝛼 -Th u jene S 0.0 0 221.22 0.0 0 4 6.9 2 0.0 0 0.0 0 0.0 0 0.0 0 0.0 0 4.4 8 M S + LRI 8.8 1 88 4 𝛽 -P inene S 26 3.6 5 71 0.08 4 53 .3 0 18 55 .7 0 30.6 0 115 30.05 28 1.01 36 5.6 4 4 8.4 6 53 6.6 8 M S + LRI 9. 79 92 3 Sa b inene S 0.0 0 74 4.6 5 0.0 0 4 19 .57 0.0 0 0.0 0 0.0 0 94.5 5 194.5 6 17 7.45 M S + LRI 11.20 979 3-C ar ene S 205.3 0 867 .22 33 1.3 5 205 1.7 5 195.87 18 52 4.57 4 54.80 83 7.22 34.5 1 37 4.29 M S + LRI 12.05 1013 𝛼 -p hel la n dr ene S 4.18 26.4 8 0.0 0 0.0 0 0.0 0 0.0 0 0.0 0. 0.0 0 51.5 4 34 5.8 9 MS + L RI 12.11 1015 T er p en S 0.0 0 0.0 0 0.0 0 0.0 0 0.0 0 0.0 0 0.0 0 0.0 0 0.0 0 0.0 0 m s 12.5 1 10 31 𝛽 -M ir cene S 3.6 2 41.4 2 8.3 6 35.8 5 9. 4 2 55 0.2 8 24.5 5 31.8 5 29 .4 0 257 .4 9 M S + LRI 12.7 9 10 4 2 𝛼 -T er p inene S 0.0 0 16.9 3 0.0 0 0.0 0 0.0 0 0.0 0 0.0 0 0.0 0 0.0 0 0.0 0 M S + LRI 13.6 9 107 8 L imo n ene S 53 .4 4 305.8 1 9 0.11 36 6.58 6 0.4 6 37 69 .7 6 75 .8 9 16 3.0 2 13 1.8 5 13 21.3 8 MS + L RI 14.87 112 5 𝛽 -Phel la n dr ene S 0.0 0 79 .6 5 0.0 0 4 2.94 83 1.08 6 69 .13 0.0 0 0.0 0 0.0 0 0.0 0 M S + LRI 15.1 7 113 7 T er p en S 0.0 0 0.0 0 0.0 0 8.15 0.0 0 0.0 0 0.0 0 0.0 0 0.0 0 0.0 0 m s 16.5 1 11 9 0 𝛾-T er p inene S 0.0 0 26.58 0.0 0 0.0 0 0.0 0 0.0 0 0.0 0 0.0 0 1.9 9 0.0 6 M S + LRI 16.6 1 11 94 C ymene S 0.0 0 4 6.7 1 0.0 0 12.2 8 33 8.5 5 24 3.8 2 0.0 0 4 1.0 6 14 .0 2 0 .2 5 M S + LRI 22.8 2 14 4 1 T er p en S 0.0 0 6.12 0.0 0 0.0 0 0.0 0 0.0 0 0.0 0 0.0 0 2.4 8 0 .21 m s 24.6 6 15 14 T er p en S 0.0 0 1.6 9 0.0 0 2.4 0.0 0 0.0 0 0.0 0 0.0 0 0.0 0 0.0 0 m s 25 .2 4 15 37 T er p en S 6.08 6.6 8 0.0 0 0.0 0 0.0 0 0.0 0 0.0 0 0.0 0 0.0 0 0 .0 0 m s 25 .1 3 15 33 tr an s-𝛽 -C ar yo p h yl lene S 24.0 2 129 .9 6 22.12 30 7. 58 13.94 1413.1 9 53 .3 2 27 8.67 41.6 2 15 0 7. 61 MS + L RI 27 .18 16 14 H um u lene S 0.0 0 0.58 0.0 0 0.0 0 0.0 0 0.0 0 0.0 0 0.0 0 0.0 0 1.08 M S + LRI To t. 27 6.0 6 14 08.2 8 12 50.91 62 90 .3 8 151 8.3 2 42 84 5.8 3 10 30.21 20 79 .7 2 58 2.42 48 35.9 5 A lde hy des (6) 1.7 7 6 0 4 A cet aldeh yde 0.0 0 69 .07 0.0 0 84.10 0.0 0 80 6.2 3 0.0 0 0.0 0 0.0 0 0.0 0 M S + LRI 8.18 85 9 H exa nal L O 33.0 0 50.3 0 0.0 0 157 .22 0.0 0 20.3 1 0.0 0 49 .16 0.0 0 0.0 0 M S + LRI 18.6 9 12 77 2-H ep te nal 0.0 0 1.4 8 0.0 0 0.0 0 0.0 0 1.7 7 0.0 0 0.0 0 0.0 0 0 .0 0 M S + LRI 20.5 0 13 49 N o n an al L O 0.0 0 0 .0 0 0.0 0 0.0 0 0.0 0 0 0.0 0 0.0 0 1.79 4 4.88 MS + L RI 23 .95 14 86 B enzaldeh yd e A C 0.0 0 5.7 6 0.0 0 8.95 10 4 4.1 9 0.0 0 0.0 0 12 3.4 4 0.0 0 17 .4 2 MS + L RI 25 .86 15 62 B enzenacet aldeh yde A C 0.0 0 9.29 0.0 0 8.41 78 5.0 2 0.0 0 5.5 6 4 23 .7 1 10 4.0 0 145.16 M S + LRI To t. 33 .0 0 13 5.9 0 0.0 0 25 8.6 8 18 29.21 82 8.3 1 5.5 6 596.3 1 105.7 9 207 .4 6
Ta b le 3: C o n ti n u ed . RT a LRI b Co m p o u n d s O ri gi n c 𝑇0 d 𝑇2 𝑇4 𝑇5 𝑇6 M et h o d o f iden tifica tio n g Mi n e Ma x f Mi n M ax Mi n M ax Mi n M ax Mi n M ax Ke to n es (12) 2.12 61 8 2-P ro p ano ne MI 0.0 0 4 0 6.9 3 33.6 2 91 .6 9 0.0 0 505.8 4 0.0 0 51.3 4 0.0 0 11.97 MS + L RI 2.9 1 65 0 2-B u ta n o n e F 0.0 0 16 23.4 2 0.0 0 0.0 0 0.0 0 0.0 0 0.0 0 35 21.4 2 0.0 0 16 6 .12 M S + LRI 5.2 5 74 3 2,3-B u ta n edio ne F 0.0 0 14 2.3 3 0.0 0 0.0 0 0.0 0 0.0 0 0.0 0 0.0 0 0.0 0 0.0 0 M S + LRI 13.97 108 9 2-H exa no ne MI 0.0 0 0.0 0 0.0 0 5.12 0.0 0 0.0 0 0.0 0 0.0 0 0.0 0 0.0 0 M S + LRI 14.01 10 91 2-H ep ta no ne L O 0.0 0 3.6 8 0.0 0 0.0 0 0.0 0 0.0 0 0.0 0 21.1 9 0.0 0 4.41 MS + L RI 16.2 7 118 1 3-O ct an o n e M I 0.0 0 0.0 0 0.0 0 0.0 0 0.0 0 0.0 0 0.0 0 0.0 0 0.0 0 0.5 9 M S + LRI 16.97 1208 K et o n M I 0.0 0 0.0 0 0.0 0 0.0 0 0.0 0 0.0 0 0.0 0 0.0 0 0.0 0 2.67 M s 16.5 3 11 91 K et o n MI 0.0 0 0.0 0 0.0 0 0.0 0 0.0 0 0.0 0 0.0 0 0.0 0 0.0 0 0.6 0 M s 16.98 120 9 3-H ydr o x y-2-b u ta no ne F 59 .3 7 19 6 6.7 8 82 7.3 3 11 72.7 0 6.8 5 20 38.9 2 7.29 22 3.4 2 0.0 0 15.5 1 MS + L RI 18.9 1 12 86 6 -M et h yl-5-hep ten-2-o ne MI 0.0 0 0.0 0 0.0 0 0.0 0 0.0 0 0.0 0 0.0 0 0.0 0 0.0 0 0.2 5 M S + LRI 20.9 2 13 65 2-N o n an o n e L O 0.0 0 0.0 0 0.0 0 0.0 0 0.0 0 0.0 0 0.0 0 6.18 0.0 0 0.0 0 M S + LRI 24.5 15 08 4-H ydr o x y-2-b u ta no ne MI 0.0 0 4 .26 0.0 0 0.0 0 0.0 0 0.0 0 0.0 0 0.0 0 0.0 0 0.0 0 M s To t. 59.3 7 423 9.47 86 0.9 5 11 87 .51 6.8 5 25 44.7 6 7.29 38 04.5 5 0.0 0 20 2.1 2 Al co h ol s (22) 3.4 9 67 3 E th an o l F 75 22.2 5 63 70.7 7 11 97 3.6 3 47 0 4 6.29 6 4 8.8 1 1018 37 .4 4 22 41.97 34 20.26 320.2 3 11 4 67 .6 1 M S + LRI 5.97 77 1 2-B u ta n o l F 0.0 0 2987 .5 5 24 8.58 27 29 .3 1 0.0 0 23 4 4 0 4.2 4 0.0 0 35 94.7 7 0.0 0 72.9 6 MS + L RI 7. 22 82 1 1-P ro p ano l L O 0.0 0 205.7 3 211.15 4 4 1.08 0.0 0 0.0 0 0.0 0 0.0 0 0.0 0 0.0 0 M S + LRI 10.9 9 6 7 2-M et h yl-1 -p ro p an o l A C 107 .10 4 4 2.94 56.05 89 7. 74 19 .4 6 26 16.3 4 53.7 4 72 .3 7 0.0 0 97 .3 5 MS + L RI 11.6 5 9 97 2-P en ta no l 0.0 0 34.6 3 22.1 7 205.8 4 0.0 0 19 .9 2 0.0 0 33.6 0 0.0 0 17 6 .6 1 M S + LRI 12.6 9 10 38 1-B u ta n o l 0.0 0 20.6 5 0.0 0 13.5 3 0.0 0 65 4.8 5 0.0 0 4 0.6 2 0.0 0 0.0 0 M S + LRI 14.7 5 1120 3-M et h yl-1 -b u ta no l A C 59 9.7 1 3086.67 38 4.9 1 4 016.5 0 59 .3 5 20 24 1.6 8 211.95 32 8.12 28.1 7 14 6 8.7 5 MS + L RI 16.87 120 4 3-M et h yl-3-b u te n-1 -o l 0.0 0 6.0 4 6.7 5 4 0.2 5 0.0 0 3.94 0.0 0 0.0 0 0.0 0 0.5 2 M S + LRI 16.9 6 1208 1-P en ta no l 0.0 0 33.8 4 15.22 180.0 2 0.0 0 0.0 0 0.0 0 0.0 0 0.0 0 1.1 9 M S + LRI 18.5 3 12 70 3-M et h yl-2-b u te n-1 -o l 0.0 0 5.9 6 0.0 0 7.1 4 0.0 0 0.0 0 0.0 0 0.0 0 0.0 0 0.4 8 M S + LRI 19 .2 4 129 9 2-H ep ta no l 0.0 0 1.4 8 0.0 0 0.0 0 0.0 0 0.0 0 0.0 0 0.0 0 0.0 0 0.9 2 M S + LRI 19 .5 3 13 10 1-H exa n o l 0.0 0 77 .8 4 0.0 0 4 0 6.9 2 3.13 4 49 .8 5 0.0 0 2.29 2.88 6 0.97 MS + L RI 20.3 1 13 4 1 A lco h o l 0.0 0 0.0 0 0.0 0 212.0 0 0.0 0 0.0 0 0.0 0 0.0 0 0.0 0 0 .0 0 M s 22.0 4 1410 1-O ct en-3-o l L O 0.0 0 2.0 6 0.0 0 0.0 0 0.0 0 0.0 0 0.0 0 0.0 0 0.0 0 43.6 9 MS + L RI 23 .12 145 3 A lco h o l 0.0 0 0.0 0 0.0 0 0.0 0 0.0 0 0.0 0 0.0 0 0.0 0 0.0 0 0.0 0 M s 24.7 4 15 17 A lco h o l 0.0 0 6.3 6 0.0 0 1.3 1 0.0 0 16 8.8 4 0.0 0 3.7 5 0.0 0 4 .10 M s 30.6 1 17 51 A lco h o l 0.0 0 0.0 0 0.0 0 0.7 0 0.0 0 0.0 0 0.0 0 0.0 0 0.0 0 0.0 0 M s 31 .05 17 6 8 B enzenet ha no l M I 0.0 0 19 .6 3 24.6 2 4 5.6 4 0.0 0 0.4 6 0.0 0 6 4.4 0 0.0 0 26.7 4 MS + L RI To t. 82 29.0 6 13 30 2.15 1294 3.08 56 24 4.27 73 0.7 5 36 03 97 .5 6 25 07 .6 6 75 60.1 8 35 1.2 8 13 421.8 9
Ta b le 3: C o n ti n u ed . RT a LRI b Co m p o u n d s O ri gi n c 𝑇0 d 𝑇2 𝑇4 𝑇5 𝑇6 M et h o d o f iden tifica tio n g Mi n e Ma x f Mi n M ax Mi n M ax Mi n M ax Mi n M ax F re e fa tty ac ids (9) 21.6 1 13 93 A cet ic acid 25 50.58 29 28.98 27 88.5 0 24 33 3.05 56 2.2 8 52 23 6.16 95 2.94 20 49 .15 10 0.5 5 9 03 9. 94 MS + L RI 23 .5 2 14 69 F o rmic acid 0.0 0 2.10 0.0 0 0.0 0 0.0 0 0.0 0 0.0 0 0.0 0 0.0 0 0 .0 0 M S + LRI 23 .7 1 147 6 P ro p ano ic acid 0.0 0 13 3.16 14 3.0 9 14 86.9 2 38.26 295 4.7 1 54.4 0 141.12 5.9 9 716.58 M S + LRI 24.9 9 15 27 2-M et h yl-p ro p an o ic acid 0.0 0 19 .3 4 30.7 3 47 5.1 7 7.0 6 81 7.86 11.22 21.07 0.0 0 21.6 3 MS + L RI 26.22 157 6 B u ta n o ic acid 74.7 5 122.94 6 8.0 0 77 4.7 6 37 .87 23 6 0.26 27 .97 79 .15 1.8 1 23 2.9 9 M S + LRI 27 .0 9 16 11 3-M et h yl b u ta n o ic acid 36.16 4 0 0.9 3 51.9 1 89 3.1 7 19 .4 0 1413.97 15.8 2 32.2 7 1.5 9 57 .79 M S + LRI 27 .3 8 16 22 2-M et h yl-2-p ro p eno ic acid 0.0 0 0.0 0 0.0 0 0.0 0 0.0 0 157 .7 4 0.0 0 0.0 0 0.0 0 0 .0 0 M S + LRI 28.3 8 16 62 P en ta no ic acid 0.0 0 2.67 2.6 5 11.2 7 1.98 75 .10 0.9 6 2.58 0.0 0 47 .6 5 MS + L RI 29 .80 17 18 H exa n o ic acid 0.0 0 2.1 9 4.9 6 32.2 8 12.01 16 2.80 2.95 10.01 0.6 9 9.6 3 M S + LRI To t. 26 61 .4 9 36 12.3 1 30 89 .8 4 28 007 .15 67 8.8 6 60 17 8.6 0 10 66.26 23 35 .3 5 11 0.6 3 10 126.21 Hy d ro ca rb on s (3) 1.5 1 50 0 P en ta ne L O 0.0 0 28 0.4 0 75.8 1 23 6 8.7 0 85.9 2 55 3.22 80.6 5 295.7 0 2.4 0 16 1.0 9 M S + LRI 6.08 77 6 T o lu ene M I 0.0 0 0.0 0 0.0 0 57 .6 6 0.0 0 0.0 0 0.0 0 0.0 0 77 .6 0 14 87 .15 M S + LRI 23 .4 2 14 65 H yd ro ca rb o n MI 0.0 0 2.3 0 0.0 0 0.0 0 0.0 0 0.0 0 0.0 0 0.0 0 0.0 0 0.0 0 M s To t. 0.0 0 28 2.7 0 75 .8 1 2426.3 6 85 .9 2 55 3.22 80.6 5 29 5.7 0 80 .0 0 16 48.24 Es te rs (9) 3.08 65 6 A cet ic acid et h yl est er M E 126 1.4 0 73 71 .9 3 926.4 4 9 0 92.9 2 586.21 16 4 20.94 56 6.7 8 18 36.0 3 0.0 0 6 75 5.6 2 MS + L RI 7. 56 83 4 B u ta n o ic acid et h yl est er M E 3.5 9 32.67 0.0 0 0.0 0 0.0 0 0.0 0 0.0 0 0.0 0 0.0 0 0.0 0 M S + LRI 19 .7 13 17 P ro p an o ic acid et h yl est er M E 0.0 0 76.4 0 0.0 0 167 .2 5 0.0 0 15.5 2 0.0 0 0 0.0 0 0.0 0 M S + LRI 20.0 4 13 30 2-H yd ro x y p ro p an o ic acid et h yl est er M E 0 .0 0 38.26 53.3 0 16 4.1 4 0.0 0 49 2.7 6 3.80 17 .86 0.0 0 28.0 4 Ms 30.3 9 17 4 2 H exa n o ic acid et h yl est er M E 0.0 0 3.6 8 0.0 0 0.0 0 0.0 0 0.0 0 0.0 0 0 0.0 0 0.0 0 M S + LRI To t. 13 45 .07 75 22.94 97 9.7 4 9424.3 1 58 6.21 16 929.22 57 0.5 8 18 53.8 9 0.0 0 67 83 .6 6
Ta b le 3: C o n ti n u ed . RT a LRI b Co m p o u n d s O ri gi n c 𝑇0 d 𝑇2 𝑇4 𝑇5 𝑇6 M et h o d o f iden tifica tio n g Mi n e Ma x f Mi n M ax Mi n M ax Mi n M ax Mi n M ax Su lf ur co mp oun d s (6) 2.86 6 4 8 Su lf u r o xide S 0.0 0 0.0 0 0.0 0 0.0 0 0.0 0 0.0 0 0.0 0 0.0 0 0 8.7 6 M S + LRI 3.80 6 85 A ll yl met h yl su lfide S 4 82 .6 6 6 49 9. 78 29 6.7 4 17 6 4.1 4 115.6 4 115 93 .2 5 83 5.3 5 83 6.3 8 13 3.5 1 24 0 4.3 9 M S + LRI 23 .12 145 3 Su lf u r co m p o und S 0.0 0 2.11 0.0 0 0.0 0 0.0 0 2.5 9 0.0 0 0.0 0 0.0 0 0 .0 0 M s 27 .98 16 4 6 Su lf ur co m p o u nd S 0.5 6 5.7 5 2.12 10.12 0.0 0 0.0 0 0.0 0 1.1 9 2.9 2 6 4.3 2 M s 28.3 16 59 Dial ly ls u lf o ne S 0.0 0 13.5 2 0.0 0 18.18 0.0 0 74 4.6 8 0.0 0 7.0 2 0.0 0 0 .0 0 M S + LRI 4 0.7 6 215 4 D eca n et hio l S 0.0 0 11.18 0.0 0 0.0 0 0.0 0 0.0 0 0.0 0 0.0 0 0.0 0 0.0 0 M S + LRI To t. 48 3.22 65 32 .3 4 298.8 6 17 92.4 4 115.6 4 12 34 0.5 2 84 2.3 7 84 4.59 13 6.4 3 247 7.47 Ms La ct on es (2) 26.0 4 15 69 2(3H)-F ura n o n e, di h ydr o L O 7.12 10.9 2 9.6 8 4 8.6 2 2.4 9 13 9.58 2.7 3 4.79 0.4 6 55.1 4 MS + L RI 27 .57 16 30 L ac to ne MI 0.0 0 1.6 5 0.0 0 0.0 0 0.0 0 32.9 1 0.0 0 0.0 0 0.0 0 0.0 0 M s To t. 8.7 7 12.57 9.6 8 48.6 2 2.4 9 17 2.4 9 2.7 3 4.7 9 0.4 6 55.1 4 aRet en tio n time o f vo la tile co m p o unds. bK o va ts in dex calcula te d fo r R T X-W A X ca p illa ry co lumn (C as te llo ,1 999) [ 14 ]. cOr igin: F (ca rb o h ydra te fe rm en ta tio n); A C (a mino acid ca ta b o lism); L O (li p id o xida tio n); ME (micr o b ia lest er ifica tio n); S (sp ices an d co n dime n ts); M I (mis cella neo u s: co n ta m ina n ts, u nkno wn). d Ri p enin g time acco rd in g to exp er imen ta lp la n. e M inim u m extrac ted q u an ti ties (n g 4 -met h yl-2-p en ta n o n e eq ui va len ts g sa la mi − 1). V al u e 0 m ea n s tha t trace am o u n ts w er e d et ec te d (< 0.1 n g g − 1). fM axim u m extrac ted q u an ti ties (n g 4 -met h yl-2-p en ta n o n e eq u iv al en ts g sa la m i − 1). V al u e 0 m ea n s tha t trace am o u n ts w er e det ec ted (< 0.1 n g g − 1). gMS + L RI, m ass sp ec tr um, an d L RI agr ee w it h thos e o f au th en tic co m p o unds; m s + lr i, mass sp ec tr um, an d L RI in agr eemen t w it h the li te ra tu re ;m ass sp ec tr u ma gr ee sw it hs p ec tr u mi nt h e NIS T lib ra ry M ass Sp ec tral D at abas e.
T a ble 4 :S u p p lemen ta ry ma te ri al V .V o la ti le co m p o u nds d et ec te d in “Fi let to B acia to ” sa la mi d u ri n g ri p enin g (n g g − 1 ). RT a LRI b Co m p o u n d s O ri gi n c 𝑇0 d 𝑇1 𝑇2 M et h o d o f iden tifica tio n g Mi n e Ma x f Mi n M ax Mi n M ax Te rp en es (1 7) 5.5 5 75 5 𝛼 -P inene S 20.6 5 25.6 9 36.6 3 79 1.6 5 0.0 0 95.20 MS + L RI 8.8 1 88 4 𝛽 -P inene S 25 .9 9 72.45 0.0 0 50.4 8 13 8.0 3 13 84.0 0 MS + L RI 9. 79 92 3 Sa b inene S 0.0 0 51.0 2 7. 84 73 5.94 19 .9 2 13 16.2 4 M S + LRI 11.20 979 3-C ar ene S 0.0 0 98.4 3 29 2.3 2 22 4 6.3 5 77 1.7 3 397 8.16 M S + LRI 12.05 1013 𝛼 -Phel la n dr ene S 0.0 0 1.8 9 20.21 17 7.4 6 54.41 31 6.97 MS + L RI 12.5 1 10 31 𝛽 -M ir cene S 0.0 0 3.7 5 14.98 14 6.0 2 39 .2 3 25 8.11 MS + L RI 13.6 9 107 8 L imo n ene S 20.10 22.2 8 108.4 4 11 78.9 2 28 2.3 1 208 2.5 9 MS + L RI 16.5 1 11 9 0 𝛾-T er p inene S 0.0 0 0.0 0 0.0 0 39 .94 0.0 0 70.4 6 MS + L RI 16.7 4 11 9 9 C ymene S 0.0 0 0.0 0 11.6 8 18 2.2 4 30.7 3 318.3 2 M S + LRI 20.8 4 13 62 F enc h o n e S 0.0 0 2.26 0.0 0 2.29 0.0 0 5.1 9 M S + LRI 22.26 141 9 C o p aene S 0.0 0 0.0 0 0.67 5.7 2 1.5 0 9. 9 9 MS + L RI 22.4 6 14 27 T er p en S 0.0 0 0.0 0 0.0 0 15.7 3 0.0 0 27 .4 8 m s 22.98 14 47 T er p en S 0.0 0 0.0 0 0.0 0 17 .0 2 0.0 0 29 .3 2 m s 23 .3 1 14 6 0 C an p h o r S 0.0 0 0.0 0 0.0 0 32.7 8 0.0 0 56.4 9 M S + LRI 24.3 7 15 03 T er p en S 1.20 13.01 1.9 9 4 23 .5 5 4.80 73 3.9 2 m s 25 .1 3 15 33 tr an s-𝛽 -C ar yo p h yl lene S 0.0 0 10.3 7 49 .7 1 82 6.57 118.47 13 91.6 2 MS + L RI 26.7 5 15 97 H um u lene S 0.0 0 0.0 0 1.2 8 11.08 3.0 0 19 .8 2 M S + LRI To t. 67 .94 30 1.15 54 5.7 5 68 83.7 4 14 64.13 12 09 3.8 8 A lde hy des (2) 20.5 0 13 49 N o n an al L O 0.0 0 0.0 0 4.5 6 26.2 4 10.8 4 4 5.6 4 MS + L RI 25 .86 15 62 B enzenacet al deh yde A C 0.0 0 0.0 0 13.29 6 8.57 32.6 0 12 2.7 1 MS + L RI To t. 0.0 0 0.0 0 5.9 0 94.8 1 43.4 4 16 8.3 5 Ke to n es (4) 2.12 61 8 2-P ro p ano ne MI 0.0 0 0.0 0 97 .3 9 49 3.3 4 25 6.3 4 83 5.7 7 M S + LRI 2.9 1 65 0 2-B u ta n o n e F 0.0 0 0.0 0 10 6.3 1 13 87 .9 3 267 .3 5 24 84 .8 2 M S + LRI 16.98 120 9 3-H ydr o x y-2-b u ta no ne F 0.0 0 19 .5 3 0.0 0 13 65.8 2 0.0 0 2418.4 3 MS + L RI 20.9 2 13 65 2-N o n an o n e L O 0.0 0 0.0 0 0.0 0 10.2 4 0.0 0 17 .8 5 MS + L RI To t. 0.0 0 0.0 0 20 3.7 0 32 57 .3 3 52 3.6 9 57 56 .8 7
Ta b le 4 :C o n ti n u ed . RT a LRI b Co m p o u n d s O ri gi n c 𝑇0 d 𝑇1 𝑇2 M et h o d o f iden tifica tio n g Mi n e Ma x f Mi n M ax Mi n M ax Al co h ol s (15) 3.4 9 67 3 E th an o l F 0.0 0 10 4 8.4 0 122.7 1 6118.7 0 30 6.4 9 108 49 .9 1 M S + LRI 5.97 77 1 2-B u ta n o l F 0.0 0 0.0 0 25.67 45 9. 59 74.57 83 1.5 3 M S + LRI 10.9 9 6 7 2-M et h yl-1 -p ro p an o l A C 0.0 0 28.7 4 0.0 0 0.0 0 0.0 0 0.0 0 M S + LRI 13.4 0 10 6 7 A lco h o l MI 0.0 0 10.47 0.0 0 110 0.8 3 0.0 0 17 52.47 m s 14.5 5 1112 A lco h o l MI 0.0 0 3.2 7 0.0 0 0.0 0 0.0 0 0 .0 0 m s 14.7 5 1120 3-M et h yl-1 -b u ta no l A C 0.0 0 12 3.6 9 14.11 15 4.4 3 38.10 27 1.58 M S + LRI 16.87 120 4 3-M et h yl-3-b u te n-1 -o l A C 0.0 0 0.0 0 0.0 0 29 .6 0 0.0 0 51.6 9 MS + L RI 16.3 6 118 4 1-P en ta no l L O 0.0 0 0.0 0 1.0 3 17 .05 2.80 30 .05 M S + LRI 18.6 8 12 76 3-M et h yl-2-b u te n-1 -o l A C 0.0 0 0.0 0 0.4 4 54.8 4 1.11 9 6.3 0 M S + LRI 18.8 5 12 83 A lco h o l MI 0.0 0 0.0 0 0.0 0 17 .4 0 0.0 0 30.5 0 m s 19 .5 3 13 10 1-H exa n o l L O 0.0 0 0.0 0 2.6 2 15.7 1 6.5 9 27 .3 9 MS + L RI 22.0 4 1410 1-O ct en-3-o l L O 0.0 0 0.0 0 1.8 5 10.2 7 4 .7 5 17 .81 MS + L RI 23 .0 9 145 2 2-E th yl -1 -hexa n o l MI 0.0 0 0.0 0 0.0 0 39 .98 0.0 0 6 8.5 4 M S + LRI 23 .9 9 14 87 A lco h o l ME 0.0 0 0.0 0 0.0 0 80.67 0.0 0 14 4.95 M S + LRI 31 .05 17 6 8 B enzenet ha no l M I 0.0 0 0.0 0 0.0 0 10.5 4 0.0 0 18.4 8 M S + LRI To t. 0.0 0 12 14 .57 16 8.4 3 81 09.6 1 43 4.41 141 91.2 0 F re e fa tty ac ids (7) 21.6 1 13 93 A cet ic acid 88.1 9 14 4.3 1 30.18 201 7. 36 67 .9 3 35 33.3 1 MS + L RI 23 .7 1 147 6 P ro p ano ic acid 0.0 0 1.9 0 0.0 0 31.7 1 0.0 0 55.3 8 MS + L RI 24.9 9 15 27 2-M et h yl-p ro p an o ic acid 0.0 0 1.0 4 0.0 0 4 6.8 4 0.0 0 82.87 MS + L RI 26.22 157 6 B u ta n o ic acid 5.5 1 24.7 7 0.0 0 16 2.4 3 0.0 0 28 3.7 1 M S + LRI 27 .0 9 16 11 3-M et h yl b u ta n o ic acid 1.4 0 1.6 8 0.0 0 81.9 9 0.0 0 14 4 .5 5 M S + LRI 28.3 4 16 6 0 P en ta no ic acid 0.0 0 0.5 1 0.0 0 0.0 0 0.0 0 0.0 0 M S + LRI 29 .80 17 18 H exa n o ic acid 0.7 1 2.86 0.0 0 16.9 9 0.0 0 30.2 8 MS + L RI To t. 95 .8 1 17 7.07 30.1 8 23 57 .3 2 67 .9 3 413 0.1 0
Ta b le 4 :C o n ti n u ed . RT a LRI b Co m p o u n d s O ri gi n c 𝑇0 d 𝑇1 𝑇2 M et h o d o f iden tifica tio n g Mi n e Ma x f Mi n M ax Mi n M ax Es te rs (1) 3.08 65 6 A cet ic acid et h yl est er M E 75.9 6 13 8.5 3 0.0 0 0.0 0 0.0 0 0.0 0 M S + LRI To t. 75 .96 13 8.5 3 0.0 0 0.0 0 0.0 0 0.0 0 Su lf ur co mp oun d s (4) 3.80 6 85 A ll yl met h yl su lfide S 0.0 0 80.7 7 24.3 4 15 54.58 72.0 0 27 4 2.01 M S + LRI 17 .0 4 1211 D it hio p en ta n e S 0.0 0 0.0 0 5.05 62 .3 1 13.0 3 107 .3 3 MS + L RI 22.5 9 14 32 Su lf u r co m p o und S 0.0 0 0.0 0 0.0 0 61.8 1 0.0 0 10 6.95 m s 28.3 16 59 Dial ly ls u lf o ne S 0.0 0 0.7 2 0.0 0 35.9 2 0.0 0 62.22 MS + L RI To t. 0.0 0 81 .4 9 29.3 9 17 14.6 2 85.0 3 30 18.51 Ni tr og en co m po u n d s (1) 28.6 2 167 1 N it ro ge n co m p o und M I 0.0 0 0.0 0 0.0 0 9 0.8 9 0.0 0 15 6 .80 m s To t. 0.0 0 0.0 0 0.0 0 90.8 9 0.0 0 15 6.8 0 La ct on es (1) 26.0 4 15 69 2(3H)-F ura n o n e, di h ydr o L O 0.0 0 2.29 0.0 0 0.0 0 0.0 0 0 .0 0 M S + LRI To t. 0.0 0 2.29 0.0 0 0.0 0 0.0 0 0.0 0 aRet en tio n time o f vo la tile co m p o unds. bK o va ts in dex calcula te d fo r R T X-W A X ca p illa ry co lumn (C as te llo ,1 999) [ 14 ]. cOr igin: F (ca rb o h ydra te fe rm en ta tio n); A C (a mino acid ca ta b o lism); L O (li p id o xida tio n); ME (micr o b ia lest er ifica tio n); S (sp ices an d co n dime n ts); M I (mis cella neo u s: co n ta m ina n ts, u nkno wn). dRi p enin g time acco rd in g to exp er imen ta lp la n. eM inim u m extrac ted q u an ti ties (n g 4 -met h yl-2-p en ta n o n e eq ui va len ts g sa la mi − 1 ). V al u e 0 m ea n s tha t trace am o u n ts w er e d et ec te d (< 0.1 n g g − 1 ). f M axim u m extrac ted q u an ti ties (n g 4 -met h yl-2-p en ta n o n e eq u iv al en ts g sa la m i − 1 ). V al u e 0 m ea n s tha t trace am o u n ts w er e det ec ted (< 0.1 n g g − 1 ). g MS + L RI, m ass sp ec tr um, an d L RI agr ee w it h thos e o f au th en tic co m p o unds; m s + lr i, mass sp ec tr um, an d L RI in agr eemen t w it h the li te ra tu re ;m ass sp ec tr u ma gr ee sw it hs p ec tr u mi nt h e NIS T lib ra ry M ass Sp ec tral D at abas e.
T a ble 5: V o la tile co m p o unds det ec ted in “N o b ile d el G ia ro lo ” sa la mi d u ri n g ri p enin g (n g g −1 ). RT a LRI b Co m p o u n d s O ri gi n c 𝑇0 d 𝑇1 𝑇2 𝑇3 𝑇4 M et h o d o f iden tifica tio n g Mi n e Ma x f Mi n M ax Mi n M ax Mi n M ax Mi n M ax Te rp en es (20) 5.5 5 75 5 𝛼 -P inene S 0.0 0 286.01 0.0 0 23 6 7. 21 210.3 1 108 1.5 4 210.3 1 65 5.9 6 0.0 0 6 75 2.4 6 MS + L RI 5.8 4 76 6 𝛼 -Th u jene S 0.0 0 0.0 0 0.0 0 0.0 0 0.0 0 0.0 0 0.0 0 0.0 0 0.0 0 77 3.5 2 M S + LRI 8.8 1 88 4 𝛽 -P inene S 5.13 4 4 8.13 15.9 2 4 0 0 0.1 7 20 0.9 3 31 71.5 1 62 8.94 10 20.1 9 0.0 0 20 29 .6 5 MS + L RI 9. 79 92 3 Sa b inene S 0.0 0 0.0 0 0.0 0 0.0 0 0.0 0 21.6 8 0.0 0 6 8.3 4 0.0 0 38 21.9 6 MS + L RI 10.6 2 95 6 T er p en S 0.0 0 29 .41 0.0 0 0.0 0 0.0 0 38 2.7 3 0.0 0 32 4 8.16 0.0 0 0.0 0 m s 11.20 979 3-C ar ene S 0.0 0 4 0 62.3 8 16 86.41 14 1.6 1 65 5.80 95 5.0 2 10 35 .26 216 5.81 0.0 0 94 4 0.5 9 M S + LRI 12.05 1013 𝛼 -Phel la n dr ene S 0.0 0 9 9 6.05 157 .8 9 9 0.4 4 30.9 2 4 2.8 3 45.3 9 97 .0 0 0.0 0 57 4.6 3 M S + LRI 12.5 1 10 31 𝛽 -M ir cene S 0.0 0 76 0.7 4 85.4 2 4.0 0 27 .7 3 36.2 8 39 .5 1 86.7 1 0.0 0 587 .80 M S + LRI 12.7 9 10 4 2 𝛼 -T er p inene S 0.0 0 24.5 1 0.0 0 0.0 0 0.0 0 0.0 0 0.0 0 0.0 0 0.0 0 6 6.6 1 M S + LRI 13.6 9 107 8 L imo n ene S 0.0 0 4 6 6 7. 83 6.57 897 .05 20 0.3 3 629 .05 511.2 5 63 6.4 0 0.0 0 54 4 8.6 4 MS + L RI 13.9 9 10 9 0 T er p en S 0.0 0 33.5 3 0.0 0 0.0 0 0.0 0 0.0 0 0.0 0 0.0 0 0.0 0 63 7.3 3 m s 16.6 1 11 94 p -C ymene S 0.0 0 63 6.21 0.0 0 0.0 0 0.0 0 28.8 2 0.0 0 91.3 1 0.0 0 27 5.18 M S + LRI 17 .0 6 1212 T er p en S 56.01 56.01 4 5.7 3 3.5 9 0.0 0 12.3 2 0.0 0 27 .4 0 0.0 0 34.47 m s 22.3 1 14 21 T er p en S 15.8 2 15.8 2 24.9 2 0.2 5 0.0 0 9.1 7 0.0 0 79 .47 0.0 0 12 5.4 9 m s 24.2 4 14 97 T er p en S 21.4 4 21.4 4 22.80 3.7 5 0.0 0 17 .0 3 0.0 0 4.45 0.0 0 141.8 2 m s 24.4 6 15 0 6 T er p en S 0.0 0 0 .0 0 0.0 0 0.0 0 0.0 0 0.0 0 0.0 0 0.0 0 0.0 0 10.2 3 m s 25 .1 3 15 33 tr an s-𝛽 -C ar yo p h yl lene S 0.3 5 35.6 3 1.7 6 4.5 0 0.0 0 14.0 9 0.0 0 4 6.6 1 0.0 0 39 .47 MS + L RI 25 .26 15 38 T er p ineo l S 0.0 0 0.0 0 0.0 0 0.0 0 0.0 0 0.0 0 0.0 0 0.0 0 0.0 0 88.8 9 MS + L RI 27 .16 16 13 T er p en S 0.0 0 0.0 0 0.0 0 0.0 0 0.0 0 0.0 0 0.0 0 0.0 0 0.0 0 15.3 0 m s To t. 98.7 5 12 07 3.7 0 20 47 .42 75 12 .57 13 26.0 2 64 02 .07 247 0.6 6 82 27 .8 1 0.0 0 308 64.0 4 A lde hy des (4) 8.18 85 9 H exa nal L O 0.0 0 6.7 8 29 .9 3 10 4.6 9 12.57 72 .86 17 .2 5 4 0.9 3 0.0 0 12 8.4 6 M S + LRI 20.5 0 13 49 N o n an al L O 0.0 0 0.0 0 0.0 0 0.0 0 0.0 0 9.08 0.0 0 29 .57 0.0 0 84.5 4 MS + L RI 23 .2 7 145 9 B enzaldeh yd e A C 1.13 79 .3 1 4.4 9 95.1 7 58.98 27 7. 6 0 0.0 0 13 0.98 0.0 0 43 1.1 7 M S + LRI 25 .86 15 62 B enzenacet al deh yde A C 0.0 0 6 77 .86 0.0 0 11 7.94 0.0 0 110 3.6 1 19 2.6 2 19 7. 08 0.0 0 9 9 0.6 4 M S + LRI To t. 1.13 76 3.9 5 34.42 317 .8 0 71.5 5 14 63 .15 20 9.8 7 398.5 6 0.0 0 16 34.8 1
Ta b le 5: C o n ti n u ed . RT a LRI b Co m p o u n d s O ri gi n c 𝑇0 d 𝑇1 𝑇2 𝑇3 𝑇4 M et h o d o f iden tifica tio n g Mi n e Ma x f Mi n M ax Mi n M ax Mi n M ax Mi n M ax Ke to n es (9) 2.12 61 8 2-P ro p ano ne MI 35 .7 7 26 0.9 1 23.67 4 25 4.5 4 31 7.1 4 316 8.9 0 18 1.12 10 03.98 0.0 0 93 9.6 9 M S + LRI 2.9 1 65 0 2-B u ta n o n e F 0.0 0 10 35.3 8 0.0 0 24 86 8.6 9 0.0 0 43 9 93 .8 9 0.0 0 35 61.2 4 0.0 0 62 57 .3 5 MS + L RI 4.7 7 72 4 2-P en ta n o n e L O 0.0 0 0.0 0 0.0 0 63.08 0.0 0 0.0 0 0.0 0 0.0 0 0.0 0 0 .0 0 M S + LRI 14.01 10 91 2-H ep ta no ne L O 0.0 0 63.11 0.0 0 13.6 5 0.0 0 10.0 2 0.0 0 33.22 0.0 0 0.0 0 M S + LRI 16.2 7 118 1 3-O ct an o n e L O 0.0 0 28.2 8 0.0 0 2.95 3.22 15.18 3.7 7 10.9 6 0.0 0 33.4 2 MS + L RI 16.98 120 9 3-H ydr o x y-2-b u ta no ne F 4.2 4 57 1.1 9 0.0 0 65 3.9 9 11.87 14 28.9 1 37 .8 1 51 .11 0.0 0 180.0 4 M S + LRI 18.9 1 12 86 6 -M et h yl-5-hep ten-2-o ne MI 0.0 0 0.0 0 0.0 0 0.0 0 0.0 0 2.10 0.0 0 6.8 5 0.0 0 10.0 6 M S + LRI 20.9 2 13 65 2-N o n an o n e L O 0.0 0 17 7.8 2 0.0 0 3.3 9 0.0 0 32.67 0.0 0 0.0 0 0.0 0 0.0 0 M S + LRI 24.5 15 08 4-H ydr o x y-2-b u ta no ne MI 0.0 0 0.0 0 0.0 0 76.6 8 0.0 0 0.0 0 0.0 0 17 .58 0.0 0 0.0 0 M S + LRI To t. 40 .0 1 213 6.6 9 23.6 7 29 93 6.9 7 33 2.23 48 651.6 7 222.7 0 46 84.94 0.0 0 742 0.5 6 Al co h ol s (13) 3.4 9 67 3 E th an o l F 17 6.0 4 26 17 .4 9 49 2.29 59 61 .6 6 17 38.3 5 61 76.15 988.7 4 55 03.4 4 0.0 0 36 87 .5 1 MS + L RI 5.97 77 1 2-B u ta n o l F 0.0 0 0.0 0 0.0 0 279 .15 0.0 0 95 6.6 2 0.0 0 5015.1 9 0.0 0 72 3.3 6 M S + LRI 7. 22 82 1 1-P ro p ano l L O 0.0 0 0.0 0 0.0 0 20 2.9 0 0.0 0 38 1.67 0.0 0 18 4.94 0.0 0 0.0 0 M S + LRI 10.9 9 6 7 2-M et h yl-1 -p ro p an o l A C 0.0 0 11.08 28.8 4 49 .3 3 0.0 0 11.2 3 0.0 0 35.7 5 0.0 0 0.0 MS + L RI 14.7 5 1120 3-M et h yl-1 -b u ta no l A C 0.0 0 0.0 0 0.0 0 329 .0 6 36.95 26 9.7 7 15 9.3 5 86 1.5 1 0.0 0 32 5.12 M S + LRI 16.87 120 4 3-M et h yl-3-b u te n-1 -o l A C 0.0 0 0.0 0 20.4 9 85.8 4 0.0 0 2.6 2 0.0 0 8.45 0.0 0 0.0 0 M S + LRI 16.9 6 1208 1-P en ta no l L O 0.0 0 1.9 2 0.0 0 11.15 0.0 0 10.41 0.0 0 33.4 8 0.0 0 26.4 2 M S + LRI 18.3 9 126 5 A lco h o l MI 0.0 0 0.0 0 0.0 0 0.0 0 0.0 0 0.0 0 0.0 0 0.0 0 0.0 0 8.86 m s 18.5 3 12 70 3-M et h yl-2-b u te n-1 -o l A C 0.0 0 0.0 0 0.0 0 19 .87 0.0 0 0.0 0 0.0 0 0.0 0 0.0 0 2.7 5 M S + LRI 19 .4 2 13 0 6 2,3-B u ta n edio l M E 0.0 0 0.0 0 0.0 0 3.01 0.0 0 0.0 0 0.0 0 0.0 0 0.0 0 0.0 0 M S + LRI 19 .5 3 13 10 1-H exa n o l L O 0.0 0 75.08 0.0 0 6.3 2 0.0 0 35.9 6 0.0 0 116.95 0.0 0 17 .6 3 MS + L RI 22.0 4 1410 1-O ct en-3-o l L O 1.1 9 19 0.8 2 5.2 7 7.07 0.0 0 28.4 2 0.0 0 92.3 9 0.0 0 62.0 6 MS + L RI 31 .05 17 6 8 B enzenet ha no l M I 0.0 0 53.8 2 0.0 0 6.8 2 0.0 0 14.9 2 0.0 0 4 8.6 9 0.0 0 4 8.21 M S + LRI To t. 17 7.23 29 50.21 54 6.8 9 696 2.1 8 117 5.3 0 78 87 .7 7 11 48.0 9 11 90 0.7 9 0.0 0 49 01.9 2 F re e fa tty ac ids (8) 21.6 1 13 93 A cet ic acid 24 9.6 3 87 0.6 2 30 3.0 9 22 4 63 .67 10 25 .5 6 6 76 1.9 9 76 5.9 2 31 97 .5 4 0.0 0 27 0 7. 34 MS + L RI 23 .7 1 147 6 P ro p ano ic acid 2.7 6 11.21 2.2 7 72 .15 13.5 4 11 9. 9 9 37 .2 3 4 4.7 1 0.0 0 31.5 2 MS + L RI 24.9 9 15 27 2-M et h yl-p ro p an o ic acid 0.0 0 1.8 9 1.1 9 35.26 2.7 4 26.57 4.86 8.5 3 0.0 0 0.0 0 M S + LRI 26.22 157 6 B u ta n o ic acid 12.5 6 58.3 4 17 .2 3 18 1.3 3 33 .22 111.9 1 19 .0 9 10 3.7 7 0.0 0 0 .0 0 M S + LRI 27 .0 9 16 11 3-M et h yl b u ta n o ic acid 2.5 4 30.87 2.4 7 111.7 5 7. 4 2 79 .4 2 11.97 23 .15 0.0 0 0.0 0 M S + LRI 28.3 8 16 62 P en ta no ic acid 0.0 0 0.2 4 0.6 3 6.7 4 0.0 0 4.9 1 1.7 1 0.7 3 0.0 0 0 .0 0 M S + LRI 29 .80 17 18 H exa n o ic acid 1.13 4 0.16 2.5 6 19 .9 2 5.11 20.5 1 6.58 16.21 0.0 0 12.5 5 MS + L RI 32 .7 5 18 36 O ct an o ic acid 0.0 0 0.0 0 0.0 0 0.0 0 0.0 0 1.47 0.0 0 4.79 0.0 0 6.1 9 M S + LRI To t. 26 8.6 2 10 13.3 3 32 9.4 4 22 89 0.8 2 10 87 .59 71 26.7 7 84 7.3 6 33 99 .4 3 0.0 0 27 57 .6 0
Ta b le 5: C o n ti n u ed . RT a LRI b Co m p o u n d s O ri gi n c 𝑇0 d 𝑇1 𝑇2 𝑇3 𝑇4 M et h o d o f iden tifica tio n g Mi n e Ma x f Mi n M ax Mi n M ax Mi n M ax Mi n M ax Hy d ro ca rb on s (5) 1.5 1 50 0 P en ta ne L O 0.0 0 20.1 4 0.0 0 18.21 27 .3 2 11 77 .3 9 0.0 0 85.3 7 0.0 0 0 .0 0 M S + LRI 1.6 6 6 0 0 H exa ne L O 0.0 0 2015 1.8 3 0.0 0 0.0 0 0.0 0 0.0 0 0.0 0 0.0 0 0.0 0 0 .0 0 M S + LRI 6.08 77 6 T o lu ene M I 0.0 0 4.26 0.0 0 0.0 0 312.7 5 76 3.9 6 0.0 0 25 13.08 0.0 0 212 7.98 MS + L RI 11.6 1 9 95 o -X yl ene M I 0.0 0 33.5 6 0.0 0 0.0 0 1.4 2 4 5.29 0.0 0 0.0 0 0.0 0 0 .0 0 M S + LRI 12.0 4 1013 p -X yl ene M I 0.6 5 65.8 5 0.0 0 0.0 0 0.0 0 0.0 0 0.0 0 0.0 0 0.0 0 0.0 0 M S + LRI To t. 0.6 5 20 27 5.6 4 0.0 0 18.21 341.4 9 198 6.6 4 0.0 0 25 98.4 5 0.0 0 21 27 .98 Es te rs (2) 2.5 6 63 6 A cet ic acid m et h yl est er ME 0.0 0 6 0 4.4 0 0.0 0 0.0 0 0.0 0 0.0 0 0.0 0 0.0 0 0.0 0 0.0 0 M S + LRI 3.08 65 6 A cet ic acid et h yl est er M E 25.15 72 8.97 28.47 167 .9 1 57 .05 69 .9 3 75.0 3 23 1.11 0.0 0 0 .0 0 M S + LRI To t. 25 .15 13 33 .3 7 28.47 16 7.91 57 .05 69 .9 3 75.0 3 23 1.11 0.0 0 0.0 0 Su lf ur co mp oun d s (4) 1.95 61 2 C ar b o n d isu lfide S 1.3 4 34.08 0.0 0 0.0 0 0.0 0 0.0 0 0.0 0 38 1.6 6 0.0 0 0.0 0 M S + LRI 3.80 6 85 A ll yl met h yl su lfide S 20.8 1 59 0.2 8 0.0 0 26.3 7 0.0 0 29 0.2 3 0.0 0 94 2.4 9 0.0 0 10 98.1 7 MS + L RI 5.3 4 74 6 Su lf u r co m p o und S 0.0 0 0.0 0 0.0 0 1.5 0 0.0 0 6 6.2 3 20.7 2 21 7.6 4 0.0 0 110.10 m s 27 .8 5 16 4 1 D imet h yl d isu lfide S 0.0 0 21.5 6 0.0 0 0.0 0 0.0 0 0.0 0 0.0 0 0.0 0 0.0 0 33.7 6 MS + L RI To t. 22.15 64 5.9 2 0.0 0 27 .8 7 0.0 0 35 6.4 6 20.7 2 15 41.7 9 0.0 0 12 42.0 3 Ni tr og en co m po u n d s (2) 18.45 1267 2,6-Dimet h yl p irazin M I 0.0 0 0.0 0 0.0 0 0.0 0 0.0 0 0.0 0 0.0 0 0.0 0 0.0 0 5.8 2 M S + LRI 28.12 16 52 A cet amide MI 0.0 0 0.0 0 0.0 0 0.0 0 0.0 0 1.3 5 0.0 0 4 .3 0 0.0 0 6.6 4 M S + LRI To t. 0.0 0 0.0 0 0.0 0 0.0 0 0.0 0 1.3 5 0.0 0 4.3 0 0.0 0 12.4 6 La ct on es (1) 26.0 3 15 69 2(3H)-F ura n o n e, di h ydr o L O 0.0 0 0.5 4 1.05 21.88 9.07 21.0 0 4.8 5 28.5 2 0.0 0 0 .0 0 M S + LRI To t. 0.0 0 0.5 4 1.05 21.8 8 9.07 21.0 0 4.8 5 28.5 2 0.0 0 0.0 0 Et h er s (1) 27 .9 9 16 4 6 D imet o x y b enzene M I 0.0 0 54.88 0.0 0 0.0 0 1.7 7 7.3 9 0.0 0 5.8 1 0.0 0 9.05 M S + LRI To t. 0.0 0 54.8 8 0.0 0 0.0 0 1.7 7 7.3 9 0.0 0 5.8 1 0.0 0 9.05 aRet en tio n time o f vo la tile co m p o unds. bK o va ts in dex calcula te d fo r R T X-W A X ca p illa ry co lumn (C as te llo ,1 999) [ 14 ]. cOr igin: F (ca rb o h ydra te fe rm en ta tio n); A C (a mino acid ca ta b o lism); L O (li p id o xida tio n); ME (micr o b ia lest er ifica tio n); S (sp ices an d co n dime n ts); M I (mis cella neo u s: co n ta m ina n ts, u nkno wn). dRi p enin g time acco rd in g to exp er imen ta lp la n. eM inim u m extrac ted q u an ti ties (n g 4 -met h yl-2-p en ta n o n e eq ui va len ts g sa la mi − 1 ). V al u e 0 m ea n s tha t trace am o u n ts w er e d et ec te d (< 0.1 n g g − 1 ). f M axim u m extrac ted q u an ti ties (n g 4 -met h yl-2-p en ta n o n e eq u iv al en ts g sa la m i − 1 ). V al u e 0 m ea n s tha t trace am o u n ts w er e det ec ted (< 0.1 n g g − 1). gMS + L RI, m ass sp ec tr um, an d L RI agr ee w it h thos e o f au th en tic co m p o unds; m s + lr i, mass sp ec tr um, an d L RI in agr eemen t w it h the li te ra tu re ;m ass sp ec tr u ma gr ee sw it hs p ec tr u mi nt h e NIS T lib ra ry M ass Sp ec tral D at abas e.
Table 6: Volatile compounds detected in “Salamini di Mandrogne” salami (ng g−1).
RTa LRIb Compounds Originc 𝑇0d Method of identificationg
Mine Maxf Terpenes (14) 6.14 755 𝛼-Pinene S 0.00 675.10 MS + LRI 9.75 884 𝛽-Pinene S 31.35 1636.87 MS + LRI 12.17 979 3-Carene S 0.00 204.03 MS + LRI 12.98 1013 𝛼-Phellandrene S 0.00 7.32 MS + LRI 13.45 1031 𝛽-Myrcene S 0.00 55.99 MS + LRI 14.56 1078 Limonene S 35.00 722.61 MS + LRI 14.87 1125 Eucalyptol S 0.00 78.98 MS + LRI 16.51 1190 𝛾-Terpinene S 0.00 36.01 MS + LRI 23.73 1477 Canphor S 0.00 5.45 MS + LRI 24.74 1517 Linalool S 5.92 26.52 MS + LRI 25.70 1533 trans-𝛽-Caryophyllene S 14.58 219.65 MS + LRI 27.17 1614 Humulene S 0.00 7.98 MS + LRI 27.70 1635 Terpen S 0.00 1.16 MS + LRI 34.20 1893 Eugenol S 0.00 4.09 MS + LRI Tot. 86.85 3681.76 Ketones (3) 4.92 743 2,3-Butanedione F 0.00 446.48 MS + LRI 14.04 1092 2-Octanone LO 0.00 1.70 MS + LRI 17.78 1209 3-Hydroxy-2-butanone F 579.38 52656.86 MS + LRI Tot. 579.38 53105.04 Alcohols (11) 3.85 673 Ethanol F 110.24 15032.00 MS + LRI 10.24 967 2-Methyl-1-propanol 0.00 325.00 MS + LRI 11.54 993 1-Methoxy-2-propanol 0.00 39.18 MS + LRI 12.68 1038 1-Butanol F 0.00 35.03 MS + LRI 13.86 1085 Alcohol 0.00 2.17 Ms 15.49 1120 3-Methyl-1-butanol AC 0.00 4116.36 MS + LRI 16.82 1202 Alcohol 0.00 2.62 Ms 17.00 1208 1-Pentanol LO 0.00 140.41 MS + LRI 20.11 1310 1-Hexanol LO 0.00 201.62 MS + LRI 22.58 1431 1-Octen-3-ol LO 4.63 115.49 MS + LRI Tot. 114.87 20009.88
Free fatty acids (8)
22.27 1393 Acetic acid 131.03 626.36 MS + LRI
23.53 1469 Formic acid 0.00 1.20 MS + LRI
24.31 1476 Propanoic acid 0.00 14.52 MS + LRI
25.00 1527 2-Methyl-propanoic acid 0.00 12.57 MS + LRI
26.22 1576 Butanoic acid 72.00 8.86 MS + LRI
27.08 1611 3-Methyl-butanoic acid 7.12 37.29 MS + LRI
28.39 1662 Pentanoic acid 0.00 11.77 MS + LRI
30.38 1718 Hexanoic acid 4.00 30.96 MS + LRI
Tot. 214.15 743.53
Sulfur compounds (7)
4.24 685 Allyl methyl sulfide S 0.00 947.78 MS + LRI
7.37 827 Mercapto acetone S 0.00 22.06 MS + LRI
16.18 1177 Sulfur compound S 0.00 41.57 Ms
23.12 1453 Diallyl disulfide S 7.78 25.93 MS + LRI
28.30 1659 Sulfur compound S 0.00 7.04 Ms
29.43 1704 Sulfur compound S 0.00 0.60 Ms