S
CUOLAN
ORMALES
UPERIOREP
H.D
.T
HESISInterlaced biophysical methods to unveil
membrane receptor organization
Barbara Storti
A
DVISORDr. Ranieri Bizzarri
Foreword
This thesis is the result of my research activity at the NEST laborarory of Scuola Normale Superiore in Pisa: I began my studies on the membrane receptor issue in 2007, prompted by the group interest in intracellular nanobiophysics. This research was carried out within a joint PhD program sponsored by Scuola Normale Superiore and Italian Institute of Technology.
List of publications
Abbruzzetti S, Bizzarri R, Luin S, Nifosi R, Storti B, Viappiani C, and Beltram F (2010) Photoswitching of E222Q GFP mutants: "concerted" mechanism of chromophore isomerization and protonation. Photochem Photobiol Sci 9(10):1307-1319.
Storti B, Bizzarri R, Cardarelli F, and Beltram F (2012) Intact microtubules preserve transient receptor potential vanilloid 1 (TRPV1) functionality through receptor binding. J Biol Chem 287(10):7803-7811.
Storti B, Di Rienzo C, Cardarelli F, Bizzarri R, and Beltram F (2015) Unveiling TRPV1 spatio-temporal organization in live cell membranes. PLoS ONE 10(3):e0116900.
Publications not included in this thesis:
Signore G, Nifosi R, Albertazzi L, Storti B, and Bizzarri R (2010) Polarity-sensitive coumarins tailored to live cell imaging. J Am Chem Soc 132(4):1276-1288.
Albertazzi L, Storti B, Marchetti L, and Beltram F (2010) Delivery and subcellular targeting of dendrimer-based fluorescent pH sensors in living cells. J Am Chem Soc 132(51):18158-18167.
Albertazzi L, Brondi M, Pavan G M, Sato S S, Signore G, Storti B, Ratto G M, and Beltram F (2011) Dendrimer-based fluorescent indicators: in vitro and in vivo applications. PLoS One 6(12):e28450
Battisti A, Digman M A, Gratton E, Storti B, Beltram F, and Bizzarri R (2012) Intracellular pH measurements made simple by fluorescent protein probes and the phasor approach to fluorescence lifetime imaging. Chem Commun (Camb) 48(42):5127-5129.
Signore G, Abbandonato G, Storti B, Stockl M, Subramaniam V, and Bizzarri R (2013) Imaging the static dielectric constant in vitro and in living cells by a bioconjugable GFP chromophore analog. Chem Commun 49(17):1723-1725.
Albertazzi L, Storti B, Brondi M, Sulis Sato S, Ratto G M, Signore G and Beltram F (2013) Synthesis, Cellular Delivery and In vivo Application of Dendrimer-based pH Sensors. J. Vis. Exp. (79), e50545, doi:10.3791/50545.
Koenig M, Storti B, Bizzarri R, Guldi D M, Brancato G, and Bottari G (2016) A fluorescent molecular rotor showing vapochromism, aggregation-induced emission, and environmental sensing in living cells J. Mat. Chem. D Accepted DOI: 10.1039/C5TC03541D
Table of Contents
Introduction ... 1
1 Biological background ... 7
1.1
Organization of the plasma membrane and its functional role ... 7
1.1.1
The first tier: actin membrane-skeleton-induced compartments ... 9
1.1.2
The second tier: raft domains ... 10
1.1.3
The third tier: dynamic protein complex domains ... 12
1.1.4
Caveolae as plasma membrane nanodomains ... 14
1.1.5
Tubulin and microtubules as modulators of membrane and membrane receptors ... 16
1.2
Membrane-modulated neurotransmitter signaling: Transient Receptor Potential Vanilloid 1 (TRPV1) ... 17
1.2.1
Structure of TRP ... 19
1.2.2
Function: agonists ... 20
1.2.3
Function: antagonists and desensitization ... 22
2 Fluorescence imaging tools ... 25
2.1
Optical sectioning in fluorescence microscopy ... 25
2.1.1
Confocal laser scanning fluorescence microscopy ... 25
2.1.2
Total internal reflection microscopy ... 27
2.2
Genetically-encoded fluorescent probes for live cell imaging: autofluorescent proteins ... 28
3 Binding interactions of TRPV1 in living cells ... 35
3.1
Imaging biomolecular interactions: Fluorescence (Förster) Resonance Energy Transfer (FRET) ... 36
3.1.1
General description ... 36
3.1.2
FRET via sensitized emission ... 39
3.1.3
Optimized fluorescent proteins as FRET couples ... 40
3.2
Detection of TRPV1 interactions with microtubules ... 41
3.2.1
Localization and functionality of transiently transfected TRPV1-FP chimeras ... 42
3.2.2
Effect of microtubules disassembly on TRPV1 activation ... 44
3.2.3
FRET imaging of TRPV1-microtubule binding ... 45
3.3
TRPV1 interaction with caveolin-1 ... 48
3.3.1
FRET imaging of TRPV1-caveolin-1 binding ... 49
3.4
Experimental procedures ... 52
3.4.1
Engineering of labeled-TRPV1 vectors ... 52
3.4.2
Cell culture and transfections. ... 52
3.4.3
Fluorescence imaging by confocal laser scanning microscopy (CLSM) and by Total Internal Reflection Fluorescent microscopy (TIRFM) ... 53
3.4.4
Cell calcium measurement. ... 53
3.4.5
FRET measurements and data analysis. ... 53
4 Temporal Image Correlation Spectroscopy: temporal dynamics of TRPV1 and
TRPV1-microtubule complex on membrane ... 55
4.1
Correlation spectroscopy: general concept and application to imaging ... 56
4.1.1
Temporal Image Correlation Spectroscopy ... 58
4.2
Average membrane diffusion properties of TRPV1 ... 61
4.2.1
Calibration of tICS technique ... 61
4.2.2
tICS on TRPV1 at basal state and under stimulation ... 61
4.3
Temporal dynamics of TRPV1-microtubule complex ... 66
4.3.1
Effect of microtubule disassembly on TRPV1 dynamics ... 66
4.3.2
Analysis of the dynamics of TRPV1-µT complex at basal state ... 66
4.3.3
Analysis of the dynamics of TRPV1-microtubules complex upon agonist stimulation . 70
4.4
Concluding remarks ... 71
4.5
Experimental Procedures ... 71
4.5.1
Cell culture and transfections. ... 71
4.5.2
Temporal Image Correlation Spectroscopy (tICS) and tICS-FRET. ... 72
4.5.3
Calibration of tICS technique ... 72
5 Study of TRPV1 oligomerization in living cells: Homo-FRET imaging and Number and Brightness analysis ... 73
5.1
Fluorescence Anisotropy Imaging Microscopy (FAIM) on TRPV1 ... 74
5.1.1
Homo-FRET theory and FAIM ... 74
5.1.2
FAIM measurements on basal and stimulated TRPV1 ... 77
5.1.3
FAIM measurements on TRPV1 under microtubule disassembly ... 79
5.2
The Number and Brightness analysis ... 81
5.2.1.
Photophysical background of N&B analysis ... 81
5.2.2
N&B analysis for quantitative investigation of oligomerization status of TRPV1 before and after activation ... 85
5.3
Concluding remarks ... 90
5.4
Experimental procedures ... 91
5.4.1
Plasmids, cell culture and trasfections ... 91
5.4.2
FAIM: Anisotropy imaging. ... 91
5.4.3
Number and Brightness (N&B) analysis. ... 91
6 Spatio-Temporal Image Correlation Spectroscopy: revealing connections between TRPV1 function and receptor organization on membrane ... 93
6.1
iMSD approach to spatio-temporal image correlation spectroscopy ... 94
6.1.1
Photophysical background of iMSD ... 94
6.1.2
iMSD to study mixed binding and diffusion ... 97
6.2
Spatio-temporal investigation of TRPV1 membrane mobility by iMSD ... 98
6.2.1
Spatiotemporal organization of TRPV1-caveolin (TRPV1-C) complex ... 98
6.2.2
Spatiotemporal organization of TRPV1-microtubule (TRPV1-T) complex ... 100
6.2.3
Fast- and brownian-diffusing TRPV1 pool ... 101
6.2.4
Effect of microtubule disassembly or lipid-raft depletion on TRPV1 diffusion ... 104
6.3
Concluding remarks ... 106
6.4
Experimental procedures ... 107
6.4.1
Cell Cultures, Constructs and Transfection. ... 107
6.4.2
iMSD and iMSD-FRET. ... 108
iii
7.1
Molecular association of membrane TRPV1 with itself and other proteins ... 109
7.2
Membrane dynamics of TRPV1 ... 111
7.3
Functional model of TRPV1 ... 113
Appendix A Image Correlation spectroscopy: mathematical foundations ... 115
Appendix B Photoswitching of E222Q GFP mutant linked to TRPV1 for advanced imaging applications ... 121
B.1
EYQ1 ... 122
B.1.1
Optical properties of EYQ1 mutant in the native state ... 122
B.1.2
Photoswitching of EYQ1 mutant ... 123
B.2
TRPV1-EYQ1 for Superresolution Optical Fluctuation Imaging (SOFI) ... 128
B.2.1
SOFI ... 128
B.2.2
TRPV1-EYQ1 for SOFI ... 132
Introduction
Cellular plasma membrane is not just a barrier separating inner and outer cellular volumes but it is critical for communication with the extracellular milieu. Indeed, the plasma membrane enables the transfer of many compounds important for the cell metabolism and for chemical and electrical signaling. The capsaicin receptor (Transient Potential Vanilloid 1 or TRPV1) belongs to the fascinating class of polymodal membrane receptors that integrate several physical and molecular stimuli and translate them into intracellular signaling. More specifically, TRPV1 is a nonselective voltage-dependent, temperature-dependent, ligand-dependent cation channel with a preference for Ca2+. Modulators of TRPV1 activity include: noxious heat, low pH, capsaicin, and capsaicin analogues like resiniferatoxin (RTX). TRPV1 is expressed both in sensory neurons, where it is involved in pain signaling, and in many other cell types (e.g. endothelial cells). The research on TRPV1 is driven by its important biological role, but it is also believed that TRPV1 activation mechanism could be relevant to the discovery and design of drugs capable of controlling TRPV1 activity and therefore pain stress in humans. Surprisingly, many molecular properties of TRPV1 are still largely unknown.
Among the unclear aspects of TRPV1 activity, a hot topic is represented by its interactions with the cytoskeleton. TRPV1 was recently proposed to bind to microtubule β-tubulin. Activation of TRPV1 was demonstrated to yield fast disassembly of microtubules, albeit at agonist concentrations much above saturation. This suggests that TRPV1 may regulate some specific cell functions (and possibly neuronal functions) through cytoskeleton reshaping. Yet, the alleged direct binding of TRPV1 to microtubules raises the question: do microtubules also modulate TRPV1 activity? If so, the microtubule-TRPV1 interplay may play a role in tuning cell response to TRPV1 activation upon different factors including noxious stimuli.
The activation of the TRPV1 due to noxious stimulation is followed by the attenuation of nociceptive sensory neuron excitability, making nociceptors partially or totally refractory to subsequent stimuli. Available knowledge is limited to acute,
Ca2+-dependent, desensitization. Conversely, long-term TRPV1 desensitization mechanisms are largely unknown. It was speculated that long-term desensitization could involve TRPV1 withdrawal from the cell surface. Indeed, similar to members of other receptor families, activity-dependent control of plasma membrane-resident receptors may involve TRPV1 endocytosis followed either by receptor recycling to the plasma membrane or by its degradation through the proteosomal or lysosomal pathways. A recent study showed that agonist stimulation promoted receptor internalization via a clathrin-independent endocytotic mechanism. The classical alternative to clathrin-dependent endocytosis of protein is represented by caveolar endocytosis, which is in turn is modulated by lipid rafts, membrane microdomains enriched in cholesterol and saturated lipids. Interestingly, several members of the TRP family were demonstrated to reside near caveolin-1, the main structural protein of caveolae. Thus, I may question whether caveolin-1 is implied in the clathrin-free endocytosis of TRPV1. If so, TRPV1 dynamics and interactions could be influenced by membrane raft regions.
Answering these questions requires high-resolution / high-sensitivity imaging of the receptor to account for its specific dynamics and interaction interplay. In my thesis I set out to address these issues by a toolbox of fluorescence imaging techniques such as Förster Resonance Energy Transfer, Fluorescence Anisotropy Imaging, and Spatio-temporal image correlation spectroscopy. I investigated receptor properties such as membrane mobility, microtubule and caveolin-1 binding, and TRPV1 oligomerization status. My experimental strategies benefited from the use of genetically-encodable fluorescent reporters belonging to the green fluorescent protein family.
The thesis is organized as follow:
• In Chapter 1 I provide a brief review of the biological context of TRPV1, namely the cell plasma membrane. This is important for the full understanding of biological and biophysical aspects of receptor functionality. For this reason I focus on membrane organization with a particular regard to all compartments that may be implied in the regulation of TRPV1.
• In Chapter 2 I introduce all the common tools shared by the imaging methods that were employed in this thesis work. In particular, the chapter presents a short overview on fluorescence microscopy and genetically-encoded fluorescent proteins.
Introduction 3
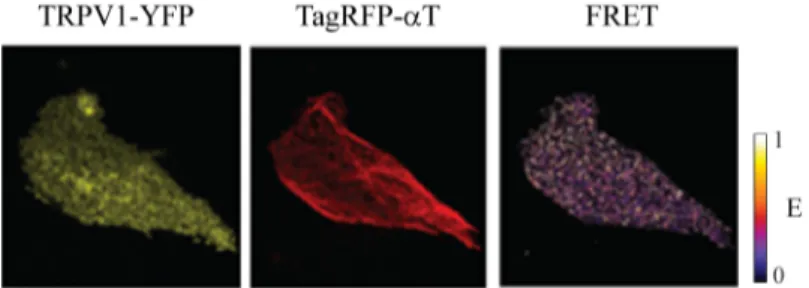
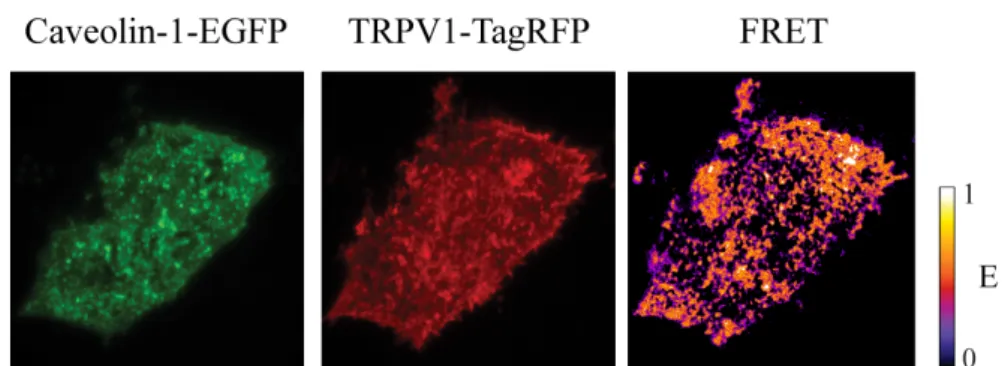
• Chapter 3 is the first chapter dealing with my experimental results. There I present the study of the binding interactions of the TRPV1 receptor in living cells revealed by Förster Resonance Energy Transfer (FRET). A first part of the chapter is devoted to a short description of the FRET imaging technique, whereas in the second part I describe the FRET analysis to reveal that TRPV1 and tubulin mutually interact in the membrane of living cells at rest and under agonist stimulation. Conversely, nocodazole-induced disassembly of microtubules abolishes the FRET signal, indicating the dissociation of TRPV1-microtubule complex. Similarly, FRET analysis demonstrates the binding interaction between TRPV1 and caveolin-1 at rest. Complementary colocalization studies demonstrate that agonist stimulation of the receptor triggers its internalization by caveolar endocytosis.
• In Chapter 4 I show that temporal Image Correlation Spectroscopy (tICS) reveals the average temporal dynamics of membrane TRPV1. tICS is a method based on the correlation analysis of fluorescence fluctuations recorded in the presence of a few moving molecules imaged in a micron-size area. The general features of tICS are described at the beginning of the chapter. Then, I report tICS measurements on TRPV1 alone. I demonstrate that, at basal conditions, TRPV1 dynamics comprises two components with rather different membrane diffusion (fast- and slow-moving pools). Depolymerization of microtubules yields a significant fraction of immobile and aggregated receptor. In the last part of the chapter I describe the combined use of tICS and FRET to identify and to characterize the receptor pool that interacts with microtubules. These experiments show that only the slow-moving TRPV1 pool bind to microtubules, at both basal and agonist-stimulated conditions.
• In Chapter 5 the oligomerization degree of membrane TRPV1 is investigated at basal state or under agonist stimulation. In particular, I describe two complementary techniques: fluorescence anisotropy imaging (FAIM) associated to homo-FRET, and fluctuation analysis (Number and Brightness, abbreviated as N&B). The general aspects of both techniques are discussed prior to describe the experimental data. Our results suggest that TRPV1 likely exists in both a dimer, immature, form, and a tetrameric functional form stabilized by intact microtubules. Microtubules
depolymerization leads to significant increase of the oligomerization degree of the receptor (and a concomitant reduction of the efficiency as ion channel).
• In Chapter 6 I present a comprehensive description of TRPV1 dynamics and microtubule/caveolin interactions obtained by Spatio-Temporal Correlation Spectroscopy (STICS). STICS is a fluorescence fluctuation technique that permits to quantify both the diffusion regime and its quantitative aspects. In particular I applied a novel data interpretation approach that has been recently developed at NEST lab: iMSD analysis.
iMSD is suitable for determining diffusion laws of integral membrane
proteins in live cells with high temporal and spatial resolution and no need for the preliminary assumption of a specific interpretative model. At the beginning of the chapter I describe the general aspects of iMSD. Then, I focus on the experimental results obtained by applying iMSD to the imaging of TRPV1. I demonstrate that basal TRPV1 is mainly split into three populations with rather different properties: 1) a fraction binding to caveolin-1 and therefore confined in caveolar structures, 2) a fraction residing in large, raft-enriched membrane patches whose diffusion is actively modulated by microtubules through selective binding, and 3) a fast isotropically-diffusing fraction. Remarkably, the last pool shows a non-negligible correlation between its relative abundance and the cell expression level of the receptor. This feature suggests its identification with an “immature” form of TRPV1 that acts as “reservoir” of the receptor. In light of previous data on endocytic internalization of TRPV1, I interpret the binding of TRPV1 to caveolin-1 as a biological means to trigger long-term desensitization of the receptor via caveolar endocytosis. It is worth noting that the TRPV1 binding to caveolin-1 is reversible with a characteristic binding time of several seconds. Conversely, the complex of TRPV1 with microtubule does not dissociate within one minute and it appears to move within the membrane in rather large patches with 800-900 nm size. This system is characterized by a motion actively driven by microtubule chains. The "guided" diffusion disappears when microtubules are disassembled. These findings support the identification of microtubules as the essential modulators of TRPV1 activity.
Introduction 5
• In Chapter 7 I recast all my data into a model accounting for the molecular interplay among TRPV1, microtubules, and caveolin-1.
• In Appendix A I present the mathematical background of spatio-temporal correlation spectroscopy and iMSD analysis.
• In Appendix B I present a new approach to obtain images of TRPV1 on the cell membrane with spatial resolution below the optical diffraction barrier. This was made possible by the use of a novel photochromic fluorescent protein, EYQ1, which I contributed to develop and study.
Chapter
1
Biological background
1.1 Organization of the plasma membrane and its functional
role
According to the fluid mosaic model proposed by Singer and Nicolson in 1972 (1), the cellular plasma membrane is a two-dimensional liquid where lipid and protein molecules are mixed like a mosaic. Yet, in the last twenty years the fluid mosaic model picture of the membrane bilayer has been seriously challenged by many experiments. For instance, if the Singer–Nicolson model were true, then membrane molecules would always be undergoing simple Brownian diffusion. Several studies, however, continue to uncover evidences showing that this is not the case (2). Additionally, it is recognized that the plasma membrane is a major platform for signal transduction, since it influences how external signals are conveyed into cells’ interior by membrane protein receptors. Here, the fluid mosaic model fails in describing the weak and dynamic association of membrane proteins into complexes involved in signal transduction, as well as their heterogeneous distribution across the bilayer. The failure of the Singer-Nicolson model has led to a more accurate description of cell membrane, which takes into account the spatial heterogeneity of the bilayer.
The size of membrane domains with functional roles spans from 2 to 300 nm. In this spatial scale (usually referred to as mesoscale) the plasma membrane exhibits transient hierarchical dynamic substructures, all forming and disassembling with
various characteristic times. These mesostructures play key roles in modulating signal transduction processes across the membrane. For example, receptor oligomerization is enhanced by membrane compartmentalization, since the formation of transient protein-protein and protein-lipid complexes generates temporary signaling platforms or reaction chambers. This effect is also believed to prime the place where the extracellular signal was originally received (for 1 s to 1 min). Therefore, the comprehension of any molecular signaling process occurring across the plasma membrane requires the description of the heterogeneous structure of the bilayer.
Current knowledge identifies three hierarchically-ordered domains at mesoscale, which are depicted in Fig. 1.1. Starting from the largest one (first tier), the plasma membrane is partitioned into actin membrane-skeleton-induced compartments, with size of 40-300 nm. At the second tier in the hierarchy we find raft domains, with average size of 2-20 nm. Rafts are generated by the affinitiy between lipids and proteins, and their size and composition can be modulated by stimulation of membrane receptors (which are in turn involved in signal transduction and molecular trafficking). Dynamic protein assemblies of 3-10 nm constitute the smallest domains (third tier), although some protein complexes reach few hundred nm, as in the cases of clathrin-coated pits. In the following the main features of each tier are described in some detail.
Organization of plasma membrane and its functional role 9 9
Figure 1.1. Three-tiered hierarchical structure of mesoscale domains in the plasma membrane. (a) Partitioning of the entire plasma membrane by the membrane-associated
actin-based membrane skeleton (fence) and TM proteins anchored to the membrane skeleton fence (pickets). (b) Cholesterol-containing raft domains, with sizes limited by the membrane compartments. (c) Dimers and greater oligomers of membrane associated and integral membrane proteins, which might exist only transiently. (Adapted from (3))
1.1.1 The first tier: actin membrane-skeleton-induced compartments
Membrane compartments of 40–300 nm size are created by the interactions of the bilayer with actin-based membrane skeleton (fence) and transmembrane proteins (TM) anchored to the membrane-skeleton fence (pickets) (Fig. 1.2). In fact, most membrane proteins were demonstrated to undergo short-term confined diffusion within a compartment and long term hop movement between compartments (hop diffusion) (4). This phenomenon is rationalized by the collision of protein cytoplasmic domains with the actin-based membrane skeleton, inducing their temporary confinement or corralling within the membrane skeleton mesh (Fig. 1.2A).
This “membrane skeleton fence” model is integrated with the presence of transmembrane proteins anchored to, and aligned along, the membrane skeleton, thereby acting as rows of pickets against the free diffusion of phospholipids (Fig. 1.2B) (5-7). Notably, the diffusion within any of these compartments (short-range diffusion) is as fast as in artificial lipid membranes. Yet, the hop diffusion between adjacent compartments accounts for the 20-fold decrease in long-range molecular diffusion within plasma membrane as compared to artificial lipid membranes (8).
1.1.2 The second tier: raft domains
The plasma membrane is a mixture of several molecules with differing mutual miscibility. Some of them associate to yield transient complexes, with sizes and lifetimes based on the competition between thermal fluctuations and molecular affinities. These transient associations are enhanced by poor molecular miscibility. For example, cholesterol is not readily miscible with unsaturated alkyl chains, owing to the steric incompatibility between its rigid, bulky tetracyclic sterol backbone and the rigid, mandatorily-bent cis-double bonds of the unsaturated phospholipids (9-12) (Fig. 1.3 a and b,i). Accordingly, small clusters of several cholesterol molecules with lifetimes of 1–100 ns can be observed in unsaturated lipid domains (10,12) (Fig. 1.3c).
In the presence of domains enriched in saturated alkyl chains of glycosylphosphatidylinositol (GPI)-anchored proteins (GPI-AR), glycosphingolipids and sphingomyelin, a segregation process may take place and cholesterol comes off the unsaturated lipid domains to form transient complexes with the saturated alkyl moieties. These domains are called lipid rafts and are characterized by a wide range of characteristic lifetime, owing to the variability of multi-molecular interactions.
Organization of plasma membrane and its functional role 11 11
Figure 1.2 The membrane-skeleton fence model and the anchored TM protein picket model. The left column shows the side view (longitudinal cross-section) of the membrane,
while the right column shows the bottom view (from the cytoplasm, A) and the top view (from outside the cell, B). In the anchored protein picket model (B), the diffusion of molecules around immobilized proteins (red region) is slower, owing to the hydrodynamic-friction-like-effect at the surface of the immobilized protein. This effect could propagate over distances equivalent to multiple diameters of picket proteins. When such diffusion barriers are aligned along the membrane-skeleton fence, they form effective compartment boundaries. (Adapted from (13)).
Each observation method of lipid-rafts is inevitably related to specific time and space scales and can therefore probe only limited subsets of rafts among those actually occurring in the membrane.
Cytoskeleton-induced membrane compartments and raft domains coexist in the plasma membrane (Fig. 1.1). According to the anchored-protein picket model, the
TM protein pickets induce the temporary confinement of phospholipids, GPI-anchored proteins and TM proteins in the mesh. The TM protein pickets exclude cholesterol from the first annulus in the membrane (Fig. 1.3d), owing to the structural incompatibility between the TM protein surface and bulky cholesterol (9,14). Therefore, the upper size limit of raft domains is slightly less than those of membrane compartments segmented by actin cytoskeleton. This limit is particularly relevant from a biological point of view, on account of the raft propensity to coalesce upon extracellular stimulation (e.g. crosslinking of the ganglioside GM1 by the B subunit of cholera toxin (15,16)).
1.1.3 The third tier: dynamic protein complex domains
The third tier comprises dynamic assemblies of membrane proteins. The stoichiometry of these complexes spans from dimers to oligomers, and they associate and dissociate with time constants in the millisecond range. The formation of molecular complexes is facilitated by membrane compartments delimited by fence and pickets. In fact, once two molecules enter the same compartment, they reside there for a long time (1-100 ms) before hop diffusion will displace them apart. This phenomenon increases the frequency of binding encounters. Once formed, also the molecular complex becomes trapped within compartments. Thus, the first tier of membrane organization is tightly coupled to the third tier. A similar mechanism accounts for the coupling between the second and third tiers of membrane organization (2,17,18). Indeed, ligand-induced GPI-AR homodimers can be aggregation nuclei to assemble cholesterol and other saturated lipids. This leads to aggregates or transient heterocomplexes with TM scaffolding proteins, a relevant feature of downstream signaling (19). According to this molecular framework, signal transduction processes are modulated by the interaction of the third tier with rafts and cytoskeleton-induced membrane compartments.
Organization of plasma membrane and its functional role 13 13
Figure 1.3 The mechanism by which raft domains are excluded from compartment boundaries. (a) Chemical structures of cholesterol, a typical saturated phospholipid
distearoylphosphatidylcholine, DSPC), and a typical unsaturated phospholipid (L-α-dioleoylphosphatidylcholine, DOPC). (b) Non-conformability of the rigid ring structure of cholesterol (rectangles) with the rigid, mandatory bend at the C9–C10 cis-double bond in the unsaturated alkyl chain (bent rods, i) and with the rough surface of the TM domain of TM proteins (ii), which generates vacant pockets (packing defects) in the membrane. In (i), three possible configurations placing cholesterol and an unsaturated chain next to each other are indicated, but none shows good packing. The TM proteins with raft affinities are expected to be well miscible with cholesterol. (c) Schematic snapshot drawings of the membrane domains enriched in saturated lipids and cholesterol (i) or unsaturated lipids and cholesterol (ii). Cross-section (top views) of the membrane are also shown. In the top view, open circles represent alkyl chains and solid structures indicate cholesterol molecules (20). Note that cholesterol tends to be segregated out of the domains of unsaturated lipids, forming small clusters of several cholesterol molecules with lifetimes of 1–100 ns, whereas it mixes with saturated lipids, and particularly well at cholesterol:phospholipid molar ratios of 1:1, 1:2 and 1:4. (d) Likewise, cholesterol is excluded from the ‘first annulus’ of the TM domain of the picket protein, owing to the steric incompatibility as shown in (b,i). (e) The majority of raft domains would be contained within a compartment rather than spread across the compartment boundaries, because the compartment boundaries are probably formed by cholesterol-excluding zones (first annular lipids or boundary lipids, shown by diagonal lines) of 1.7–5 nm in diameter (surrounding the TM picket proteins) located 2–11 nm away from each other. (Adapted from (3))
Importantly, signal transduction is finely tuned by the establishment of multi-molecular assemblies in/on the plasma membrane, beside the classical bimulti-molecular collision or interaction of two protein partners (21-23). In this context, much attention is given to the role of coat and scaffolding proteins in signal transduction. Coat proteins such as caveolin-1, and scaffolding proteins such as tubulin, were recognized to modulate subtly the function of several receptors, including some proteins belonging to the TRP family (24,25). Given their relevance in this work, the role of caveolin-1 and tubulin in plasma membrane organization and function are sketched in the next two paragraphs.
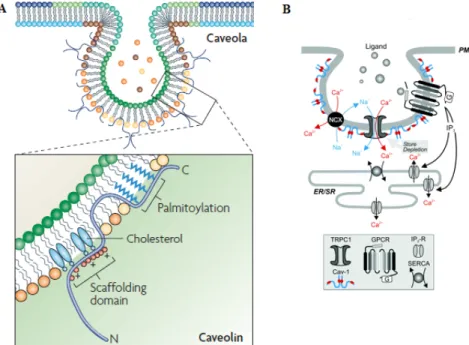
1.1.4 Caveolae as plasma membrane nanodomains
Caveolae are submicroscopic, plasma membrane pits with a size of about 60–80 nm that are abundant in many mammalian cell types. Caveolae are extremely widespread and abundant among several cell type, including smooth-muscle cells, fibroblasts, endothelial cells, and adipocytes. Caveolae were recognized as relevant for endocytosis, transcytosis, calcium signaling, and numerous other signal transduction events (26,27). The main structural features of caveolae are summarized in Fig. 1.4. The integral membrane protein family of caveolins has been the main focus of caveolae research, and caveolins are undisputedly the best markers of caveolae since their discovery (28,29). There are three mammalian caveolins that form caveolae: CAV1, CAV2 and CAV3. CAV1 and CAV2 are generally expressed together in cells other than skeletal muscle, whereas CAV3 is predominantly expressed in striated muscle. The fundamental role of caveolins in driving membrane curvature of caveolar vesicles was shown by their expression in prokaryotic hosts lacking any intracellular membrane systems (30). Furthermore, caveolins reside in regions of the membrane whose lipid composition is similar to membrane rafts. The relative amount of cholesterol in caveolae may be more than 100 times higher than the bilayer average, reaching as much as 20,000 molecules in immuno-isolated caveolae (31). Some glycosphingolipids (for example, GM1 and GM3) and sphingomyelin are also enriched in caveolae as compared to the bulk plasma membrane.
Several receptor proteins, including G protein-coupled receptors (GPCRs) and ion channels belonging to the TRP family are known to coexist with caveolin in caveolae (32-34). Indeed, one of the most important roles of caveolae is to colocalize receptors and effectors within microdomains (35,36). The second
Organization of plasma membrane and its functional role 15 15
important role of caveolae is the internalization via endocytosis, although many issues are still controversial in this field (37-39).
Electron microscopy revealed complex interactions between caveolae and the cytoskeleton (40). Microtubules promote trafficking of caveolae forth and back from the cell surface. This is thought to occur through local stabilization of microtubules by β1 integrins and integrin-linked kinase (ILK) signaling (41).
Figure 1.4 Caveolae and caveolins. (A) Caveolin-1 is inserted into the caveolar membrane,
with the N and C termini facing the cytoplasm and a putative ‘hairpin’ intramembrane domain embedded within the membrane bilayer. The scaffolding domain, a highly conserved region of caveolin, might have a role in cholesterol interactions through conserved basic (+) and bulky hydrophobic residues (red circles). The C-terminal domain, which is close to the intramembrane domain, is modified by palmitoyl groups that insert into the lipid bilayer. (B) Schematic diagram depicting the caveolin-1 and some receptor and ion channel participating in caveolae protein complex formation. (Adapted from (38))
1.1.5 Tubulin and microtubules as modulators of membrane and membrane receptors
Tubulin is an abundant, hydrophilic, heterodimeric protein that is present in all eukaryotes. It is the chief component of microtubules, ciliary axonemes, basal bodies, and centrioles. The bulk of tubulin consists of a dimeric assembly of two similar but not identical subunits, α- and β- tubulin. αβ-tubulin heterodimers are protein scaffolds of about 4.6 nm × 8.0 nm × 6.5 nm size (42). The head-to-tail association (“polymerization”) of the αβ-tubulin heterodimers yields microtubule protofilament. A single microtubule comprises 10–15 protofilaments, each one made of dimers that associate laterally to form a 24 nm wide hollow cylinder (43). The lateral interaction between subunits of adjacent protofilaments was described as a B-type lattice with a seam (long arrow, Fig. 1.5A). A third tubulin isoform, γ-tubulin, is the template for the correct assembly of microtubules (43).
Microtubules undergo cycles of rapid growth and disassembly. This is known as dynamic instability and was observed both in vitro and in vivo (44,45). Individual microtubules do not reach a steady-state length, but exist in either polymerization (growth) or depolymerization (shrinkage) states. Notably, the two ends of each microtubule chain are characterized by two different growing/disassembly rates. This non-equilibrium state depends on the binding of GTP at the nucleotide exchangeable site (E site) on β-tubulin during polymerization. The polymerization dynamics of microtubules is central to their biological function: (a) microtubules can rapidly reorganize in order to differentiate spatially and temporally in accordance with the cell context (46), and (b) pushing and pulling forces are established during polymerization and depolymerization, respectively (47).
The interaction of tubulin with biological membranes has been investigated since the pioneeristic study of Blitz and Fine forty years ago (48). Tubulin can bind directly to membrane lipids, and is called in this case “membrane tubulin”. The interaction between the microtubules and the plasma membrane was also confirmed by electron microscopy studies (49). The apparent affinity constant measured for tubulin-membrane interaction is 1.5-3.0 x 10⁷ M-1 (by observing the tubulin-binding affinity of erythrocyte membranes known to be devoid of membrane tubulin (50)). This implies that tubulin interaction with the membrane can be observed at physiological concentrations within cells. This affinity constant is much lower than concentration of tubulin dimers able to trigger polymerization. Additionally, the direct interaction of tubulin and/or microtubules with several trans-membrane
Organization of plasma membrane and its functional role 17 17
proteins such as ion channels and G-protein coupled receptors (51) was repeatedly assessed. These findings led to the qualitative concept of sub-membranous microtubule cytoskeleton. Yet, no general features of tubulin-mediated receptor function have been highlighted insofar.
Figure 1.5. Microtubules dynamics. (A) Structure of microtubules. (B) Cycle of
polymerization and depolymerization of microtubules. (Adapted from (43))
1.2 Membrane-modulated neurotransmitter signaling:
Transient Receptor Potential Vanilloid 1 (TRPV1)
Recently, several studies highlighted the pivotal role of membrane heterogeneity for signal transduction in neurons and other cells of the nervous system (52). Coherently with the new hierarchical vision of membrane structure, the most recent models of neurotransmission attribute great relevance to the arrangement of
signaling molecules in nanodomains to either increase or dampen signaling. In this context, some of the most interesting results concern the interplay between lipid rafts, coat proteins such caveolins, and cytoskeletal components. This interaction is relevant since, in several cases, neurotransmitter signaling is associated with cytoskeletal modification (52). This effect provides a feedback to finely tune the signaling response, besides affecting the global cell morphology. Actually, tubulin and microtubules were early recognized as dynamic partners of many neurotransmitters and they are thought to help sequestering and anchoring specific neurosignaling proteins in raft domains (53-55).
The regulating role of membrane heterogeneity appears particularly intriguing when receptors that integrate a large number of stimuli come into play. In this context, the components of the Transient Receptor Potential (TRP) cation channel family are among the most interesting examples of signal integrators that may be modulated by membrane features. Beside voltage, TRP channels are activated by a wide range of stimuli including intra- and extracellular ligands, temperature, and osmotic stress (56). Membrane state, composition, and compartmentalization were demonstrated to influence the gating behavior of several TRP channels (57). Some members of the TRP family form signal complexes in lipid rafts (32). TRPC1 (transient receptor potential channel 1) is regulated by caveolin-1, and caveolae account for its exocytic trafficking on plasma membrane(58). Phosphatidylinositol 4,5-bisphosphate (PIP2), a lipid found mostly in raft regions (59), is believed to regulate strongly the activation and de-sensitation of many components of the TRP family (60).
Intriguingly, little is known on the interplay between membrane features and the Transient Receptor Potential Vanilloid 1 (TRPV1), also known as the capsaicin receptor. TRPV1 is a nonselective voltage-dependent cation channel (with preference for Ca2+) that is expressed in sensory neurons and in many other cell types (e.g. endothelial cells) (61,62). Many studies highlighted TRPV1 as a pivotal protein for signal transduction in neurons (63-66), with a specific role in pain signaling (nociception) (67). TRPV1 integrates several stimuli, including: pH, heat, capsaicin or its analogs, and a variety of lipid metabolites such as anandamide, lipoxygenase products and dopamine derivative (68). TRPV1 function is also augmented by phosphorylation via protein kinase C downstream of PIP2 hydrolysis and diacylglycerol formation (69). Notably, the molecular framework overseeing the modulation of TRPV1 function represents a hot topic in biology and biomedicine. In fact, sensitization of TRPV1 during chronic pain is associated to the transduction of
Membrane-modulated neurotransmitter signaling: TRPV1 19
noxious signaling, and consequently the search for novel anti-pain therapeutics addressing TRPV1 is intense. A recent study pointed out that TRPV1 might be active only if localized in cholesterol-rich domains of the membrane, presumably rafts (70). The connection with rafts was supported by the inhibition of the opening properties of TRPV1 by sphingomyelin or gangliosides. Cholesterol depletion by incubation with methyl-β-cyclodextrin (MβCD) led to significant decrease of the capsaicin-evoked response (70,71). In addition, TRPV1 was found to contain a cholesterol-binding site in its membrane-embedded chain (72). Parallel researches highlighted the role of TRPV1 in microtubule remodeling, suggesting the presence of one microtubule-binding site along the receptor sequence (73,74). Yet, no comprehensive picture of the relationships between TRPV1 caveolins/rafts or tubulin is available. TRPV1 stands, therefore, as a perfect model of protein signal integrator to unveil its subtle modulation by membrane determinants.
1.2.1 Structure of TRP
Similarly to voltage-gated K+ channels (Kv), TRPV1 structure comprises six transmembrane sections (1–6), with both the N- and C-termini on the cytosolic side of the cell membrane (75) and a short, pore-forming hydrophobic region between transmembrane section 5 and 6 (Fig. 1.6). Notably, the N- and C-termini of TRPV1 include “ankyrin” repeats (76) and the ‘oligomerization domain’ (77), respectively.
Figure 1.6. A cartoon representation of a single TRPV1 protein, highlighting the six transmembrane domains (Adapted from (78))
Single-particle electron cryo-microscopy suggested that TRPV1 assembles into a tetrameric complex in reconstructed unilamellar vesicles devoid of native lipid rafts (79). This finding is consistent with the biochemical studies in living cells that demonstrated a tetrameric stoichiometry for functional TRPV1 (80-82). The 3D structure of TRPV1 is 150 Å tall and consists of a smaller domain (~60 Å width and 40 Å height) embedded into the lipid bilayer, together with an intracellular larger domain that forms a basket-like structure (often referred to as “hanging gondola”). Within the TRPV1 tetramer, cryo-microscopy clearly identifies two major channel regions with respect to the membrane (Fig. 1.7).
Figure 1.7. The proposed location of the 3D structure of TRPV1 in the plasma membrane. A vertical cut-away view shows the internal mass distribution of the protein.
(Adapted from (79))
1.2.2 Function: agonists
TRPV1 integrates a number of physical and molecular stimuli. Beside voltage, modulators of TRPV1 activity include: temperature (83), pH (84) capsaicin and capsaicin analogues (Fig. 1.8) (85).
Membrane-modulated neurotransmitter signaling: TRPV1 21
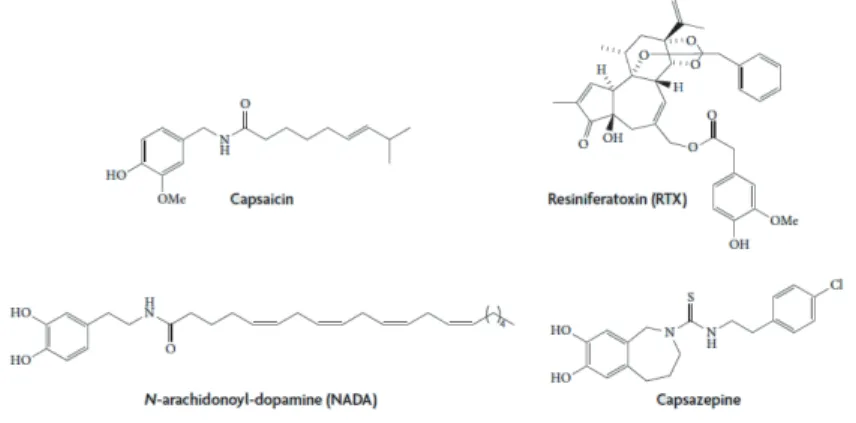
Figure 1.8. Chemical structures of selected TRPV1 ligands. Capsaicin, the pungent
ingredient in hot-chilli peppers; resiniferatoxin, a powerful capsaicin analogue isolated from the cactus-like plant Euphorbia resinifera Berg; N-arachidonoyl-dopamine, an endogenous lipid mediator in brain nuclei; capsazepine the first generation of TRPV1 antagonist,. (Adapted from (86))
Resiniferatoxin (RTX, Fig. 1.8) is a strong TRPV1 agonist isolated from the latex of the perennial Euphorbia resinifera Berg (87). A recent model of TRPV1 structure and function proposes a “paddle structure” in which the transmembrane 3 and 4 regions form a gating paddle, and residues such as 547 constitute an intracellular vanilloid-binding site (88). Figure 1.9 shows a simulation of RTX and capsaicin bound to TRPV1 in the binding cleft (85). Significantly, activation of TRPV1 leads to an increase in the relative permeability to large cations and Ca2+ in dependence of time and agonist concentration. Using the substituted cysteine accessibility method, these changes were attributed to alterations in the TRPV1 selectivity filter. Thus, TRPV1 permeability characteristics are not static, at odds with most ion channels (89).
The dependence of TRPV1 from temperature is particularly interesting. TRPV1 is activated upon depolarization, and changes in temperature result in graded shifts of its voltage-dependent activation curve. Above 42 °C the receptor is mostly activated at resting membrane potential. This thermal sensitivity guarantees prompt cellular response to noxious heat (83). Kinetic analysis of gating at different temperatures indicates that temperature sensitivity in TRPV1 arises from a tenfold difference in the activation energies associated with voltage-dependent opening and closing (90). Chemical agonists of TRPV1 work as gating modifiers that potentiate the thermal
response. Two possible mechanisms for temperature-dependent channel gating may be envisaged on the basis of available data. The channel protein may undergo temperature-dependent structural rearrangements, thereby facilitating channel opening, or, alternatively, TRPV1 may be able to sense changes in membrane tension due to temperature-dependent lipid bilayer rearrangements. In absence of agonists, at 37 °C and at a membrane potential of -70 mV (typical of the resting state of CHO cells), only a minor fraction of TRPV1 (~ 15%) is in the open form (90), consistently with a thermal activation at around 42°C (91).
1.2.3 Function: antagonists and desensitization
TRPV1 antagonists fall into two categories: class A antagonists, which block the effects of both capsaicin and protons, and class B compounds, which are more selective for capsaicin, such as capsazepine 49 (Fig. 1.8). Notably, TRPV1 exhibits agonist-induced (acute and tachyphylactic) channel desensitization that should be distinguished from de-functionalization of the whole neuron by TRPV1 antagonists. This enables the neuron to adapt to specific stimuli by diminishing its overall response to a sustained chemical or physical signal (92).
Membrane-modulated neurotransmitter signaling: TRPV1 23
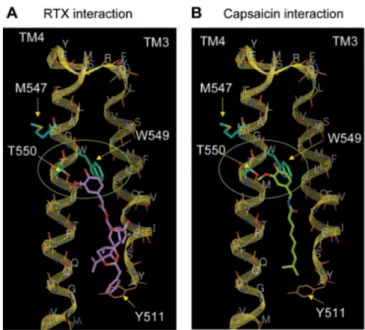
Figure 1.9. Structural model of RTX (A) and capsaicin (B) interacting with transmembrane helices TM3 and TM4 of TRPV1. The backbone of the complete structural
model along with the side chains of residues considered to be involved in interactions is shown. The side chains of Met547, Trp549, and Thr550 are shown as sticks (thick lines). Specific interactions of vanillyl moiety with Thr550 and Trp549 are highlighted in the green
ellipses. Residues considered being involved in interactions with the substituted phenyl
portions of the two ligands are shown in cyan. Modeled hydrophobic contacts of Tyr511 with the hydrophobic ends of RTX and capsaicin are shown. RTX and capsaicin are displayed in
pink (A) and green (B), respectively.
Several authors highlighted how agonist-induced TRPV1 desensitization is related to the increase of intracellular Ca2+, which in turn activates calcineurin and leads to de-phosphorylation of TRPV1 (93). Thus, the role of TRPV1 phosphorylation and de-phosphorylation is pivotal to the biological function of the receptor. It is accepted that TRPV1 can be phosphorylated by several kinases, including PKA, PKC, Ca2+/CaM-dependent kinase II (CaMKII) or Src kinase (94).
Reversal of capsaicin-induced desensitization of TRPV1 is regulated by PKC in both sensory neurons and heterologous expression systems (93). TRPV1 has two putative phosphorylation sites: S502 and S800. S502 is a non-specific substrate for TRPV1 phosphorylation by kinases like PKC, PKA or CAMKII, whereas S800 is a specific substrate of PKC. Importantly, S800 is located in the cytoplasmic
C-terminus of TRPV1 where several regulatory motifs of the receptor can also be found. PKC-dependent phosphorylation of Ser800 was demonstrated to potentiate agonist-evoked changes in channel permeability (94)
Chapter
2
Fluorescence imaging tools
2.1 Optical sectioning in fluorescence microscopy
2.1.1 Confocal laser scanning fluorescence microscopy
Conventional wide-field, epi-fluorescence microscopy offers sub-micrometer spatial resolution and excellent temporal resolution (down to a few ms) for the observation of biological structures and molecular dynamics in live cells. Epi-fluorescence microscopes, however, do not have any element other than the objective to discriminate between focal plane signal and background fluorescence originating from out-of-focal plane fluorophores. This results in a rather blurry image when 3D objects, for example cells, are observed (95). This issue was solved by the advent of confocal microscopy. In confocal fluorescence microscopy, single spot illumination is used while spatially scanning the sample; placing a “pinhole” before the detector at a conjugate plane to the illumination focal plane effectively rejects out-of-focal fluorescence. A simple schematic of an optical path in a fluorescence confocal microscope demostrating this concept is shown in Fig. 2.1. Notably, in most applications of confocal microscopy the sample is scanned across point-by-point by using a spatially-modulated laser beam (i.e. in a raster fashion):
these systems are referred to as Confocal Laser Scanning fluorescence Microscopes (CLSMs).
Figure 2.1. A schematic representation of the optical path in a point scanning confocal fluorescence microscope. The collimated excitation beam (solid blue) is directed to the
microscope objective by a dichroic mirror and focused onto the sample. The fluorescence signal (dashed blue) emanating from the sample in focus is collected by the same objective and imaged through a pinhole onto a detector. The off-focal plane signal (dashed red and green) is rejected by the pinhole. Adapted from (95)
The sectioning capability of confocal microscopy yields an improved axial resolution over alternative strategies. Resolution here refers to the minimum distance between distinguishable objects in an image. Resolution is set by the spatial distribution of the light intensity generated and collected by the objective, which is called Point Spread Function (PSF). The image of any object is the convolution of the spatial feature of the object itself S(x,y,z) with the PSF
).
,
,
(
)
,
,
(
)
,
,
(
x
y
z
S
x
y
z
PSF
x
y
z
I
=
⊗
[2.1]Optical sectioning in fluorescence microscopy 27
The PSF in confocal systems is usually well approximated by a 3D Gaussian distribution (96):
(
, ,)
exp 2 exp 2 , 2 2 2 2 2 0 ⎟⎟ ⎠ ⎞ ⎜ ⎜ ⎝ ⎛ − ⋅ ⎟⎟ ⎟ ⎠ ⎞ ⎜⎜ ⎜ ⎝ ⎛ + − = z xy z y x I z y x PSFσ
σ
[2.2] whereσ
2xy and 2 zσ are known as the radial and axial resolutions of the optical
setup, respectively, and I0 is the maximum light intensity at focal point. It can be
show that:
,
43
.
0
NA
ex xyλ
σ
=
⋅
[2.3],
75
.
0
2 2NA
n
n
ex z−
−
⋅
=
λ
σ
[2.4]where n is the refraction index of the objective lens and λex is the excitation
wavelength. For a typical case such as λex = 488 nm, NA=1.2, n=1.33 (water
immersion objective), we have
σ
xy=175nm andσ
z=
483
nm
. In some cases, theFull Width at Half Maximum (FWHM) of the PSF is the parameter of interest; these relationships hold for a Gaussian PSF:
,
)
2
ln(
2
⋅
=
xy xyFWHM
σ
[2.5] . ) 2 ln( 2 ⋅ = z z FWHMσ
[2.6]2.1.2 Total internal reflection microscopy
Light propagating through a transparent medium will undergo total internal reflection (TIR) when it hits, at an angle greater than a critical value (θc), the interface with a second medium with a lower refraction index. Whenever TIR occurs, an evanescent field (EF) is generated at the interface and decays
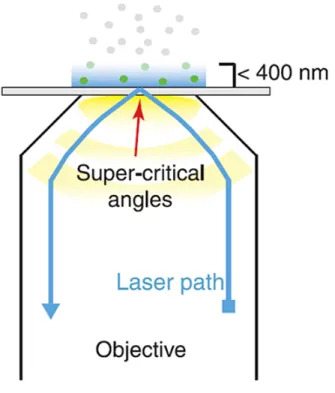
exponentially into the second medium (97). This EF can be used to excite selectively fluorophores within a distance of a few hundred nanometers from the interface, rejecting concomitantly the out-of-focus fluorescence background. This is the underlying principle of Total Internal Reflection Fluorescence Microscopy (TIRFM). In modern TIRFM setups, the EF is obtained by passing the excitation light through an objective lens with a very high refractive index (1.4-1.5) as compared to water (the main component of the biological sample). To ensure total reflection at the objective-water interface, only a small annulus in the objective aperture plane is illuminated, yielding excitation beams that hit at the interface with angles > θc (Figure 2.2) (98). On account of its high axial sectioning capability (100-250 nm), TIRFM has excelled in the study of cellular organization and dynamic processes within or close to the cellular plasma membrane. Notably, in TIRFM the laser beam is not scanned across the sample but all the points are excited simultaneously, allowing for the use of highly-sensitive CCD detectors (e.g. Electron Multiplied CCD).
2.2 Genetically-encoded fluorescent probes for live cell
imaging: autofluorescent proteins
The discovery of a fluorescent protein taking part in the bioluminescence system of jellyfish Aequorea Victoria dates back the early 60s (99). This protein was named Green Fluorescent Protein from its bright green fluorescence obtained by UV-blue light excitation; hereafter it will be simply referred to as wild-type GFP or wtGFP, in keeping with the scientific nomenclature in use. Thirty years later, with the cloning of the gene (100) and the demonstration that its expression in other organisms still produces fluorescence (101,102), the interest in wtGFP started to rise dramatically and eventually led to a revolution in fluorescence microscopy bioimaging (103). In the same years, many other fluorescent and non-fluorescent GFP homologues were discovered in a variety of organisms (104,105). Additionally, protein engineering by sequence mutagenesis has produced several Fluorescent Proteins (FPs) with optical properties spanning almost all regions of the visible spectrum (106).
Genetically-encoded fluorescent probes for live cell imaging: autofluorescent proteins 29
Figure 2.2. TIRFM configuration. Scheme of objective-based TIRFM. For description, see
text. Adapted from (95)
The singular success of FPs in fluorescence microscopy owes to the genetic encoding of fluorescence that does not require any additional cofactor (eg. enzymes) from the host organism. This allows for the expression of any fluorescent chimera in living cells. FPs do not usually perturb the biological processes of the target protein. Hence, FPs represent a nearly perfect bio-nanodevice to unveil cell mechanisms at the molecular level (107-109).
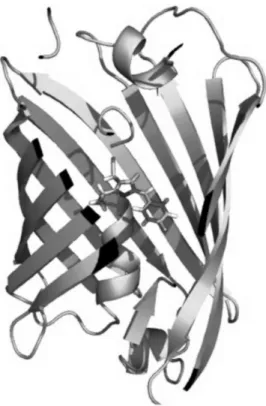
wtGFP is constituted by a peptide chain of 238 aminoacids and 27 kDa molecular weight (103). X-ray spectroscopy displayed that this sequence folds in a compact cylindrical three-dimensional structure (referred to as β-barrel, Fig. 2.3), laterally-enclosed by 11-stranded β-sheet, and with a base diameter of 24 Å and a height of 42 Å (110). Remarkably, all FPs share thus β-barrel fold, regardless of the degree of
homology of their primary sequences (107). Differences can be found in quaternary structure, since several natural FPs arrange as tightly bound tetramers or dimers, a feature that initially hampered their applications. Primary sequence mutagenesis was applied to reverse association and yield monomeric variants of the parent proteins (111).
Figure 2.3.3D structure of wtGFP from X-ray analysis The frontal part of the barrel is
removed to show the protein chromophore buried at the center of the tertiary structure. Adapted from (110).
In wtGFP, the chromophore (Chrom) is a 4-(p-hydroxybenzylidene) imidazolinone. Structurally, Chrom is constituted by two conjugated aromatic rings, one being a six-member aromatic phenol and the other being a five-member imidazolidinone (Fig. 2.4) (103). The alternating single and double bonds in the bridge region of Chrom extend the electron delocalization from the phenolate to the
Genetically-encoded fluorescent probes for live cell imaging: autofluorescent proteins 31
carbonyl of the imidazolinone. Accordingly, efficient visible-light absorption takes place due to this π-conjugated system. Chrom originates from the post-translational autocatalytic modification of three consecutive aminoacids: Ser65-Tyr66-Gly67 (112,113) (Fig. 2.4). Several FPs share the Chrom structure of wtGFP. Instead, Red Fluorescent Proteins (RFPs) are characterized by further post-translational processing of the chromophore that leads to more extended electron conjugation.
Figure 2.4. Formation of wtGFP chromophore. The cyclization-oxidation-dehydratation
post-translational processing of the aminoacid triplet Ser65-Tyr66-Gly67. Adapted from (114)
For all FPs sharing the wtGFP Chrom, the phenol group can exist either as neutral (protonated phenol) or anionic (deprotonated phenol). The absorption of the neutral form (A state) is always significantly blue-shifted with respect to the anionic form
(B state): indeed, in wtGFP A peaks at 398 nm, whereas B peaks at 475 nm (Fig.
2.5). The A/B population ratio is around 6/1, and it is nearly unaffected by changes of proton concentration in the 5-11 pH range (115). This rather unexpected phenomenon was explained by means of the presence of a second ionizable residue near the chromophore, namely Glu222, which buffers the chromophore ionization (116).
Figure 2.5. Optical properties of wtGFP
.
Normalized absorption (black line) and emission of state A (blue line) excited at 405 nm (dashed blue line) and emission of state B (green line) excited at 488 nm (dashed green line).Fluorescence emission of wtGFP was extensively studied at very high temporal resolution (117,118). The rigid β-barrel structure is responsible for the significant protein fluorescence emission. In wtGFP ΦΑ≈ΦΒ=0.78 (119,120). Photon absorption
by B leads to excited state B* that has a single emission channel at 503 nm. Conversely, upon excitation of A two competing photoprocesses leading to emission are triggered: i) direct emission from A* (at 440-480 nm) and ii) Excited State Proton Transfer (ESPT) from A* to Glu222 through a proton wire of H-bonds involving one water molecules and Ser205 (117,118,121) eventually leading to 507 nm emission. ESPT takes place in a few picoseconds on account of the strongly increased acidity of the phenol group (122), and it represents a much more efficient depletion channel of A* than direct fluorescence emission (123). Many other GFP variants share these photophysical properties.
Genetically-encoded fluorescent probes for live cell imaging: autofluorescent proteins 33
Five main families of FPs can be identified: blue (BFPs), cyan (CFPs), green (GFPs), yellow (YFPs), and red emitting (RFPs). In the following, I shall briefly describe the properties of GFPs, YFPs, and RFPs because FPs belong to these families were employed in this work.
GFPs. The proteins belonging to this class have optical properties similar to those displayed by wtGFP, although in most cases only the bright anionic form of the chromophore is optically active. Indeed, the most popular green variant, Enhanced Green Fluorescent Protein (F64L/S65T GFP or EGFP) owes its high brightness to a predominantly anionic tyrosin-based Chrom (Y-Chrom) above pH 6 (116,124). In several GFPs (e.g. EGFP), the change of the external pH enables the reversible population shift from the neutral to the anionic states of the chromophore; this phenomenon is associated with a pH-titration curve clearly observable both in absorption and in fluorescence(125).
YFPs. YFPs share an aromatic moiety (from Tyr, Phe, or His) π-stacked to GFP Chrom. In this configuration, the excitation and emission energies of Chrom are reduced by increasing the polarizability of the environment around the chromophore (126). Best results were obtained with T203Y GFPs. Variants EYFP (S65G/V68L/T203Y GFP) and 10C (S72A EYFP) display possibly the highest extinction coefficients (> 75,000 M-1cm-1), emission quantum yields (Φ > 0.8), and fluorescence lifetimes (τ > 3 ns) that can be found in FPs. In most cases, YFPs show pH-dependent absorption and fluorescence response, owing to chromophore ionization. Additionally, the fluorescence of many YFPs is quenched by chloride ion, on account of a binding equilibrium with dissociation constant > 10 µM at physiological pH (127-131).
RFPs. As already stated, the strong red-shift of RFPs compared to wtGFP is mainly attributable to the enlargement of the π-conjugated system by the additional double bond. Representative RFPs display absorption shifts from +71 to +133 nm, and emission shifts from +54 to +142 nm, compared to the B state (anionic) of wtGFP (Table 1). Additionally, the anionic chromophore is the prevalent form in the 5-9 pH range. Interestingly, many RFPs display deviation from coplanarity of the two aromatic rings in the protein chromophore, resulting in a reduced quantum yield of fluorescence. As an example, the widely-used mCherry variant is characterized by a particularly distorted chromophore and a rather low fluorescence quantum yield (0.22) (109). For high-sensitivity imaging, a much better choice is represented by TagRFP, a monomeric red (orange) fluorescent protein generated from the wild-type RFP from sea anemone Entacmaea
quadricolor (132). It possesses bright fluorescence (Φ=0.66 (133)) with
excitation/emission maxima at 555 and 584 nm, respectively. .
Chapter
3
Binding interactions of TRPV1 in living cells
Recent literature data highlighted that, besides acting as a ligand-gated voltage-dependent ion channel, the TRPV1 receptor could participate to a complex network of binding interactions at cell membrane level. For instance, colocalization measurements in fixed cells suggested that microtubules could represent binding partners of TRPV1. The relevance of this interaction stems from the observed disassembly of microtubules, and possible cytoskeletal remodeling, upon receptor activation. Additionally, the clathrin-independent endocytotic mechanism that underlines the TRPV1 long-term desensitization evokes the binding interaction of the receptor with biomolecules involved in vesicular trafficking.
In this chapter we demonstrate for the first time in living cells that the TRPV1 receptor effectively binds to both microtubules and caveolin-1, the latter being the molecular hallmark of caveolar internalization mechanism. Notably, our results are based on Fluorescence (Förster) Resonance Energy Transfer (FRET) measurements. Indeed, FRET is among the most efficient techniques to reveal biomolecular complexes in living cells. For this reason, section 3.1 is devoted to a comprehensive description of FRET imaging. Sections 3.2 and 3.3 report on the interaction between TRPV1 and integer microtubules and caveolin-1, respectively. The experimental procedures are described in section 3.4.
3.1 Imaging biomolecular interactions: Fluorescence (Förster)
Resonance Energy Transfer (FRET)
3.1.1 General description
Fluorescence (Förster) Resonance Energy Transfer (FRET) is a spectroscopic technique easily implementable in fluorescence microscopy that is ideally suited to study biomolecular interactions in solution, live cells, and tissues (134). FRET is based on the non-radiative transfer of energy from an excited molecular fluorophore (donor, D) to a chromophore (acceptor, A) via long-range dipole-dipole coupling (135). A necessary condition for FRET is the partial overlap of the emission spectrum of D with the absorption spectrum of A, to ensure conservation of energy in the non-radiative exchange process (Fig. 3.1).
Figure 3.1. FRET mechanism. (A) Illustration of the overlap between the emission spectrum
of the donor and the absorption of the acceptor. (B). Energy level scheme of donor and acceptor molecules showing the coupled transitions in the case where vibrational relaxation is faster than energy transfer (very weak coupling).