isotopic signatures during 2012
Emilia seismic sequence
Alessandra Sciarra
1,2,3, Barbara Cantucci
1& Massimo Coltorti
2Soil surveys were performed in Medolla (Italy), a peculiar area characterized by spotty high soil temperature, gas vent, and lack of vegetation, to determine the migration mechanisms and spatial behavior of gas species. Hereby we present soil gas measurements and their isotopic ratios measured between 2008 and 2015, including the 2012 Emilia-Romagna seismic sequence. We found that soil gas concentrations markedly changed during the main shocks of May 20 and 29, 2012 (Mw 6.1 and 6.0, respectively), highlighting the presence of a buried fault intersecting the gas vents. We suggest that crustal dilation associated with seismic activity favored the uprising of geogas towards the surface. Changes in the isotopic signature highlight the contribution of two distinct sources, one deeper, thermogenic and another superficial related to organic-rich layer, whose relative contribution varied before, during and after the earthquake. We suppose an increase of microbial component likely due to the ground shaking of shallower layers linked to seismic sequence, which masks the thermogenic contribution. Although the changes we detect are specific for an alluvial plain, we deduce that
analogous processes may be active elsewhere, and that soil gas geochemistry represents an useful tool to discriminate the gas migration related to seismic activity.
Soil gas geochemistry in seismically active areas has been widely used to localize buried faults and co-seismic fractures1–5. The stress/strain changes related to seismic activity may in fact force crustal fluid to migrate upward, especially along active faults, thus altering the geochemical spatial distribution of the soil gas6,7.
Most soil gas surveys, however, are typically carried out after the main earthquake event/s, precluding the possibility to evaluate the stress/strain effect on gas species before and after the event. Only a little information is thus available on fluid activity and circulation during a pre-seismic period.
Hereby we present 37 soil gas concentrations (CO2, CH4, H2, He, Ne, C2H6, 222Rn) together with the isotopic
ratios of CH4 and CO2 (δ13C-CH4, δ13C-CO2, δD-CH4) that were periodically measured in the period 2008–2015
and immediately after the 2012 Emilia seismic sequences.
Measurements were performed near Medolla (a small municipality in the Emilia-Romagna Region, Italy; Fig. 1a), in a farming area less than 1 km2 wide, where the presence of a remarkably high temperature of the
soils (up to 48.5 °C) associated with methane seepage, has been known since 18938. In some cases, this seepage phenomenon is highlighted by the occurrence of several subcircular areas (<10 m in diameter) where crops and vegetation are unable to grow (Fig. 1b,c) and during wintertime as the snow cover quickly melts. The location of the main macroseep area has remained relatively stable over the past 120 years, although with different intensity.
Recent studies9,10 suggested that the anomalous ground heating is not linked with local ascents of hot fluids from depth, but could be the result of exothermic oxidation of shallow (<1m) biogenic methane (δ13C-CH
4
rang-ing from −62.5‰ to −72.3‰ VPDB), enhanced by the activity of methanotrophic bacteria11.
The investigated site lies on the top of the central portion of the Ferrara arc (Fig. 1a), which represents the external fold-and-thrust system of the Northern Apennines thrust belt. The Ferrara arc consists of two major blind thrust systems, the Ferrara Thrust System to the northeast and the Mirandola Thrust System to the west, and contains a thick and folded sedimentary succession mainly made up of Triassic evaporites, Jurassic-Cretaceous carbonates and Oligocene-Miocene clastic deposits covered by Plio-Pleistocene sandy turbidites and Late
1Istituto Nazionale di Geofisica e Vulcanologia, sezione di Sismologia e Tettonofisica, via di Vigna Murata 605, 00143,
Rome, Italy. 2Department of Physics and Earth Sciences University of Ferrara, Via Saragat 1, 44122, Ferrara, Italy. 3Consiglio Nazionale delle Ricerche – Istituto di Geologia Ambientale e Geoingegneria, Rome, Italy. Correspondence
and requests for materials should be addressed to A.S. (email: [email protected]) Received: 16 June 2017
Accepted: 11 October 2017 Published: xx xx xxxx
Quaternary fluvio-lacustrine deposits of the Po plain12,13. This sector of the buried Apennine front is tectonically active in response to the general compressive stress field14 dating from middle Pleistocene.
In the Medolla area, natural gas (CH4-dominated) reservoirs have been detected at depths between 2000 and
2700 m, in correspondence of reverse fault planes15 from which fluids migrate upward along minor fault planes. At these depths, the main stratigraphic unit consists of upper Miocene marls and organic-rich clays15. Moreover, some other CH4-dominated gas occurrences are recognized at 200 m and between 650 and 900 m of depth in
the Plio-Pleistocene formations16. According to Lindquist16 and Mattavelli and Novelli17 most of the gaseous hydrocarbons in the Po Plain have a biogenic origin (80%), while the remaining is equally distributed between thermogenic (10%) and mixed origin (10%).
In May-June 2012, a seismic sequence struck the Emilia-Romagna Region, with more than 2,400 aftershocks. The epicenters of the two main shocks, Mw 6.1 and 6.018 were located 15 and 2 km from the study area, respec-tively (Fig. 1a).
Results
The soil gas surveys were carried out in October 2008, December 2008, soon after the first main-shock, in September 2012 and in the following years (2013, 2014 e 2015), aiming at monitoring any variations in the gas chemistry, as well as in the seepage spatial distribution. Several gas species (CO2, CH4, H2, He, Ne, C2H6, 222Rn)
were determined, but in the following only CO2, H2 and CH4 measurements are reported, since they are the only
gases where isotopic ratios were also analyzed.
Collected data were processed with a standard statistical approach (Supplementary Table S1) and used to create three-dimensional surface maps (Fig. 2).
Normal Probability Plot (NPP) were used to select background, anomalous values, and extra outliers19. In particular values above 2.00% v/v for CO2, 1.8 ppm v/v for H2 and 0.10% v/v for CH4 have been considered as
“anomalies”.
In October 2008 the investigated area was characterized by CO2, H2 and CH4 concentrations with average
values of 0.13% v/v, 1.63 ppm v/v and 3.6 × 10⁻³% v/v, respectively. If compared with the data collected in 2006, 7
km southeastward from Medolla20, gas emissions exhibited much higher values of CH and H, whereas CO was
Figure 1. (a) Seismotectonic framework of the study area. Solid black lines represent the major active thrust faults of the area18,36. The orange circles are the relocated aftershocks of the first year after the two main shocks37, while the green circles are 3-D relocated aftershocks of the first month of the sequence18 [this figure has been constructed using Esri ArcGIS ArcMap 10.2.1 http://www.esri.com/software/arcgis/arcgisfor-desktop for Desktop]. (b) Satellite imagery of the study area with evidence of M20, M3, and M14 macroseeps [basemap was obtained from Esri ArcGIS ArcMap 10.2.1]. (c) Landscape picture showing extension of a macroseep, delineated by the absence of vegetation.
more than one order of magnitude lower (CO2, 2.31% v/v; H2, 0.44 ppm v/v; CH4, 6.01 × 10⁻⁴% v/v). The highest
CH4 concentrations were measured in two areas with the absence of vegetation (0.048% v/v at M20 and 0.024%
v/v at M3). It is likely that these macroseeps represent preferential migration pathways for deep gas hosted in the Mesozoic formations (>3000 m depth; Camurana 2 well log), as suggested by the δ13C-CH
4 measured on these
points showing thermogenic values of −25.88 and −29.68‰. Soon after the main shock on 20th of May 2012, CH
4 average concentrations increased by more than three
orders of magnitude (6.46% v/v), whereas H2 and CO2 showed an increment to 9.36 ppm v/v and 5.43% v/v
respectively. The highest values of all gas species were observed at M20 and M3 (up to 39.00% v/v and 89.42 ppm v/v for CH4 and H2 at M20, and up to 13.50% v/v for CO2 at M3) and in a newly formed area with lack of
vegeta-tion (M14, 11.83% v/v, 86.56 ppm v/v and 40.34% v/v for CO2, H2 and CH4, respectively).
A few months later, in September 2012, average H2 concentrations increased further (12.28 ppm v/v), whereas
CH4 and CO2 concentrations remained substantially stables, with the highest values (39.80% v/v and 12.25% v/v,
respectively) in correspondence of M3 site. Some CO2 anomalous spots (with values ranging from 8.41% v/v to
8.94% v/v) were measured outside the macroseeps zone, in the northern and southern part of the study area. In absence of hints for a deep origin (as the association with other geogas) these anomalies can be attributed to organic material oxidation, microorganism or plant respiration21.
Between 2013 and 2014 the CH4 mean concentrations increased up to 7.53% v/v (highest value of 84.20% v/v
at M20), whereas H2 decreased to 3.64 ppm v/v with the highest value of 37.2 ppm v/v always at M20. Mean CO2
concentrations decreased to 2.72% v/v (maximum value of 11.01% v/v on M3).
Finally, in 2015 the average concentrations of all gases dropped to 2.03% v/v, 4.61 ppm v/v and 0.70% v/v for CO2, H2 and CH4, respectively, remaining overall higher than the values collected in 2008. CH4 highest values
were found on macroseeps (maximum value of 8.97% v/v on M14), whereas the highest CO2 and H2 values
(6.32% v/v and 30.7 ppm v/v) were located in the northern and eastern part of the studied area.
The origin of soil gas was investigated by isotopic ratios of CH4 and CO2 measured on the points with
high-est concentrations (Table S2). As already mentioned δ13C-CH
4, δD-CH4 measured on M3 and M20 in October
ranged from −29.86‰ to −25.88‰ vs VPDB and −92.26‰ to −106.44‰ vs VSMOW, respectively. A few months later (December 2008) these points sensibly changed their CH4 isotopic ratios moving toward more
negative values (ranging from −66.89‰ to −68.07‰ vs VPDB, and from −182.7‰ to −187.95‰ vs VSMOW), with only minor variations between 2012 and 2015. Other samples with anomalous concentrations showed Figure 2. 3D-contour maps of CO2, H2 and CH4 concentrations from October 2008 to May 2015. Dashed lines:
substantially consistent δ13C-CH
4, δD-CH4 values over the time, ranging from −21.51‰ to −78.85‰ vs VPDB
and from −72.83‰ to −187.8‰ vs VSMOW. δ13C-CO
2, measured from December 2008 to May 2015, displayed a wide variation, from −10.96‰ up to
−70‰ vs VPDB.
Discussion
The anomalous concentration of CO2, H2 and CH4, highlighted a general E-W trend connecting the main
mac-roseeps (Fig. 2). The association of more than one gas species along a linear trend suggests the presence of a pre-viously unknown blind fault, similarly to what observed in other seismically active areas4. In soils, the average H
2
concentration is about 0.5 ppm v/v, almost the same as that found in the atmosphere. High H2 concentrations, up
to several thousand ppm, are restricted to active faults22. CH
4 and H2 concentrations are positively correlated over
time, with a Pearson coefficient ranging from 0.66 to 0.86. This relationship suggest that CH4 can act as a carrier
for H2 which would be otherwise unable to reach the surface due to its low concentration2,22.
No evidence for this linear trend were observed before 2012, thus it can be inferred that seismic activity has altered stress field enhancing a pre-existent phenomenon, such as the gas seepage through the soil. Earthquakes and crustal deformation4 can indeed alter the hydraulic properties of soils, such as permeability and porosity, favoring advective migration of deep gases toward the surface caused by variations in pressure and temperature following preferential pathways.
In a low permeability soil, such as the Plio-Pleistocene sediments of the area, the overpressure generated by an earthquake can remain active for a long period and the effects on deformations and on fluid flow could be visible after several months23. The significant decrease of soil gas concentrations in 2015 may be due to both a reduction of permeability and porosity of rocks and soils in the rupture zone and a closure of the pathways opened by the seismic activity after the overpressure generated by the earthquake had reduced.
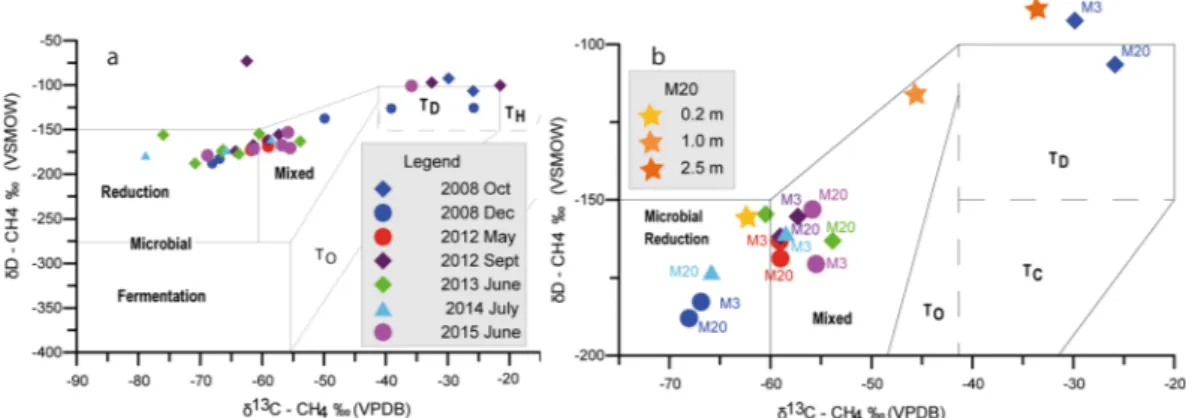
Concerning the isotopic ratios (δ13C-CH
4, δD-CH4 and δ13C-CO2) of soil gas, the traditional Shoell’s plot24
(Fig. 3a) highlights two different groups of data: one with prevailing microbial and mixed origin, and a few points falling in the thermogenic (TD) field. Thermogenic signature is positively correlated with low CH4
concentra-tions, whereas for increasing CH4 concentrations microbial and mixed sources prevail.
Overall, during the survey record, the isotopic signatures of most samples remained substantially consistent. However the most active M3 and M20 macroseeps switched their signature from thermogenic (October 2008) to both microbial and mixed origin (December 2008–2015; Fig. 3b). We suggest that in this area two different sources of methane coexist, one thermogenic, deriving from the deeper Mesozoic reservoirs17 (>3000 m), and another microbial25 produced at a shallower depth (between 200 and 900 m). It is likely that the relative increase of microbial component masks the thermogenic contribution. The lack of an evolutionary trend between ther-mogenic and mixed-microbial origin suggest that a fractioning process does not occur. On the contrary, the shift between mixed and microbial origin suggests the presence of a variable contribution of shallow input over time. A vertical profile, performed in 2015 at the M20 site (Fig. 3b; Supplementary Table S3) to verify this hypothesis, showed increasing thermogenic contribution with depth, shifting from microbial (0.20 m), to mixed (1 m), to thermogenic (2.5 m).
Samples with thermogenic origin showed δ13C-CO
2 values (from −10.96‰ to −37.04‰) typical of organic
and/or soil-derived origin26. On the contrary, extremely negative values, between −42.15 and −70.01‰, were recorded on samples with CH4 microbial and mixed origin. These negative values have the same13C/12C ratio of
CH4, suggesting that CO2 directly derives from microbial CH4.
This hypothesis is consistent with Galand et al.27, Valentine et al.28 and Whiticar29 which showed that processes as bacterial methanogenesis may produce a carbon isotopic fractionation between CH4 and the coexisting CO2
ranging from 41‰ to 72‰, 22‰ to 58‰, and 49‰ to 95‰, respectively. These ranges are higher than the iso-topic difference between CH4 and CO2 detected at Medolla area (from 28‰ to −2‰; Table S2). In fact, the
deple-tion of 13C in CO is more compatible with a 13C/12C kinetic fractionation due to a partial CH to CO conversion
Figure 3. Methane carbon and hydrogen isotope diagram (genetic zonation revised and updated by ref.38, after ref.24). (a) all collected isotopic data; (b) zoom of the plot highlighting only the M3 and 20 data, and the vertical profile on M20 (0.2, 1.0, 2.5 m depth). TO, thermogenic with oil; TC, thermogenic with condensate; TD, dry thermogenic; TH: thermogenic with high-temperature CO2–CH4 equilibration.
(11.7% v/v and 38.8% v/v, respectively). On the other hand when a gas uprising is high, CH4 is not completely
consumed by bacteria32. According to the prevailing local conditions, some fraction of methane may escape oxi-dation reaching the surface.
Conclusions
Soil gas distribution and their isotopic signature were investigated in the Medolla farming area, between 2008 and 2015. After the 2012 seismic sequence the soil gas concentrations of CO2, H2 and CH4 markedly increased
along an E-W preferential direction, suggesting the presence of a buried tectonic lineament linking CH4
macros-eeps. Seismic crustal deformation favored the fluid migration towards the surface by increasing the pore pressure and/or enhancing permeability of soils following preferential pathways. In 2015, these concentrations gradually decrease towards the initial values, although they remain still higher than those observed in 2008. This decreasing is likely due to a natural lowering of permeability and porosity in the rupture zone after the overpressure gener-ated by the earthquake had reduced.
Isotopic ratios of CH4 and CO2 highlight two different gas sources, one deeper, thermogenic and another
shallower, microbial. These sources coexist producing a variable isotopic 13C/12C ratio from microbial to mixed,
depending on the contributions of each source. The lack of an evolutionary trend between thermogenic and mixed-microbial origin suggest that a fractioning process does not occur.
The extremely negative values of δ13C-CO
2, recorded on samples with CH4 microbial and mixed origin, and
the high soil temperatures are ascribed to the exothermic oxidative reactions of CH4 in CO2 which occur in the
presence of free oxygen and methanotrophic bacteria. The macroseeps CH4 emission and the high soil
temper-ature have been known since the late nineteenth century and are therefore independent from tectonic activity of 2012. The earthquakes might have enhanced the gas seepage phenomenon, favoring the uprising of microbial and mixed CH4. According to isotopic results, the ground shaking linked to the 2012 seismic sequence enhanced the
migration of soil gases from the shallower layers of Plio-Pleistocene deposits, increasing the microbial contribu-tion of methane and covering the low amount of deeper thermogenic gases.
Soil gas geochemistry represents an useful tool to discriminate the gas migration related to seismic activity. The long term geochemical monitoring allowed to recognize that after an initial variation of soil gas distribution linked to seismic activity, the system in the Medolla area is slowly returning to its pre-seismic condition. Obtained results encourage the research about soil gas geochemistry on seismic active area highlight the importance to have a dataset before, during and after earthquakes.
Method
Sampling procedure.
37 soil gas samples were collected on a yearly basis from October 2008, except for two surveys in 2012. All surveys were conducted during a period of stable and dry weather conditions and in a short time to minimize any variations induced by different sampling periods. Samples were collected from the unsatu-rated or vadose zone using a steel probe driven into the ground to a depth of 0.8 m; this depth is considered to be below the major influence of meteorological variables33,34.Chemical analysis.
The soil–gas concentrations (N2, O2, CO2, CH4, He, C2H6, H2) were analyzed in theFluid Geochemistry Laboratory at INGV Rome, by a MicroGC Agilent 4900 CP, equipped with two Thermal Conductivity Detectors, responding to the difference in thermal conductivity between the carrier gas (Ar) and the sample components, with an error of ±3%.
Isotopic analysis on free gas (δ13C-CO
2, δ13C-CH4, δD-CH4,) were performed at ISO4 S.n.c. Laboratory. The
results were obtained by preparing the sample according to ref.35. Results are expressed in VSMOW and VPDB, following the International Atomic Energy Agency protocol.
Statistical analysis.
Standard statistical parameters were computed by Statistica 10.0 (StatSoft, Inc.). Normal probability plots (NPPs), were elaborated by Sinclair method to distinguish different populations and amore objective approach to statistical anomaly threshold estimation.The normal probability plot of CO2 shows a data distribution characterized by six populations: i) background
values, ranging from 0 to 1% v/v; ii) threshold anomaly, ranging from 1 and 2% v/v; iii) weak local anomaly, rang-ing from 2 to 3% v/v; iv) moderate anomalous values, up to 6% v/v; v) high anomalous values, rangrang-ing from 6 to 10% v/v; vi) outliers, with values higher than 10% v/v.
The NPP of H2 highlights a quite homogeneous distribution for values up to 10 ppm v/v, with background
values from 0 to 1.8 ppm v/v, weak anomalies between 4 and 10 ppm v/v, moderate anomalies between 10 and 36 ppm v/v, high anomalies between 36 and 60 ppm v/v and outlier values over 60 ppm v/v.
For CH4, six populations were identified. The threshold anomaly is comprised between 0 and 1000 ppm v/v.
The other populations are characterized by values ranging from 1000 ppm v/v to 4% v/v (local anomaly), from 4 to 10% v/v (weak anomaly), from 10 to 18% v/v (anomalous values), from 18 to 30% v/v (high anomalous values) and values over 30% v/v (outliers).
Data were displayed as 3D Surface maps were used to create a three-dimensional shaded rendering from a grid file. The height of the surface corresponds to the Z value of the associated grid node. These maps use col-ours to indicate the local orientation of the surface relative to a user-defined light source direction. The program Surfer 12.0 (Golden Software) determines the orientation of each grid cell and calculates reflectance of a point light source on the grid surface. The light position for all the maps is 135° for the horizontal angle and 45° for the vertical angle.
References
1. Ciotoli, G. et al. Soil gas distribution in the main coseismic surface rupture zone of the 1980, Ms = 6.9, Irpinia Earthquake (southern Italy). J. Geophys. Res. 119, 2440–2461, https://doi.org/10.1002/2013JB010508 (2014).
2. Ciotoli, G., Sciarra, A., Ruggiero, L., Annunziatellis, A., Bigi, S. Soil gas geochemical behaviour across buried and exposed faults during the 24 August 2016 central Italy earthquake. Ann. of Geophys. 59, Fast Track 5, https://doi.org/10.4401/ag-7242 (2016). 3. Fu, C. C., Yang, T. F., Walia, V. & Chen, C.-H. Reconnaissance of soil gas composition over the buried fault and fracture zone in
southern Taiwan. Geochem. J. 39, 427–439 (2005).
4. Walia, V. et al. Soil-gas monitoring: a tool for fault delineation studies along Hsinhua Fault (Tainan), southern Taiwan. Appl. Geochem. 25, 602–607 (2010).
5. Walia, V. et al. Temporal variation of soil gas compositions for earthquake surveillance in Taiwan. Radiat. Meas. 50, 154–159 (2013). 6. Sibson, R. H. Fluid involvement in normal faulting. J. Geodyn. 29, 469–499 (2000).
7. Collettini, C. et al. Fault weakening due to CO2 degassing in the Northern Apennines: Short- and long-term processes. Geol. Soc.
Lond. Spec. Publ. 299, 175–194, https://doi.org/10.1144/SP299.11 (2008).
8. Spinelli, A. G., and Cuoghi Costantini, A. Una salsa e terre calde in Medolla. Il Panaro–La Gazzetta di Modena, 117 pp. (1893). 9. Capacioni, B., Tassi, f, Cremonini, S., Sciarra, A. & Vaselli, O. Ground heating and methane oxidation processes at shallow depht in
Terre Calde di Medolla (Italy): Observations and conceptual model. J. Geophys. Res-Sol. Ea. 120(5), 3048–3064, https://doi. org/10.1002/2014JB011635, (2015).
10. Nespoli, M., Todesco, M., Capaccioni, B. & Cremonini, S. Ground heating and methane oxidation processes at shallow depth in Terre Calde di Medolla (Italy): Numerical modeling. J. Geophys. Res-Sol. Ea. 120(5), 3065–3076, https://doi. org/10.1002/2014JB011636, (2015).
11. Cappelletti, M., Ghezzi, D., Zannoni, D., Capaccioni, B. & Fedi, S. Diversity of Methane-Oxidizing Bacteria in Soils from “Hot Lands of Medolla” (Italy) Featured by Anomalous High-Temperatures and Biogenic CO2 Emission. Microbes Environ. 31(4), 369–377, https://doi.org/10.1264/jsme2.ME16087 (2016).
12. Pieri, M. & Groppi, G. Subsurface geological structure ofthe Po Plain, Italy. CNR Progetto Finalizzato Geodinamica 414 (1981). 13. Fantoni, R. & Franciosi, R. Tectono-sedimentary setting of the Po Plain and Adriatic foreland. Rend. Fis. Acc. Lincei 21(Suppl 1), 197,
https://doi.org/10.1007/s12210-010-0102-4 (2010).
14. Michetti, A. M. et al. Active compressional tectonics, Quaternary capable faults and the seismic landscape of the Po Plain (N Italy). Ann. of Geophys. 55(5), 969–1001, https://doi.org/10.4401/ag-5462 (2012).
15. Vi.D.E.P.I. Geodatabase. Ministero dello Sviluppo Economico. Progetto Videpi http://unmig.sviluppoeconomico.gov.it/videpi/ videpi.asp (2017)
16. Lindquist, S. J. Petroleum Systems of the Po Basin Province of Northern Italy and the Northern Adriatic Sea: Porto Garibaldi (Biogenic), Meride/Riva di Solto (Thermal), and Marnoso Arenacea (Thermal). U. S. Department of the Interior, U. S. Geological Survey, Open-File Report 99-50-M, 35pp (1999).
17. Mattavelli, L. & Novelli, L. Geochemistry and habitat of natural gases in Italy. Org. Geochem. 13, 1–13 (1988).
18. Chiarabba, C. et al. Frontal compression along the Apennines thrust system: The Emilia 2012 example from seismicity to crustal structure. J. Geodyn. 82, 98–109, https://doi.org/10.1016/j.jog.2014.09.003 (2014).
19. Sinclair, A. J. A fundamental approach to threshold estimation in exploration geochemistry: Probability plots revisited. J. Geochem. Explor. 41, 1–22 (1991).
20. Sciarra, A. et al. Geochemistry of shallow aquifers and soil gas surveys in a feasibility study at the Rivara natural gas storage site (Po Plain, northern Italy). Appl. Geochem. 34, 3–22 (2013).
21. Li, Y. et al. Spatial Variations of Soil Gas Geochemistry in the Tangshan Area of Northern China. Terr. Atmos. Ocean. Sci. 24, 323–332 (2013).
22. Toutain, J. P. & Baubron, J. C. Gas geochemistry and seismotectonics: a review. Tectonophysics 304, 1–27 (1999).
23. Shi, Z., Wanga, G., Wang, C.-Y., Manga, M. & Liu, C. Comparison of hydrological responses to the wenchuan and lushan earthquakes. Earth Planet. Sc. Lett. 391, 193–200, https://doi.org/10.1016/j.epsl.2014.01.048 (2014).
24. Schoell, M. Multiple origins of methane in the Earth. Chem. Geol. 71, 1–10 (1988).
25. Tassi, F. et al. Origin of light hydrocarbons in gases from mud volcanoes and CH4-rich emissions. Chem. Geol. 294–295, 113–126 (2012).
26. Cerling, T. E., Solomon, D. K., Quade, J. A. & Bowman, J. R. On the isotopic composition of carbon in soil carbon dioxide. Geochim. Cosmochim. Acta 55, 3403–3406 (1991).
27. Galand, P. E., Yrjala, K. & Conrad, R. Stable carbon isotope fractionation during methanogenesis in three boreal peatland ecosystems. Biogeosciences 7, 3893–3900 (2010).
28. Valentine, D. L., Chidthaisong, A., Rice, A., Reeburg, W. S. & Tyler, S. C. Carbon and hydrogen isotope fractionation by moderately thermophilic methanogens. Geochim. Cosmochim. Acta 68, 1571–1590 (2004).
29. Whiticar, M. J. Carbon and hydrogen isotope systematics of bacterial formation and oxidation of methane. Chem. Geol. 161, 291–314 (1999).
30. Ioannides, T. & Verykios, X. Catalytic partial oxidation of methane in a novel heat-integrated wall reactor. Catal. Lett. 47(3–4), 183,
https://doi.org/10.1023/A:1019077626264 (1997).
31. C.N.R. Caratteri geoidrologici e geotermici dell’Emilia-Romagna. Programmi e prospettive per lo sfruttamento delle risorse geotermiche regionali, Regione Emilia-Romagna e Consiglio Nazionale delle Ricerche, Collana di orientamenti geomorfologici ed agronomico-forestali [in Italian], 177 pp (1982).
32. Sundh, I., Mikkelä, C., Nilsson, M. & Svensson, B. H. Potential aerobic methane oxidation in a sphagnum dominated wetland— controlling factors and relation to methane emission. Soil Biol. Biochem. 27, 829–837 (1995).
Author Contributions
A.S. conceived the project design with contributions from M.C., A.S. and B.C. collected samples; A.S. performed the chemical and the statistical analysis. A.S. and B.C. wrote the paper with input from all co-authors.
Additional Information
Supplementary information accompanies this paper at https://doi.org/10.1038/s41598-017-14500-y. Competing Interests: The authors declare that they have no competing interests.
Publisher's note: Springer Nature remains neutral with regard to jurisdictional claims in published maps and institutional affiliations.
Open Access This article is licensed under a Creative Commons Attribution 4.0 International License, which permits use, sharing, adaptation, distribution and reproduction in any medium or format, as long as you give appropriate credit to the original author(s) and the source, provide a link to the Cre-ative Commons license, and indicate if changes were made. The images or other third party material in this article are included in the article’s Creative Commons license, unless indicated otherwise in a credit line to the material. If material is not included in the article’s Creative Commons license and your intended use is not per-mitted by statutory regulation or exceeds the perper-mitted use, you will need to obtain permission directly from the copyright holder. To view a copy of this license, visit http://creativecommons.org/licenses/by/4.0/.