UNIVERSITÀ DEGLI STUDI DEL PIEMONTE ORIENTALE
“AMEDEO AVOGADRO”
Dipartimento di Medicina Traslazionale
Corso di Dottorato di Ricerca in Medicina Clinica e Sperimentale
Ciclo XXVII
MOLECULAR PREDICTION OF DURABLE REMISSION AFTER
FIRST LINE FLUDARABINE-CYCLOPHOSPHAMIDE-RITUXIMAB
IN CHRONIC LYMPHOCYTIC LEUKEMIA
Settore Scientifico Disciplinare Malattie del Sangue (MED15)
Coordinatore Tutor
Prof.ssa Marisa Gariglio Prof. Gianluca Gaidano
Dottorando
INDEX
INTRODUCTION AND AIM ... 3
METHODS ... 4
PATIENTS ... 4
STUDY DESIGN ... 4
STATISTICAL ANALYSIS ... 5
IMMUNOGLOBULIN GENE MUTATION ANALYSIS AND FISH ... 7
RESULTS ... 9
CHARACTERISTICS OF THE STUDY COHORT ... 9
IGHV MUTATION STATUS AND HIGH-RISK CYTOGENETICS ARE INDEPENDENT PREDICTORS OF PFS AFTER FRONT LINE FCR ... 9
MOST IGHV MUTATED PATIENTS LACKING POOR RISK CYTOGENETIC ABNORMALITIES REMAIN FREE OF PROGRESSION AFTER FRONT-LINE FCR ... 10
IGHV MUTATED PATIENTS LACKING POOR RISK CYTOGENETIC ABNORMALITIES HAVE A NEAR-NORMAL LIFE EXPECTANCY AFTER FRONT LINE FCR ... 12
DISCUSSION ... 14
REFERENCES ... 18
TABLES ... 24
FIGURE LEGENDS ... 30
INTRODUCTION AND AIM
Fludarabine, cyclophosphamide and rituximab (FCR) is the most effective regimen for the management of chronic lymphocytic leukemia (CLL), and represents the current standard for
previously untreated patients who are young and in good physical conditions.1-3 Though the
majority of CLL patients receiving FCR as frontline therapy are destined to relapse, a subgroup of
cases may experience durable first remission of their disease.4-6
Recently, an impressive array of novel effective therapies has been developed that hold the potential of increasingly individualized treatment modalities if patients’ risk could be accurately
characterized.7-13 Also, in the new scenario of targeted agents for CLL, affordable treatment
strategies should be patient-risk oriented as well as cost-effective and resource-saving.14 On these
bases, there is an increasing interest in identifying a priori patients who may maximally benefit from a single shot of FCR chemoimmunotherapy.
Over the last decade, several molecular prognostic markers capable of stratifying the
outcome of CLL patients have been identified.15-18 Some of them are widely utilized in the routine
clinical practice and, individually, have consistently shown prognostic or predictive capability in the
clinical setting of patients who have received FCR.2,4,5,19,20 However, none of them has been tested
either alone or in combination with other biomarkers to specifically predict the long-term benefit of chemoimmunotherapy.
In this observational retrospective study based on a large dataset of FCR-treated CLL, we show that the combination of three biomarkers of common use, i.e. immunoglobulin heavy variable (IGHV) gene mutation status and FISH abnormalities at chromosomes 11q and 17p, allows to segregate a subgroup of CLL patients who may achieve a durable remission after first-line FCR and experience an expected survival similar to that of the general population.
METHODS
Patients
The study collected 404 progressive and previously untreated CLL patients who consecutively received standard FCR as first-line therapy in 19 hematologic centers between 2001 and 2010. Patients must have fulfilled all of the following criteria for being actively registered in the study: i) having a diagnosis of untreated progressive CLL according to NCI or IWCLL/NCI
criteria;21,22 ii) having received first-line treatment with FCR at standard doses (i.e. no FCR lite);1,2
iii) having received at least the first dose of the first FCR cycle according to an intention to treat approach; iv) having started FCR treatment by 2010, in order to have an adequate follow-up among alive patients; v) not receiving maintenance after FCR; and vi) having a minimal set of information, including demographic data, treatment indication (development or worsening of anemia and/or thrombocytopenia, massive or progressive or symptomatic splenomegaly or lymphadenopathy,
lymphocyte doubling time, other),21,22 Binet stage at treatment, date of FCR start, date of the last
dose of FCR, number of FCR courses administered, date of progression according to NCI or
IWCLL/NCI criteria,21,22 and date of last follow-up or death. The following information were also
collected for the majority of patients: pre-treatment IGHV mutation status, pre-treatment FISH profile (performed within 3 months before FCR treatment start), cause of death, treatment emergent second primary malignancies, date and type of next treatments after FCR.
Study design
The study was designed as a retrospective observational analysis. Patients received FCR between April 2001 and December 2010. The database was locked on June 2014. For sample size definition, we assumed a 6-years progression-free survival (PFS) of 38%, a constant hazard of
progression of 0.012 per month and a maximum follow-up of 96 months.4,5 Given these assumptions, the sample size (n=404) has an 86% and 98% power (two-tailed alpha 5%) to identify cases in which the hazard of progression drops to zero after 5 years of follow-up if they account for 10% or 20% of the entire population, respectively.
The Reporting Recommendations for Tumor Marker Prognostic Studies (REMARK) criteria
were followed throughout this study.23 Patients provided informed consent in accordance with local
IRB requirements and Declaration of Helsinki. The study was approved by the Ethical Committee of the Ospedale Maggiore della Carità di Novara associated with the Amedeo Avogadro University of Eastern Piedmont (Protocol Code 59/CE; Study Number CE 8/11).
Statistical analysis
PFS was the primary endpoint and was measured from date of treatment start to date of progression according to IWCLL-NCI guidelines (event), death (event) or last follow-up
(censoring).22 Overall survival (OS) was measured from date of initial presentation to date of death
from any cause (event) or last follow-up (censoring).22 Time to progression (TTP) was measured
from date of treatment start to progression according to IWCLL-NCI guidelines (event), death
(censoring) or last follow-up (censoring).22 Response assessment was according to NCI or
IWCLL-NCI guidelines.21,22 Survival analysis was performed by the Kaplan-Meier method and compared
between strata using the Log-rank test.24
The adjusted association between exposure variables and PFS was estimated by Cox
regression.25 Cox regression included exposure variables showing an univariate association with
PFS with a significant level <0.1.26 The proportional hazard assumption was assessed by plotting
the smoothed Schoenfeld residuals against time.27 The bias corrected c-index and calibration slope
of the Cox model were calculated through the .632 bootstrap method (1000 resamplings).28,29 The
(number of degree of freedom in the model)/(model likelihood ratio χ2). This approach provides an
estimate of prediction accuracy of the Cox model to protect against overfitting.26,28 The stability of
the Cox model was internally validated using bootstrapping procedures.30 In the first step, 1000
bootstrap samples were generated randomly with replacement from the original CLL population. Cox regression was applied to each bootstrap sample with the same covariates as the original modeling. The percentage of bootstrap samples for which each covariate was selected as significant in the model was then calculated. Percent of selection reflects the prognostic importance of a covariate, because it is expected that an important covariate will be selected for the majority of bootstrap samples. In the second step, 1000 additional bootstrap samples were generated randomly with replacement from the original CLL population. Cox regression was applied to each bootstrap sample with the same covariates as the original modeling. For each covariate, the mean standard deviation and confidence intervals were computed for the 1000 bootstrap replications. Smooth estimate of the hazard of progression according to the time elapsed from treatment start were
estimated as previously reported.31,32
Compared to the Cox-fitted model, recursive partitioning for survival data with censoring has the advantage of a more objective and non arbitrary construction of a hierarchical classification
of covariates.33 The first step in recursive partitioning analysis was to find the best split of the data
into two groups (nodes) by the predictor variable that captures the most information in the variability of PFS. The process was recursively repeated, so succeeding steps find the best splits of the data within each of the nodes resulting from prior splits (daughter nodes). The entire dataset was considered as the primary node. Three major steps were utilized to derive the best decision tree: i) growing an initial tree under the following constraints and stopping rules: a) split criteria of p<0.05 according to the log-rank test adjusted for multiple comparisons by Bonferroni; b) >20 patients in a node in order to be considered for splitting; c) >10 patients in a terminal node; ii) applying a pruning algorithm based on the complexity parameter (cp=0.015); and iii) cross-validating the best tree size. Ten-fold cross-validation was used to determine the best tree size. The best number of
splits was identified as that showing a cross-validation error lower than the smallest cross validation error + the corresponding standard error. The stability of the recursive decision tree was validated
by the random survival forest method.34 An amalgamation algorithm was used to merge terminal
nodes showing homogenous PFS (further details are available in the Supplementary Appendix).33
Relative survival, defined as the ratio between the actuarial survival observed in the CLL cohort and the expected survival of the general Italian population matched to CLL patients by sex,
age and calendar year of diagnosis, was calculated using the Ederer II method.35 The major
advantage of relative survival is that it provides a measure of the excess mortality experienced by CLL patients, irrespective of whether the excess mortality is directly or indirectly attributable to the disease. Estimates of the expected survival were calculated utilizing Italian life tables obtained from the Human Mortality Database (http://www.mortality.org/, accessed June 18, 2014).
Categorical variables were compared by Chi-square and exact tests when appropriate. All statistical tests were two-sided. Statistical significance was defined as p value <0.05. The analysis was performed with the Statistical Package for the Social Sciences (SPSS) software v.22.0
(Chicago, IL) and with R statisticalpackage 3.1.2 (http://www.r-project.org).
Immunoglobulin gene mutation analysis and FISH
IGHV mutation analysis and FISH were performed at the reference laboratory of each participating center. IGHV mutation status was tested on tumor gDNA (5 centers) or cDNA (14 centers) collected at diagnosis or before FCR treatment start, and was assessed according to the
ERIC guidelines36 by using the BIOMED-2 primers (13 centers),37 primers by Fais et al (5
centers),38 or an internally developed set of primers (1 center).39 Sequences that differed by more
than 2% from their corresponding germline were considered as mutated.15,16,36 FISH analysis was
more than three months before FCR treatment start. Probes (Abbott) used for FISH analysis were: LSI13 and LSID13S319, CEP12, LSIp53, and LSIATM. For each probe, at least 200 interphase cells were examined. The presence of 13q deletion, trisomy 12, 11q deletion and 17p deletion abnormalities was scored when the percentage of nuclei with the abnormality was above each laboratory internal cut offs defined as the mean plus 3 standard deviations of the frequency of
RESULTS
Characteristics of the study cohort
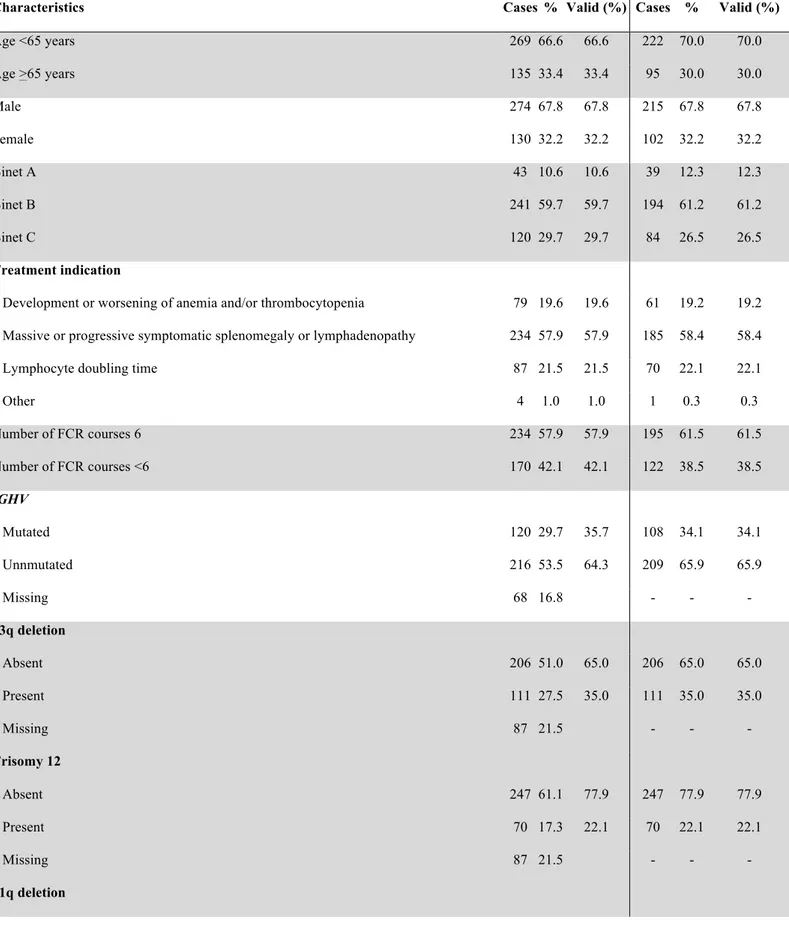
The characteristics of the study cohort (n=404; Table 1) were consistent with those reported
in CLL receiving FCR as first treatment,2 including age (median: 61 years; >65 years in 33.4% of
patients), gender (male in 67.8% of patients), stage (progressive Binet A in 10.6% of patients; Binet B in 59.7%; Binet C in 29.7%) and number of FCR courses (median: 6; <6 courses in 42.1% of patients). Most patients (n=336; 83.2% of the entire cohort) were evaluable for the IGHV mutation status (unmutated in 216, 64.3% of patients) and genomic aberrations at treatment requirement (n=317; 17p deletion in 30, 9.5% of patients; 11q deletion in 61, 19.2%; +12 in 70, 22.1%; 13q deletion in 111, 35.0%). Cases assessable for both IGHV mutations status and FISH (n=317) and cases lacking this molecular information (n=87) did not differ with respect to demographic features, clinical stage at FCR and treatment indication, thus excluding selection biases. The clinical outcome of the study cohort was also consistent with the outcome reported for CLL patients receiving FCR
as first-line treatment.2 Complete response was documented in 63.9% of assessed cases and partial
response in 26.9% (Table 1). After a median follow-up of 70 months, 194 patients have progressed and 72 have died, accounting for a median PFS of 54.8 months and for a 5-year OS of 81.2% (median: not reached) (Figure 1A-1B).
IGHV mutation status and high-risk cytogenetics are independent predictors of PFS after front line FCR
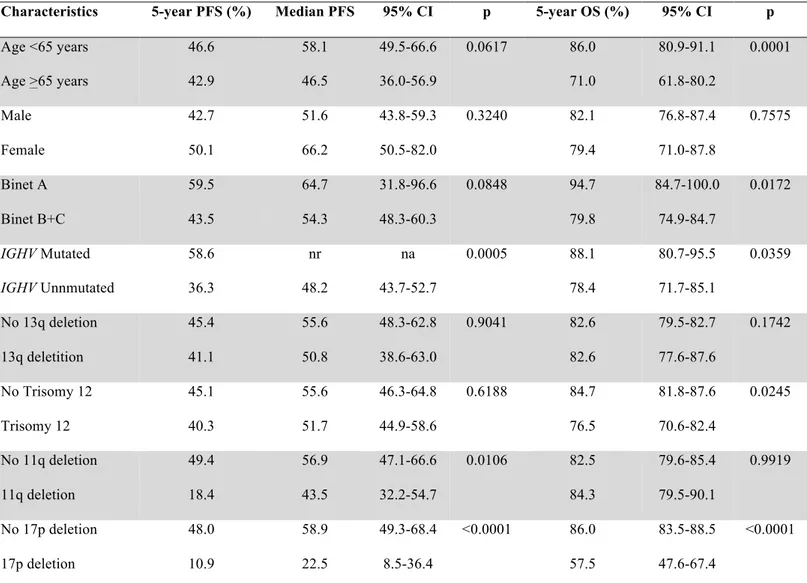
As a preliminary step towards the construction of a model to predict remission duration in FCR-treated CLL, we assessed the impact on PFS of explanatory variables collected at baseline
before treatment initiation. By univariate analysis (Table 2), patients harboring unmutated IGHV genes (5-year PFS: 36.3%; median: 48.2 months) showed a significantly shorter PFS compared to IGHV mutated patients (5-year PFS: 58.6%; median: not reached; p=.0005). PFS was also significantly shorter in 11q deleted patients (5-year PFS: 18.4%; median: 43.5 months; p=.0106) and 17p deleted patients (5-year PFS: 10.9%; median: 22.5 months; p<.0001). Analysis of hierarchically disposed FISH abnormalities reproduced the previously described prognostic groups
in this study cohort (Figure 2).2,5
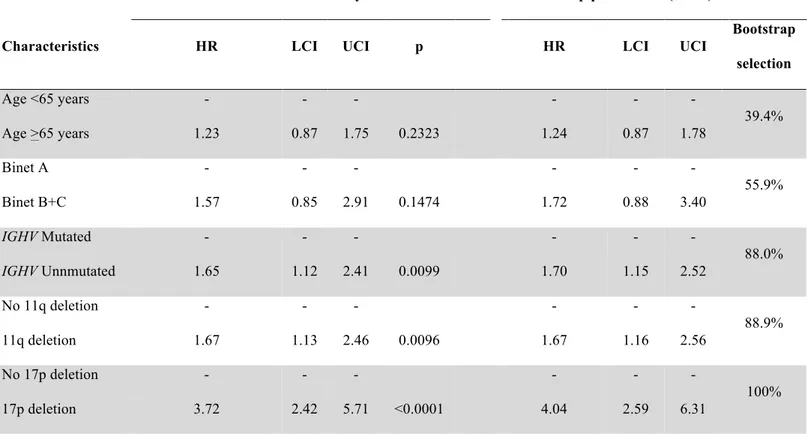
By bivariate analysis, 17p deleted patients had a short PFS, independent of the IGHV mutation status (Figure 3). Conversely, the presence of 11q deletion significantly affected PFS among IGHV mutated patients, while it was irrelevant among IGHV unmutated cases (Figure 4). By multivariate analysis (Table 3), unmutated IGHV genes (HR: 1.65; p=.0099), 11q deletion (HR: 1.67; p=.0096) and 17p deletion (HR: 3.72; p=<.0001) maintained independent association with PFS, thus providing the rationale to utilize these molecular features in the development of a model to predict remission duration after FCR.
Most IGHV mutated patients lacking poor risk cytogenetic abnormalities remain free of progression after front-line FCR
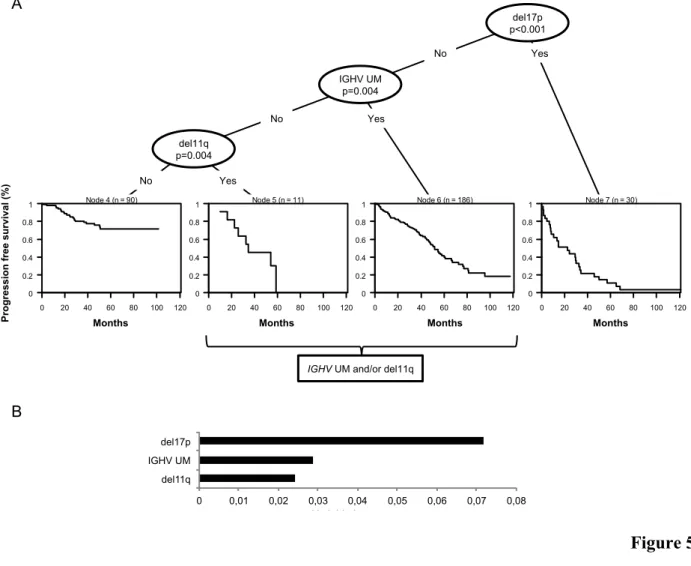
The hierarchical order of relevance in predicting PFS among 17p deletion, 11q deletion and
IGHV mutation status was established by recursive partitioning analysis (Figure 5A).33 Deletion of
17p was the most predictive variable in the survival tree, followed by IGHV mutation status and 11q deletion. Measure of the variable importance validated the hierarchical order of relevance of the molecular lesions established by the recursive partitioning analysis and confirmed the stability of
the decision tree (Figure 5B).34 Based on the application of the amalgamation algorithm to the
terminal nodes,33 cases carrying unmutated IGHV genes and cases harboring 11q deletion were
This approach allowed to establish a molecular model to classify CLL patients who received FCR as first treatment according to the risk of progression.
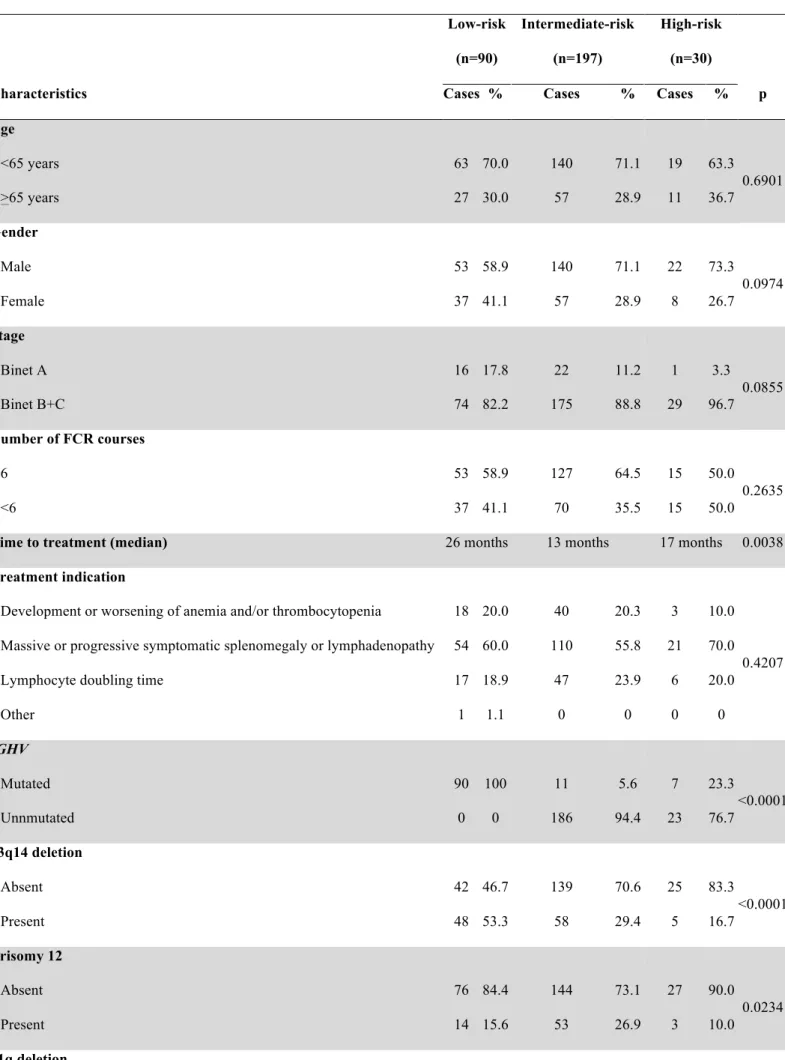
Three CLL subgroups were hierarchically classified (Figure 6A). Disease stage at FCR and treatment indication were superimposable across the three risk groups, suggesting that the differences in outcome cannot be ascribed to an unintended overtreatment of CLL patients not fulfilling the guideline recommended features of active and symptomatic CLL (Table 4). The high-risk category accounted for 9.5% of the study cohort and included patients harboring 17p deletion independent of co-occurring 11q deletion or the IGHV mutation status (5-year PFS: 10.9%; median: 22.5 months). The intermediate-risk category accounted for 62.1% of the study cohort and included patients harboring 11q deletion and/or unmutated IGHV genes in the absence of 17p deletion (5-year PFS: 37.9%; median: 51.7 months). The low-risk category accounted for 28.4% of the study cohort and comprised patients harboring mutated IGHV genes but lacking both 11q deletion and 17p deletion (5-year PFS: 71.6%; median: not reached). Consistent with a composition of mixed molecular profiles and lack of selection biases, cases not classifiable according to the model because of lacking FISH and/or IGHV mutation status (n=87) showed an intermediate clinical outcome (Figure 7). In the tree risk groups, TTP almost matched PFS, indicating that deaths without progression did not bias the survival analysis (Figure 8).
High- (17p deleted) and intermediate-risk (IGHV unmutated and/or 11q deleted) patients showed a constant increase of the hazard of progression over time and almost all were projected to relapse after FCR, although at a different rate: 17% per year of follow-up in the high-risk group and 10% per year of follow-up in the intermediate-risk group (Figure 6A and 9). Conversely, among low-risk patients (IGHV mutated without 17p or 11q deletion) the hazard of relapse plateaued at 20 months after FCR and dropped to 0 after five years of follow-up (Figure 9). Consistently, the PFS curve of low-risk patients showed a plateau starting at 5 years from FCR and most of the low-risk patients (71.6%) were projected to remain free of progression (Figure 6A). Overall, these data indicate that the combination of three biomarkers that are widely tested in the clinical practice
allows segregating a sizable subgroup of patients who may achieve a durable remission after front-line FCR.
Low- and intermediate-risk patients who received six FCR cycles showed a significantly higher chance of achieving a complete response and a longer PFS compared to patients who received less than six FCR cycles, suggesting that a full course of chemoimmunotherapy ensures a deeper disease control. The number of FCR courses did not impact on PFS of high-risk patients ( Figure 10).
IGHV mutated patients lacking poor risk cytogenetic abnormalities have a near-normal life expectancy after front line FCR
Relative survival analysis was used to provide a measure of the excess mortality experienced by CLL patients treated at first-line with FCR, irrespective of whether the excess mortality is
directly or indirectly attributable to the disease.35 When the demographic effects of age, gender and
year of treatment were compensated, the 5-year and 10-year survival rates of the whole cohort of patients were only 85.3% and 68.7%, respectively, of those expected in the matched normal general population (p<.0001) (Figure 1B).
Upon OS stratification according to the hierarchical model based on 17p deletion, 11q deletion and IGHV mutation status (Figure 6B), the life expectancies of high- (5-year relative survival: 60.2%; p<.0001) and intermediate-risk (5-year relative survival: 87.2%; p<.0001) patients were significantly impaired compared to that expected in the matched general population, thus indicating an excess of deaths related to the disease or treatment complications in these unfavorable CLL groups. Conversely, the life expectancy of low-risk patients was similar to that observed in the matched normal general population (5-year relative survival: 95.8%; p=.2770) (Figure 6B), indicating that neither the disease, nor the complications of treatment, affected survival in this favorable CLL group. Consistently, only five patients have died among low-risk patients, including
one of progressive disease, one of lung cancer and three of unrelated causes while in remission. In addition, the prevalence of treatment-emergent second primary malignancies was significantly lower in low-risk patients (3.9%, including one skin basal cell cancer, one lung cancer and one thyroid adenoma) compared to intermediate-risk and high-risk cases (12.1% and 19.0%, respectively; Table 4).
DISCUSSION
This study shows that the combination of three biomarkers that are widely tested at treatment requirement allows to segregate a subgroup of CLL patients - IGHV mutated without 17p or 11q deletion - who: i) accounts for a sizable fraction (28.4%) of progressive previously untreated CLL requiring treatment; ii) achieve a durable remission after first-line treatment with FCR; and iii) experience an expected survival similar to that of the general population.
These findings have potential implications for the design of clinical trials and, possibly, for overall disease management of CLL patients. Beyond FCR, significant therapeutic advances have occurred in the treatment of CLL and chemotherapy-free approaches are increasingly being
developed.7-10,12,13 Novel agents such as tyrosine kinase inhibitors show promising activity in CLL
but are associated with considerable costs and are not affordable in many health care systems if
applied broadly across large numbers of patients.14,40,41 To responsibly and effectively advance the
development of these new therapies, they should be targeted specifically to patient subgroups in which they can provide the greatest benefit compared to established chemoimmunotherapy regimens. Among high-risk CLL with TP53 abnormalities, the activity of tyrosine kinase inhibitors
appears significantly better than all previous pharmacologic strategies.7-10,12,13 On these bases,
though per se they do not assure long-lasting remissions and formal head to head comparisons with FCR or other chemoimmunotherapy combinations are lacking, tyrosine kinase inhibitors currently represent the best treatment option for TP53 disrupted CLL patients and have been approved as front-line therapy in this molecular subgroup. Among CLL patients lacking TP53 abnormalities, ongoing clinical trials are comparing tyrosine kinase inhibitors vs FCR as front-line treatment. Given the highly favorable outcome of IGHV mutated CLL lacking 17p and 11q deletion hereby reported following front-line FCR treatment, assessment of whether novel agents provides additional survival benefit in this biologic subgroup will require highly powered studies with a long follow-up.
Long-term toxicities, including treatment emergent second primary malignancies, represent
a concern for patients treated with FCR.42 In our study population, a proportion of patients
developed a second primary malignancy, including 3.9% of low-risk patients, 12.1% of intermediate-risk patients and 19% of high-risk patients. The low rate of second primary tumors among low-risk patients might be explained, at least in part, by the lower requirement of salvage treatments, and thus by the low overall load of chemotherapy received by these patients. Beside being of limited proportion, second primary malignancies also did not translate into an excess mortality in low-risk patients compared to the matched general population, suggesting that the risk of death for second primary tumors, as well as other treatment complications, is not increased among low-risk patients treated with FCR.
The intermediate-risk group of patients represents a case mix warranting further stratification, as suggested by the observation that ~20% of intermediate-risk patients progress shortly after FCR, while, on the other hand, ~20% of them are projected to remain progression-free after 5 years. Additional molecular markers, including gene mutations, have proved to be effective
in refining CLL prognostication when combined to cytogenetics and IGHV mutation status,43,44 and
may allow to fine tune the definition and composition of the intermediate-risk group.
This study reports on patients treated with FCR in the every-day life clinical practice and provides an insight into the “real-world” outcome of patients treated with FCR in the academic and community settings. Though not affected by the constrains of clinical trial inclusion criteria, this study cohort shows baseline features and outcome superimposable to those described for patients
treated with FCR within the framework of a clinical study.1,2 On these bases, though the
retrospective design represents a limitation of this analysis, an external and prospective validation of our data is provided by the consistent association between PFS and IGHV mutation status, 17p
deletion and 11q deletion in multivariable analyses from clinical trials of FCR treated CLL.2,5
A strong biologic rationale supports the application of this model to identify patients who may benefit mostly from FCR. Indeed, low-risk CLL patients harboring mutated IGHV genes, but
lacking 17p or 11q deletion, are those showing the highest sensitivity and deepest response to FCR, as documented by the high rate of minimal residual disease (MRD) eradication in this biologic
subgroup of CLL.45,46 This might stem from a lower degree of genetic complexity and lower rate of
high-risk subclones that characterize IGHV mutated CLL.47,48 In addition, IGHV mutated patients,
independent of the levels of disease burden reduction achieved by treatment, generally show a slow progression rate in keeping with the lower predisposition of IGHV mutated CLL to proliferate in
response to microenvironmental stimuli.45 Consistently, 40% (9/22) of the low-risk patients who
have progresses after FCR, did not require a second-line treatment after progression because of the indolent course of the relapsed disease, compared to only 14% (15/102) intermediate-risk patients and virtually none (1/27) of high-risk patients.
A limitation of this study is the lack of MRD data, which represent a strong independent
predictor of PFS in CLL patients treated with upfront FCR.45,46 IGHV mutated CLL patients have a
chance of obtaining negative MRD after few FCR courses,45 suggesting that they are the best
candidates for an early discontinuation approach. According to our results, however, a full course of FCR provides additional PFS benefit to low-risk patients. This observation is consistent with the notion that most (~50%) IGHV mutated low-risk patients achieve MRD eradication only after
completing all six cycles of FCR.45 Studies incorporating MRD eradication monitoring along with
molecular stratification might allow to derive recommendations about the optimal number of FCR courses each patient needs.
In the era of personalized medicine, the challenges of CLL treatment will involve correctly matching therapy to the unique risk profile of each individual patient. Our data support front-line FCR as a highly active option in physically fit patients with progressive CLL whose disease has a low-risk molecular profile. Novel chemoimmunotherapy approaches are in development, including less toxic combinations (i.e. bendamustine, rituximab, BR) or regimens incorporating second
generation anti-CD20 monoclonal antibodies (i.e. obinutuzumab and ofatumumab).11,49,50
allow to assess whether low-risk patients might equally benefit from BR, and whether second generation anti-CD20 monoclonal antibodies might further increase the proportion of low-risk cases that will remain progression-free on the long-term.
REFERENCES
1. Keating MJ, O'Brien S, Albitar M, et al. Early results of a chemoimmunotherapy regimen of
fludarabine, cyclophosphamide, and rituximab as initial therapy for chronic lymphocytic leukemia. J Clin Oncol. 2005;23(18):4079-88.
2. Hallek M, Fischer K, Fingerle-Rowson G, et al. Addition of rituximab to fludarabine and
cyclophosphamide in patients with chronic lymphocytic leukaemia: a randomised, open-label, phase 3 trial. Lancet. 2010;376(9747):1164-74.
3. Lepretre S, Aurran T, Mahé B, et al. Excess mortality after treatment with fludarabine and
cyclophosphamide in combination with alemtuzumab in previously untreated patients with chronic lymphocytic leukemia in a randomized phase 3 trial. Blood. 2012;119(22):5104-10.
4. Fink AM, Böttcher S, Ritgen M, et al. Prediction of poor outcome in CLL patients following
first-line treatment with fludarabine, cyclophosphamide and rituximab. Leukemia. 2013;27(9):1949-52.
5. Stilgenbauer S, Schnaiter A, Paschka P, et al. Gene mutations and treatment outcome in
chronic lymphocytic leukemia: results from the CLL8 trial. Blood. 2014;123(21):3247-54.
6. Tam CS, O'Brien S, Plunkett W, et al. Long-term results of first salvage treatment in CLL
patients treated initially with FCR (fludarabine, cyclophosphamide, rituximab). Blood. 2014;124(20):3059-64.
7. Byrd JC, Furman RR, Coutre SE, et al. Targeting BTK with ibrutinibin relapsed chronic
lymphocytic leukemia. N Engl J Med. 2013;369 (1):32-42.
8. Burger JA, Keating MJ, Wierda WG, et al. Safety and activity of ibrutinib plus rituximab for
patients with high-risk chronic lymphocytic leukaemia: a single-arm, phase 2 study. Lancet Oncol. 2014;15(10):1090-9.
9. Byrd JC, Brown JR, O'Brien S, et al. Ibrutinib versus ofatumumab in previously treated
10. Furman RR, Sharman JP, Coutre SE, et al. Idelalisib and rituximab in relapsed chronic lymphocytic leukemia. N Engl J Med. 2014;370(11):997-1007.
11. Goede V, Fischer K, Busch R, et al. Obinutuzumab plus chlorambucil in patients with CLL and coexisting conditions. N Engl J Med. 2014;370(12):1101-10.
12. O'Brien S, Furman RR, Coutre SE, et al. Ibrutinib as initial therapy for elderly patients with chronic lymphocytic leukaemia or small lymphocytic lymphoma: an open-label, multicentre, phase 1b/2 trial. Lancet Oncol. 2014;15(1):48-58.
13. Farooqui MZ, Valdez J, Martyr S, et al. Ibrutinib for previously untreated and relapsed or refractory chronic lymphocytic leukaemiawith TP53 aberrations: a phase 2, single-arm trial. Lancet Oncol. 2015;16(2):169-76.
14. Shanafelt TD, Borah BJ, Finnes HD, et al. Impact of Ibrutinib and Idelalisib on the Pharmaceutical Cost of Treating Chronic Lymphocytic Leukemia at the Individual and
Societal Levels. J Oncol Pract. Prepublished on Mar 24, 2015, as doi:JOP.2014.002469.
15. Damle RN, Wasil T, Fais F, et al. Ig V gene mutation status and CD38 expression as novel
prognostic indicators in chronic lymphocytic leukemia. Blood. 1999;94(6):1840-7.
16. Hamblin TJ, Davis Z, Gardiner A, Oscier DG, Stevenson FK. Unmutated Ig V(H) genes are associated with a more aggressive form of chronic lymphocytic leukemia. Blood.
1999;94(6):1848-54.
17. Döhner H, Stilgenbauer S, Benner A, et al. Genomic aberrations and survival in chronic
lymphocytic leukemia. N Engl J Med. 2000;343(26):1910-6.
18. Zenz T, Gribben JG, Hallek M, Döhner H, Keating MJ, Stilgenbauer S. Risk categories and
refractory CLL in the era of chemoimmunotherapy. Blood. 2012;119(18):4101-7.
19. Tam CS, O'Brien S, Wierda W, et al. Long-term results of the fludarabine, cyclophosphamide, and rituximab regimen as initial therapy of chronic lymphocytic leukemia. Blood. 2008;112(4):975-80.
20. Lin KI, Tam CS, Keating MJ, et al. Relevance of the immunoglobulin VH somatic mutation status in patients with chronic lymphocytic leukemia treated with fludarabine, cyclophosphamide, and rituximab (FCR) or related chemoimmunotherapy regimens. Blood.
2009;113(14):3168-71.
21. Cheson BD, Bennett JM, Grever M, et al. National Cancer Institute-sponsored Working Group guidelines for chronic lymphocytic leukemia: revised guidelines for diagnosis and
treatment. Blood. 1996;87(12):4990-7.
22. Hallek M, Cheson BD, Catovsky D, et al. Guidelines for the diagnosis and treatment of chronic lymphocytic leukemia: a report from the International Workshop on Chronic Lymphocytic Leukemia updating the National Cancer Institute-Working Group 1996
guidelines. Blood. 2008;111(12):5446-56.
23. McShane LM, Altman DG, Sauerbrei W, Taube SE, Gion M, Clark GM. Reporting
recommendations for tumor marker prognostic studies. J Clin Oncol. 2006;100(2):229-235.
24. Kaplan EL, Meier P. Nonparametric estimation from incomplete observations. Am Stat Assoc.
1958;53(282):457–481.
25. Cox DR. Regression models and life tables. J R Stat Assoc. 1972;34:187–220.
26. Harrell FE Jr. Regression modeling strategies. New York, NY: Springer-Verlag; 2001.
27. Schoenfeld D. Partial residuals for the proportional hazard regression model. Biometrika.
1982;69(1):239-241.
28. Harrell FE Jr, Lee K, Mark DB. Multivariable prognostic models: issues in developing models, evaluating assumptions and adequacy, and measuring and reducing errors. Stat Med.
1996;15(4):361-387.
29. Efron B, Tibshirani R. Improvements on cross-validation: the .632_bootstrap method. JASA.
1997;92:548–560.
30. Chen CH, George SL. The bootstrap and identification of prognostic factors via Cox's
31. Shipp MA, Harrington DP, Anderson JR, et al. A predictive model for aggressive non-Hodgkin's lymphoma. The International Non-non-Hodgkin's Lymphoma Prognostic Factors
Project. N Engl J Med. 1993;329(14):987-94.
32. Mueller HG, Wang JL. Hazard rates estimation under random censoring with varying Kernels and bandwidths. Biometrics. 1994;50:61-76.
33. Ciampi A, Negassa A, Lou Z. Tree-structured prediction for censored survival data and the
Cox model. J Clin Epidemiol. 1995;48(5):675–689.
34. Ishwaran H, Kogalur UB, Blackstone EH, Lauer MS., Random survival forests. Ann Appl Stat. 2008;2(3):841–860.
35. Dickman PW, Sloggett A, Hills M, Hakulinen T. Regression models for relative survival. Stat Med. 2004;23(1):51–64.
36. Langerak AW, Davi F, Ghia P, et al. Immunoglobulin sequence analysis and prognostication in CLL: guidelines from the ERIC review board for reliable interpretation of problematic
cases. Leukemia. 2011;25(6):979-84.
37. van Dongen JJ, Langerak AW, Brüggemann M, et al. Design and standardization of PCR primers and protocols for detection of clonal immunoglobulin and T-cell receptor gene recombinations in suspect lymphoproliferations: report of the BIOMED-2 Concerted Action
BMH4-CT98-3936. Leukemia. 2003;17(12):2257-317.
38. Fais F, Ghiotto F, Hashimoto S, et al. Chronic lymphocytic leukemia B cells express restricted sets of mutated and unmutated antigen receptors. J Clin Invest. 1998;102(8):1515-25.
39. Forconi F, Sahota SS, Raspadori D, Mockridge CI, Lauria F, Stevenson FK. Tumor cells of hairy cell leukemia express multiple clonally related immunoglobulin isotypes via RNA
splicing. Blood. 2001;98(4):1174-81.
40. Foà R, Guarini A. A mechanism-driven treatment for chronic lymphocytic leukemia? N Engl J Med. 2013;369(1):85-7.
41. Foà R. Changes in the treatment landscape for chronic lymphoid leukemia. N Engl J Med.
2014;371(3):273-4.
42. Benjamini O, Jain P, Trinh L, et al. Second cancers in patients with chronic lymphocytic leukemia who received frontline fludarabine, cyclophosphamide and rituximab therapy: distribution and clinical outcomes. Leuk Lymphoma. Prepublished on Nov 19, 2014, as
doi:10.3109/10428194.2014.957203.
43. Rossi D, Rasi S, Spina V, et al. Integrated mutational and cytogenetic analysis identifies new
prognostic subgroups in chronic lymphocytic leukemia. Blood. 2013;121(8):1403-12.
44. Baliakas P, Hadzidimitriou A, Sutton LA, et al. Recurrent mutations refine prognosis in
chronic lymphocytic leukemia. Leukemia. 2015;29(2):329-36.
45. Strati P, Keating MJ, O'Brien SM, et al. Eradication of bone marrow minimal residual disease
may prompt early treatment discontinuation in CLL. Blood. 2014;123(24):3727-32.
46. Böttcher S, Ritgen M, Fischer K, et al. Minimal residual disease quantification is an independent predictor of progression-free and overall survival in chronic lymphocytic leukemia: a multivariate analysis from the randomized GCLLSG CLL8 trial. J Clin Oncol.
2012;30(9):980-8.
47. Rossi D, Spina V, Bomben R, et al. Association between molecular lesions and specific B-cell
receptor subsets in chronic lymphocytic leukemia. Blood. 2013;121(24):4902-5.
48. Rossi D, Khiabanian H, Spina V, et al. Clinical impact of small TP53 mutated subclones in
chronic lymphocytic leukemia. Blood. 2014;123(14):2139-47.
49. Eichhorst B, Fink AM, Busch R et al. Frontline chemoimmunotherapy with fludarabine (F), cyclophosphamide (C), and rituximab (R) (FCR) shows superior efficacy in comparison to bendamustine (B) and rituximab (BR) in previously untreated and physically fit patients (pts) with advanced chronic lymphocytic leukemia (CLL): final analysis of an international, randomized study of the German CLL Study Group (GCLLSG) (CLL10 Study) Blood. 2014; 124(21):19.
50. Hillmen P, Robak T, Janssens A, et al. Chlorambucil plus ofatumumab versus chlorambucil alone in previously untreated patients with chronic lymphocytic leukaemia (COMPLEMENT
1): a randomised, multicentre, open-label phase 3 trial. Lancet. 2015;385(9980):1873-83.
TABLES
Table 1. Characteristics of the study cohort a
All cases n=404 With biomarkers n=317
Characteristics Cases % Valid (%) Cases % Valid (%)
Age <65 years 269 66.6 66.6 222 70.0 70.0 Age >65 years 135 33.4 33.4 95 30.0 30.0 Male 274 67.8 67.8 215 67.8 67.8 Female 130 32.2 32.2 102 32.2 32.2 Binet A 43 10.6 10.6 39 12.3 12.3 Binet B 241 59.7 59.7 194 61.2 61.2 Binet C 120 29.7 29.7 84 26.5 26.5 Treatment indication
Development or worsening of anemia and/or thrombocytopenia 79 19.6 19.6 61 19.2 19.2 Massive or progressive symptomatic splenomegaly or lymphadenopathy 234 57.9 57.9 185 58.4 58.4
Lymphocyte doubling time 87 21.5 21.5 70 22.1 22.1
Other 4 1.0 1.0 1 0.3 0.3 Number of FCR courses 6 234 57.9 57.9 195 61.5 61.5 Number of FCR courses <6 170 42.1 42.1 122 38.5 38.5 IGHV Mutated 120 29.7 35.7 108 34.1 34.1 Unnmutated 216 53.5 64.3 209 65.9 65.9 Missing 68 16.8 - - - 13q deletion Absent 206 51.0 65.0 206 65.0 65.0 Present 111 27.5 35.0 111 35.0 35.0 Missing 87 21.5 - - - Trisomy 12 Absent 247 61.1 77.9 247 77.9 77.9 Present 70 17.3 22.1 70 22.1 22.1 Missing 87 21.5 - - - 11q deletion
Absent 256 63.4 80.8 256 80.8 80.8 Present 61 15.1 19.2 61 19.2 19.2 Missing 87 21.5 - - - 17p deletion Absent 287 71.0 90.5 287 90.5 90.5 Present 30 7.4 9.5 30 9.5 9.5 Missing 87 21.5 - - - Response to FCR Complete response 228 56.4 63.9 186 58.7 66.7 Partial response 96 23.8 26.9 75 23.7 26.9 Stable disease 12 3.0 3.3 9 2.8 3.2 Progressive disease 14 3.5 3.9 7 2.2 2.5 Not assessable 7 1.7 2.0 2 0.6 0.7 Missing 47 11.6 38 12.0
Second treatment after FCR 158 39.1 39.1 126 39.7 39.7
No second treatment after FCR 246 60.9 60.9 191 60.3 60.3
Type of second treatment after FCR
Alemtuzumab-based 18 11.4 13.2 15 11.9 14.3 Anti-CD20 8 5.1 5.9 6 4.8 5.7 Anti-CD20+alkylator 28 17.7 20.6 22 17.5 21.0 Anti-CD20+bendamustine 44 27.8 32.4 34 27.0 32.4 Anti-CD20+purine analogue 18 11.4 13.2 13 10.3 12.4 Second line NHL 6 3.8 4.4 5 4.0 4.8 Other 14 8.9 10.3 10 7.9 9.5 Unknown 22 13.9 21 16.7
Second primary malignancy after FCR
Yes 33 8.2 9.6 28 8.8 10.3
No 312 77.2 90.4 243 76.7 89.7
Missing 59 14.6 46 14.5
Cause of death during disease course (including cause of death after disease relapse)
Infection 12 16.7 17.4 10 19.6 20.4
Progressive disease 42 58.3 60.9 31 60.8 63.3
Second primary malignancy 5 6.9 7.2 5 9.8 10.2
Other 9 12.5 13.0 2 3.9 4.1
Unkown 3 4.2 2 3.9
a FCR, fludarabine-cyclophosphamide-rituximab treatment; IGHV, immunoglobulin heavy variable gene; NHL non Hodgkin lymphoma
Table 2. Univariate analysis of PFS and OS a
Characteristics 5-year PFS (%) Median PFS 95% CI p 5-year OS (%) 95% CI p
Age <65 years 46.6 58.1 49.5-66.6 0.0617 86.0 80.9-91.1 0.0001 Age >65 years 42.9 46.5 36.0-56.9 71.0 61.8-80.2 Male 42.7 51.6 43.8-59.3 0.3240 82.1 76.8-87.4 0.7575 Female 50.1 66.2 50.5-82.0 79.4 71.0-87.8 Binet A 59.5 64.7 31.8-96.6 0.0848 94.7 84.7-100.0 0.0172 Binet B+C 43.5 54.3 48.3-60.3 79.8 74.9-84.7 IGHV Mutated 58.6 nr na 0.0005 88.1 80.7-95.5 0.0359 IGHV Unnmutated 36.3 48.2 43.7-52.7 78.4 71.7-85.1 No 13q deletion 45.4 55.6 48.3-62.8 0.9041 82.6 79.5-82.7 0.1742 13q deletition 41.1 50.8 38.6-63.0 82.6 77.6-87.6 No Trisomy 12 45.1 55.6 46.3-64.8 0.6188 84.7 81.8-87.6 0.0245 Trisomy 12 40.3 51.7 44.9-58.6 76.5 70.6-82.4 No 11q deletion 49.4 56.9 47.1-66.6 0.0106 82.5 79.6-85.4 0.9919 11q deletion 18.4 43.5 32.2-54.7 84.3 79.5-90.1 No 17p deletion 48.0 58.9 49.3-68.4 <0.0001 86.0 83.5-88.5 <0.0001 17p deletion 10.9 22.5 8.5-36.4 57.5 47.6-67.4
Table 3. Multivariate analysis of PFSa
Internal bootstrapping validation
Multivariate analysis Bootstrap parameters (mean)
Characteristics HR LCI UCI p HR LCI UCI
Bootstrap selection Age <65 years - - - - 39.4% Age >65 years 1.23 0.87 1.75 0.2323 1.24 0.87 1.78 Binet A - - - - 55.9% Binet B+C 1.57 0.85 2.91 0.1474 1.72 0.88 3.40 IGHV Mutated - - - - 88.0% IGHV Unnmutated 1.65 1.12 2.41 0.0099 1.70 1.15 2.52 No 11q deletion - - - - 88.9% 11q deletion 1.67 1.13 2.46 0.0096 1.67 1.16 2.56 No 17p deletion - - - - 100% 17p deletion 3.72 2.42 5.71 <0.0001 4.04 2.59 6.31
a PFS, progression free survival; IGHV, immunoglobulin heavy variable gene; HR, hazard ratio; LCI, lower confidence interval; UCI upper confidence interval
Shrinkage coefficient: 0.92
Discrimination: bias-corrected c-index: 0.64; optimism: 0.02 Calibration: bias-corrected calibration slope: 0.91; optimism: 0.09
Table 4. Characteristics of the three risk subgroups a Low-risk (n=90) Intermediate-risk (n=197) High-risk (n=30)
Characteristics Cases % Cases % Cases % p
Age <65 years 63 70.0 140 71.1 19 63.3 0.6901 >65 years 27 30.0 57 28.9 11 36.7 Gender Male 53 58.9 140 71.1 22 73.3 0.0974 Female 37 41.1 57 28.9 8 26.7 Stage Binet A 16 17.8 22 11.2 1 3.3 0.0855 Binet B+C 74 82.2 175 88.8 29 96.7 Number of FCR courses 6 53 58.9 127 64.5 15 50.0 0.2635 <6 37 41.1 70 35.5 15 50.0
Time to treatment (median) 26 months 13 months 17 months 0.0038
Treatment indication
Development or worsening of anemia and/or thrombocytopenia 18 20.0 40 20.3 3 10.0
0.4207 Massive or progressive symptomatic splenomegaly or lymphadenopathy 54 60.0 110 55.8 21 70.0
Lymphocyte doubling time 17 18.9 47 23.9 6 20.0
Other 1 1.1 0 0 0 0 IGHV Mutated 90 100 11 5.6 7 23.3 <0.0001 Unnmutated 0 0 186 94.4 23 76.7 13q14 deletion Absent 42 46.7 139 70.6 25 83.3 <0.0001 Present 48 53.3 58 29.4 5 16.7 Trisomy 12 Absent 76 84.4 144 73.1 27 90.0 0.0234 Present 14 15.6 53 26.9 3 10.0 11q deletion
Absent 90 100 138 70.1 28 93.3 <0.0001 Present 0 0 59 29.9 2 6.7 17p deletion Absent 90 100 197 100 0 0 <0.0001 Present 0 0 0 0 30 100
Second primary malignancy after FCR
No 74 96.1 152 87.9 17 81.0
0.0500
Yes 3 3.9 21 12.1 4 19.0
FIGURE LEGENDS
Figure 1. Kaplan-Meier estimates of progression free survival and overall survival of the whole study cohort. Panel A. Progression free survival (PFS) of the whole study cohort. Panel B.
Overall survival (OS) of the whole study cohort (blue line) relative to the expected OS in the age-, sex- and calendar year of treatment-matched general population (black line). p, p-value of the comparison between the observed survival and the expected survival.
Figure 2. Kaplan-Meier estimates of progression free survival according to hierarchically classified chromosomal abnormalities by FISH. Cases harboring 17p deletion independent of
co-occurring chromosomal abnormalities are represented by the red line. Cases harboring 11q deletion, but lacking 17p deletion are represented by the purple line. Cases harboring trisomy 12 but lacking 17p and 11q deletion are represented by the yellow line. Cases harboring 13q deletion, but lacking 17p deletion, 11q deletion and trisomy 12 are represented by the blue line. Cases harboring a normal FISH karyotype are represented by the green line. p values according to the Log-rank statistics
Figure 3. Kaplan-Meier estimates of progression free survival according to 17p deletion among IGHV mutated and IGHV unmutated patients. Panel A. Progression free survival (PFS)
according to 17p deletion status among patients harboring mutated (M) IGHV genes. Cases lacking 17p deletion are represented by the blue line. Cases harboring 17p deletion are represented by the red line. Panel B. Progression free survival (PFS) according to 17p deletion status among patients harboring unmutated (UM) IGHV genes. Cases lacking 17p deletion are represented by the blue line. Cases harboring 17p deletion are represented by the red line. nr, not reached; na, not applicable; p values according to the Log-rank statistics.
Figure 4. Kaplan-Meier estimates of progression free survival according to 11q deletion among IGHV mutated and IGHV unmutated patients. Panel A. Progression free survival (PFS)
according to 11q deletion status among patients harboring mutated (M) IGHV genes. Cases lacking 11q deletion are represented by the blue line. Cases harboring 11q deletion are represented by the red line. Panel B. Progression free survival (PFS) according to 11q deletion status among patients harboring unmutated (UM) IGHV genes. Cases lacking 11q deletion are represented by the blue line. Cases harboring 11q deletion are represented by the red line. nr, not reached; na, not applicable; p values according to the Log-rank statistics.
Figure 5. Decision tree resulting from recursive partitioning analysis and amalgamation. Panel
A. Deletion of 17p and 11q and IGHV mutation status were the factors selected by the algorithm to split the patient population in four terminal nodes according to their progression free survival (PFS). Presence or absence of 17p deletion independent of co-occurring 11q deletion or unmutated IGHV genes was the most significant covariate for the entire study population. Among patients lacking 17p deletion, the most significant covariate was the IGHV mutation status. Among patients lacking both 17p and unmutated IGHV genes, the most significant covariate was 11q deletion. Based on the application of the amalgamation algorithm to the terminal nodes, cases harboring unmutated IGHV genes and cases harboring 11q deletion were grouped into a single category. Covariates are represented from right to left according to their hierarchical order of relevance in splitting the parent node into daughter nodes with significantly different survival probabilities. The p value corresponds to the log-rank test adjusted for multiple comparisons. The right branch of each split represents the presence of the lesion. The left branch of each split represents the absence of the lesion. The Kaplan-Meier curves estimate the PFS of patients belonging to each terminal node. n, number of
patients in the node. Panel B. The bars represent the variable importance measure for the random survival forest model.
Figure 6. Kaplan-Meier estimates of progression free survival and overall survival according to the model based on 17p deletion, 11q deletion and IGHV mutation status. Panel A.
Progression free survival (PFS). Panel B. Overall survival (OS). Cases harboring 17p deletion independent of co-occurring 11q deletion or unmutated IGHV genes are represented by the red line. Cases harboring unmutated IGHV genes and/or 11q deletion in the absence of 17p deletion are represented by the yellow line. Cases harboring mutated IGHV genes in the absence of 11q and 17p deletion are represented by the blue line. The black line represents the expected OS in the age-, sex- and calendar year of treatment-matched general population. nr, not reached; na, not applicable; p values according to the Log-rank statistics.
Figure 7. Kaplan-Meier estimates of progression free survival and overall survival according to the model based on 17p deletion, 11q deletion and IGHV mutation status, and including cases lacking biological information. Panel A. Progression free survival (PFS). Panel B. Overall
survival (OS). Cases harboring 17p deletion independent of co-occurring 11q deletion or unmutated IGHV genes are represented by the red line. Cases harboring unmutated IGHV genes and/or 11q deletion in the absence of 17p deletion are represented by the yellow line. Cases harboring mutated IGHV genes in the absence of 11q and 17p deletion are represented by the blue line. Cases lacking biological information are represented by the green line. nr, not reached; na, not applicable.
Figure 8. Kaplan-Meier estimates of time to progression (TTP) according to the model based on 17p deletion, 11q deletion and IGHV mutation status. Cases harboring 17p deletion
independent of co-occurring 11q deletion or unmutated IGHV genes are represented by the red line. Cases harboring unmutated IGHV genes and/or 11q deletion in the absence of 17p deletion are
represented by the yellow line. Cases harboring mutated IGHV genes in the absence of 11q and 17p deletion are represented by the blue line. nr, not reached; na, not applicable; p values according to the Log-rank statistics.
Figure 9. Hazard of progression in relation to the time elapsed from FCR treatment start.
Cases harboring 17p deletion independent of co-occurring 11q deletion or unmutated IGHV genes are represented by the red line. Cases harboring unmutated IGHV genes and/or 11q deletion in the absence of 17p deletion are represented by the yellow line. Cases harboring mutated IGHV genes in the absence of 11q and 17p deletion are represented by the blue line.
Figure 10. Kaplan-Meier estimates of progression free survival (PFS) according to number of FCR courses among patient belonging to the low-, intermediate- and high- risk subgroups.
Cases that received 6 courses are represented by the blue line. Cases received <6 courses are represented by the red line. nr, not reached; na, not applicable; p values according to the Log-rank statistics.
FIGURES Figure 1 Months C u m u la ti ve p ro b ab il ity o f PF S (% ) 0 12 24 36 48 60 72 84 96 108 120 0 20 40 60 80 100 Months C u m u la ti ve p ro b ab il ity o f O S (% ) 0 20 40 60 80 100 0 12 24 36 48 60 72 84 96 108 120
Events 5-year 10-year N Observed Expected OS (%) relative OS (%) OS (%) relative OS (%) p 404 72 17.5 81.2 85.3 61.8 68.7 <.0001 Events Total Median PFS 95% CI
194 404 54.8 49.2-60.4 404 341 291 242 138 56 35 20 9 4 1 No.$at$risk$ No.$at$risk$ 404 376 353 321 210 119 81 53 27 12 2 A B Figure 1
Figure 2
Figure 3
17p deletion
p<0.0001
Events Total Median PFS 95% CI
30 79 66.2 41.1-91.2 34 89 77.0 49.7-104.2 26 60 54.6 54.6-60.9 34 59 47.5 35.5-59.5 27 30 22.5 8.5-36.4 79 72 62 53 26 10 6 2 2 1 0 89 81 73 60 41 18 14 11 5 2 0 60 50 44 40 27 7 2 1 0 0 0 59 53 41 32 13 3 2 1 0 0 0 30 17 13 6 5 3 1 1 1 1 1 11q deletion Trisomy 12 Normal 13q deletion No. at risk 101 96 81 68 43 15 9 5 2 0 0 7 3 3 2 2 1 1 1 1 1 1
Events Total Median PFS 95% CI
30 101 nr na
6 7 10.5 2.9-18.1
p<0.0001
Events Total Median PFS 95% CI
94 186 51.7 45.6-57.7 21 23 22.5 1.2-43.7 No. at risk 186 160 139 117 56 23 15 9 5 3 0 23 14 10 4 3 2 0 0 0 0 0 p<0.0001 IGHV M – No 17p deletion
IGHV M – 17p deletion IGHV UM – No 17p deletionIGHV UM – 17p deletion
No. at risk
A B
Figure 4
97 89 76 65 42 16 10 6 3 1 1
11 10 8 5 3 0 0 0 0 0 0
Events Total Median PFS 95% CI
28 97 nr na
8 11 34.5 9.2-59.7
p=0.0077
Events Total Median PFS 95% CI
87 159 50.6 43.3-57.9 28 50 43.5 33.1-53.8 159 130 115 95 49 22 13 9 5 3 0 50 44 34 27 10 3 2 0 0 0 0 p=0.3006 IGHV M – No 11q deletion
IGHV M – 11q deletion IGHV UM – No 11q deletionIGHV UM – 11q deletion
No. at risk No. at risk
A B
Figure 5 del17 p < 0.001 1 !0 "0 IGHV p = 0.004 2 !0 "0 del11 p = 0.012 3 !0 "0 Node 4 (n = 90) 0 20 40 60 80 100 120 0 0.2 0.4 0.6 0.8 1 Node 5 (n = 11) 0 20 40 60 80 100 120 0 0.2 0.4 0.6 0.8 1 Node 6 (n = 186) 0 20 40 60 80 100 120 0 0.2 0.4 0.6 0.8 1 Node 7 (n = 30) 0 20 40 60 80 100 120 0 0.2 0.4 0.6 0.8 1 No Pr o g re ss io n fr ee survival (% ) del17p p<0.001 Yes No Yes No Yes IGHV UM p=0.004 del11q p=0.004
Months Months Months Months
IGHV UM and/or del11q
0 0,01 0,02 0,03 0,04 0,05 0,06 0,07 0,08 del11q IGHV UM del17p Variable importance A B Figure 2
Figure 6 Months C u m u la ti ve p ro b ab il ity o f O S (% ) 0 20 40 60 80 100 0 12 24 36 48 60 72 84 96 108 120 Months C u m u la ti ve p ro b ab il ity o f PF S (% ) 0 20 40 60 80 100 0 12 24 36 48 60 72 84 96 108 120 90 86 73 63 40 15 9 5 2 0 0 197 170 147 122 59 23 15 9 5 3 0 30 17 13 6 5 3 1 1 1 1 1
Events Total Median PFS 95% CI
22 90 nr na 102 197 51.7 46.1-57.2
27 30 22.5 8.5-36.4
No.$at$risk$
Events Total 5-years OS 95% CI
5 90 91.4 87.1-95.7 32 197 83.2 80,0-86.4 14 30 57.5 47.6-67.4 No.$at$risk$ 90 87 82 74 50 22 12 6 2 0 0 197 189 175 160 96 63 45 33 19 9 1 30 25 25 23 15 10 7 3 2 1 1 p - 0.0001 <0.0001 0.0001 - <0.0001 <0.0001 <0.0001 - p - 0.0341 <0.0001 0.0341 - 0.0004 <0.0001 0.0004 - 17p deletion
IGHV unmutated and/or 11q deletion IGHV mutated
17p deletion
IGHV unmutated and/or 11q deletion IGHV mutated
Events 5-year N Observed Expected OS (%) relative OS (%) p
90 5 3.0 91.4 95.8 .2770 197 32 8.7 83.2 87.2 <.0001
30 14 1.5 57.5 60.2 <.0001
A B
Figure 3 Pairwise comparisons Pairwise comparisons
Figure 7
90 86 73 63 40 15 9 5 2 0 0
197 170 147 122 59 23 15 9 5 3 0
30 17 13 6 5 3 1 1 1 1 1
87 68 58 51 34 15 10 5 1 0 0
Events Total Median PFS 95% CI
22 90 nr na
102 197 51.7 46.1-57.2
27 30 22.5 8.5-36.4
43 87 59.6 32.9-86.3
No. at risk
Events Total 5-years OS 95% CI
5 90 91.4 87.1-95.7 32 197 83.2 80,0-86.4 14 30 57.5 47.6-67.4 21 87 75.1 65.2-85.0 No. at risk 90 87 82 74 50 22 12 6 2 0 0 197 189 175 160 96 63 45 33 19 9 1 30 25 25 23 15 10 7 3 2 1 1 87 75 71 64 49 24 17 11 4 2 0 17p deletion
IGHV unmutated and/or 11q deletion IGHV mutated
17p deletion
IGHV unmutated and/or 11q deletion IGHV mutated
A B
Figure 8S
Figure 8
90 86 72 63 39 14 9 4 1 0 0
197 168 147 118 54 23 14 8 5 1 0
30 17 12 6 5 3 1 1 1 1 0
Events Total Median PFS 95% CI
20 90 nr na
97 197 53.5 47.7-59.4
27 30 22.1 8.4-35.8
No. at risk
17p deletion
IGHV unmutated and/or 11q deletion IGHV mutated
Figure 9
Figure 10
IGHV M - 6 courses
IGHV M - <6 courses IGVH UM and/or 11q deletion - 6 coursesIGVH UM and/or 11q deletion - <6 courses 17p deletion- 6 courses17p deletion- <6 courses
Events Total Median PFS 95% CI
8 53 nr na 14 37 nr na 53 53 48 42 30 12 7 5 2 0 0 37 33 25 21 10 3 2 0 0 0 0 No. at risk 127 121 104 92 44 19 13 8 4 3 0 70 49 43 30 19 4 2 1 1 0 0 15 11 7 3 3 2 1 1 1 1 1 15 6 6 3 2 1 1 0 0 0 0
Events Total Median PFS 95% CI
57 127 58.9 52.9-64.8
45 70 36.2 30.5-41.8
Events Total Median PFS 95% CI
14 15 22.5 4.1-40.8
13 15 24.0 0-51.8
No. at risk No. at risk
p=0.0040 p<0.0001 p=0.5790
Figure 10S
Low-risk Intermediate-risk High-risk
0 10 20 30 40 50 60 0. 000 0. 005 0. 010 0. 015 0. 020 0. 025
Follow-up time (months)
H aza rd R at e Months IGHV M
IGHV UM and/or11q deletion
17p deletion H aza rd of progression Figure 4