Proceedings
Addition of Orange by-products (dry peel) in Orange
Jam: Evaluation of Physicochemical Characteristics,
Bioactive Compounds and Antioxidant Activity
†
Vincenzo Sicari 1,*, Monica Rosa Loizzo 2, Rosa Romeo 1, Mariarosaria Leporini 2, Rosa Tundis 2
and Marco Poiana 1
1 Department of Agraria, University “Mediterranea” of Reggio Calabria, Salita Melissari, 89124 Feo di Vito, Reggio Calabria (RC), Italy; [email protected] (R.R.); [email protected] (M.P.)
2 Department of Pharmacy, Health and Nutritional Sciences, University of Calabria, 87036 Arcavacata di Rende (CS), Italy; [email protected] (M.R.L.); [email protected] (M.L.); [email protected] (R.T.)
* Correspondence: [email protected]; Tel.: +3909651694370
† Presented at the 1st International e-Conference on Antioxidants in Health and Disease, 01–15 December 2020; Available online: https://cahd2020.sciforum.net/.
Published: 30 November 2020
Abstract: The aim of the present study was to assess the effect of treatment and storage period on
the nutritional quality of enriched orange jam during storage for 90 days at 15 °C and 30 °C. The jam was produced by traditional technique (TP) and with addition of orange peel (OP). All samples were evaluated for pH, total solid soluble, acidity, total phenolic content, total carotenoid content and antioxidant activity(DPPH and ABTS assay). The mean values at T0 of total soluble solids, titratable acidity and pH of jam samples (TP) were found as 63.03 °Brix, 0.60% and 3.51 respectively. While, the values for OP were 65.11 °Brix, 0.61% and 3.68 respectively. The polyphenols ranged from 83.44 to 126.22 mg/100 g for control samples and from 125.12–171.02 mg/100 g for enriched jam. As regards temperature storage, the enriched jam stored at 15 °C maintained the better analytical parameters than the samples stored at 30 °C. The results obtained from the experimentation show that use of orange peels in orange jam preserved the functional characteristics during storage.
Keywords: citrus by-product; orange jam; bioactive compounds; antioxidant activity
1. Introduction
The genus Citrus of the family Rutaceae includes several important fruits such as oranges, mandarins, limes, lemons, sour orange, and grapefruits. Citrus fruits are one of the important crops, with worldwide production of over 80 million tons per year [1].
Citrus fruits are an important source of bioactive compounds. In particular, citrus peels contain significant amounts of phenolic compounds especially phenolic acids and flavonoids [2].
Citrus by-products are secondary product derived from the industrial process of citrus fruits and constitute about 50% of fresh fruit weight [3,4].
Citrus peel is a very much sought after product in the citrus industry. The most important component of citrus peel is hesperidina, but peel also contains other bioflavonoids, as naringin,
diosmin, and neohesperidin. Furthermore, citrus peel contains pectin and has a high vitamin content [5].
A modern industry for the production of citrus derivatives must fully exploit the fruit with the production of all possible derivatives. In the production process of citrus derivatives, such as essence and juice, the peels are a production waste [3].
Orange jam, among other orange derivatives, is a viable alternative to the economic exploitation of fruits, adding value to the fruit and promoting access to its beneficial constituents for the entire year. Adding the orange peel will enhance the flavor of the jam and it will also act as a natural thickening agent.
Considering the large amounts of by-products derived from orange processing, which are generally discarded, the present study aimed to explore the feasibility of using dry (Citrus x sinensis) peel for orange jam production and to evaluate the shelf life of the product.
2. Experiments
2.1. Preparation Orange Jam
Orange fruits Navel variety were bought from a local market and, after washing the oranges with warm water, to remove all impurities, were manually peeled using a potato peeler, eliminating the albedo and flavedo. The peels were dried in the sun and then ground with a laboratory blender.
Jam was produced according to the traditional method using oranges as a raw material. The formulation consisted of oranges pulp, sugar and pectin.Two types of jam were prepared: one with traditional pectin (TP) and one with orange peel (OP). When the total soluble solids reached 60 °Brix, then the orange peel (3%) and commercial pectin were added. Then the mixture was cooked until the total soluble solids reached 67 °Brix.
Both jams were boiled for 30 min before placed in 300 mL glass jars. Afterwards, the jam jars were pasteurized at 65 °C for 30 min.
The jams were divided into two groups: one stored at 15 °C, and other at 30 °C. All samples were stored for a total of 90 days. An analytical determination was carried out every 15 days.
2.2. Chemical Analysis of Orange Jam
2.2.1. pH, Acidity and Total Soluble Solids
The pH was measured in sample juices by pH meter (Basic Model 20, Crison) and the total titratable acidity (TA) was assessed by titration with NaOH (0.1 N) to pH 8.1 and expressed as citric acid %. The soluble solids total (SST) in the jam was estimated by a digital refractometer PR-201α (Atago, Tokyo, Japan) and expressed as °Brix at 20 °C.
2.2.2. Total Phenolic and Carotenoid Content
The total phenolic content of Citrus fruit juices was determined by the Folin-Ciocalteu method [6] [22]. An aliquot of 500 μL of juice was mixed with 1ml of Folin-Ciocalteu reagent and 10 mL of 20% Na2CO3. The absorbance was measured at λ = 760 nm using a UV-Vis Agilent 8453
spectrophotometer (Agilent Technologies, Italy) after 2 h in the dark. The results were expressed as gallic acid equivalents (GAE) in mg/100 mL.
The total carotenoid content (TCC) was determined as previously described [7]. Briefly, extract was added to NaCl 5% solution, vortexed for 30 s and centrifuged at 4500 rpm for 10 min. The supernatant (100 μL) was diluted with 0.9 mL of n-hexane and measured at 460 nm. TCC was expressed as mg β carotene equivalents/g FW.
2.2.3. Antioxidant Activity DPPH
The 1st International Electronic Conference on Antioxidants in Health and Disease, 1–15 December 2020
The antioxidant activity was determined using DPPH free radical assay [8]. An aliquot of 2.5 mL of 0.06 mM DPPH methanolic solution was added to 50 μL of orange jam. The absorbances at t0 and t5 were measured at λ = 515 nm using a UV-Vis Agilent 8453 spectrophotometer (Agilent Technologies, Italy). The results were expressed according the following equation:
(%) Inhibition = (1 − Af/A0) × 100
where Af = absorbance DPPH fruit juice at t = 5 min and A0 = absorbance DPPH (control) at t = 0 min. All tests were run in triplicate and the results expressed as means ± standard deviation (SD). Trolox was used as a standard antioxidant and juice activity was expressed in mM of Trolox equivalents.
ABTS
The radical scavenging capacity of the samples for the ABTS (2,2′-azinobis-3-ethylbenzothiazoline-6-sulfonate) radical cation was determined as described by Re et al. [9]. ABTS was generated by mixing 7 mM of ABTS and K2S2O8 (potassium persulfate) 140 mM. followed by
storage in the dark at room temperature for 16 h before use. The mixture was diluted (1:80) with ethanol to give an absorbance at 734 nm using the spectrophotometer. Each sample was diluted with 100 μL of was allowed to react with fresh ABTS solution (900 μL), and then the absorbance was measured 6 min after initial mixing. All measurements were performed in triplicate.
Statistical Analysis
All the experiments were conducted in triplicate, and the results were given as mean value ± standard deviation.Analysis of variance was performed by ANOVA and
t
he difference between the means were analysed using Tukey test.3. Results
The pH value is significant indicator factor to obtain optimum gel condition. Table 1 shows the changes in pH values for jam prepared with traditional pectin (TP) and orange peel (OP) during storage at the two different temperatures
Changes in Ph values of pH for TP and OP at different temperatures during storage are presented inTable 1. It can be said that pH values decreased significantly (p < 0.01) during storage regardless of storage temperature. The samples added with orange peel shown a ph values ranged from 3.61 and 3.41. In contrast the traditional jam shown a highest ph values ranged from 3.68 and 3.51 at the end of storage.
Table 1. pH of orange jam during storage at different temperature.
Time Storage (Days)
0 15 30 45 60 75 90 Sign . TP 15 °C 3.51 ± 0.71 cA 3.41 ± 1.02 cD 3.45 ± 0.24 cC 3.48 ± 0.11 cB 3.51 ± 0.63 aA 3.50 ± 0.44 cAB 3.4 2 ± 0.3 6 bD ** OP 15 °C 3.68 ± 0.11 aA 3.59 ± 1.44 aB 3.51 ± 0.62 bC 3.56 ± 0.20 aB 3.53 ± 0.58 aB 3.53 ± 0.67 abB 3.4 9 ± 0.5 7 aC ** TP 30 °C 3.61 ± 0.23 bA 3.49 ± 0.98 bB 3.42 ± 0.49 dE 3.51 ± 0.52 bBC 3.52 ± 0.67 aD 3.51 ± 0.83 bcCD 3.4 1 ± 0.7 7 bE ** OP 30 °C 3.68 ± 0.27 aA 3.61 ± 0.77 aB 3.58 ± 0.82 aC 3.57 ± 0.37 aCD 3.54 ± 0.43 aE 3.55 ± 0.81 aDE 3.5 1 ± 0.8 **
Sign. ** ** ** ** n.s. ** ** Data are presented as means ± standard deviations. Means followed by different capital letters in a row and different lowercase letters in a column are significantly different by Tukey HSDa test. ** Significance at p < 0.01.
As can be seen in Figure 1, the addition of orange peel to jam affected the content of TSS. In particular, TSS values examination ranged from 63.03–63.55 °Brix for TP at 15 °C and 63.03–64.89 °Brix at 30 °C. While, TSS values fluctuated from 65.11–65.23 °Brix for OP at 15 °C and 65.11–66.33 °Brix at 30 °C.
Figure 1. Total solid soluble (TSS) of orange jam during storage at different temperature.
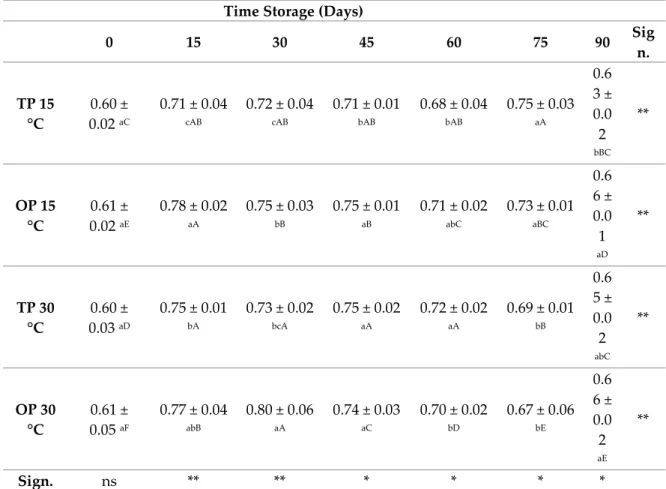
According to Ph values, all samples shown an increase of Ph values during storage (Table 3). The acidity (TA) value of jam achieved higher value (0.70%), while jam had lower value (0.60%).
Table 3. Titratable acidity (g/100g acid citric) of orange jam during storage at different temperature.
Time Storage (Days)
0 15 30 45 60 75 90 Sig n. TP 15 °C 0.60 ± 0.02 aC 0.71 ± 0.04 cAB 0.72 ± 0.04 cAB 0.71 ± 0.01 bAB 0.68 ± 0.04 bAB 0.75 ± 0.03 aA 0.6 3 ± 0.0 2 bBC ** OP 15 °C 0.61 ± 0.02 aE 0.78 ± 0.02 aA 0.75 ± 0.03 bB 0.75 ± 0.01 aB 0.71 ± 0.02 abC 0.73 ± 0.01 aBC 0.6 6 ± 0.0 1 aD ** TP 30 °C 0.60 ± 0.03 aD 0.75 ± 0.01 bA 0.73 ± 0.02 bcA 0.75 ± 0.02 aA 0.72 ± 0.02 aA 0.69 ± 0.01 bB 0.6 5 ± 0.0 2 abC ** OP 30 °C 0.61 ± 0.05 aF 0.77 ± 0.04 abB 0.80 ± 0.06 aA 0.74 ± 0.03 aC 0.70 ± 0.02 bD 0.67 ± 0.06 bE 0.6 6 ± 0.0 2 aE ** Sign. ns ** ** * * * *
The 1st International Electronic Conference on Antioxidants in Health and Disease, 1–15 December 2020 Data are presented as means ± standard deviations. Means followed by different capital letters in a row and different lowercase letters in a column are significantly different by Tukey HSDa test. ** Significance at p < 0.01.
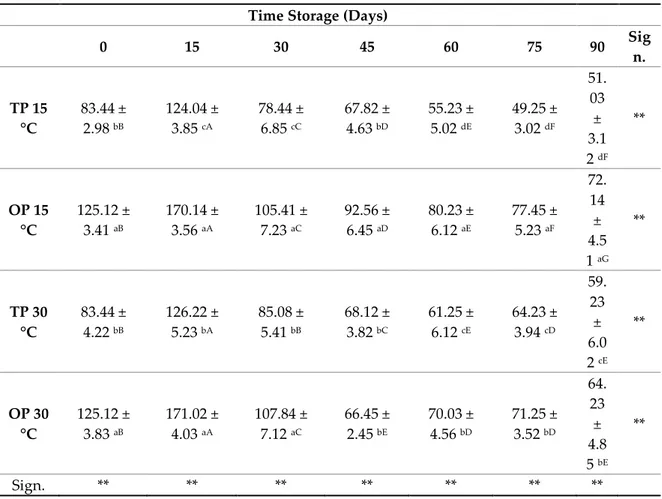
The change in total polyphenols values after treatments and during storage is reported in Table 4. Total polyphenol content at T0 was 83.44 mg/100 g and 125.12 mg/100 g for jam TP and OP, respectively. At the end of storage (90 days),the samples added with orange peel shown the best results in terms of plyphenols contents regardless of storage temperature
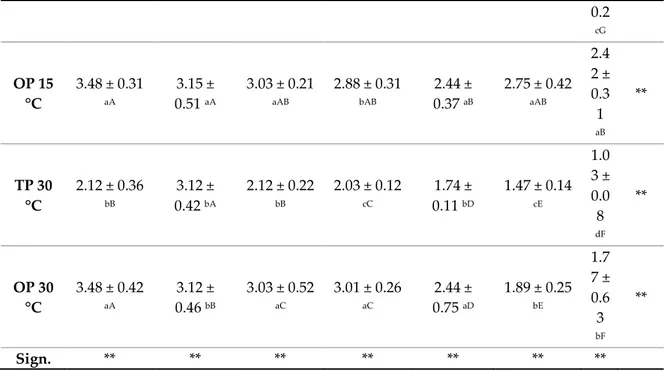
The effect of storage on the total carotenoid content is shown in Table 5.Before storage were 2.12 μg/g and 3.48 μg/g for TP and OP, respectively. The total carotenoids showed a declining trend for all stored samples. The concentration of total carotenoids decreased by 1.14 μg/g and 1.03 μg/g, respectively when orange jam (TP) was stored at 15 °C and 30 °C for 90 days. While, the concentration decresed by 2.42μg/g and 1.77 μg/g, respectively when OP samples was stored at 15 °C and 30 °C for 90 days.
Table 4. Total polyphenol content (mg GAE/100 g) in orange jam with different temperatures and
time storage.
Time Storage (Days)
0 15 30 45 60 75 90 Sig n. TP 15 °C 83.44 ± 2.98 bB 124.04 ± 3.85 cA 78.44 ± 6.85 cC 67.82 ± 4.63 bD 55.23 ± 5.02 dE 49.25 ± 3.02 dF 51. 03 ± 3.1 2 dF ** OP 15 °C 125.12 ± 3.41 aB 170.14 ± 3.56 aA 105.41 ± 7.23 aC 92.56 ± 6.45 aD 80.23 ± 6.12 aE 77.45 ± 5.23 aF 72. 14 ± 4.5 1 aG ** TP 30 °C 83.44 ± 4.22 bB 126.22 ± 5.23 bA 85.08 ± 5.41 bB 68.12 ± 3.82 bC 61.25 ± 6.12 cE 64.23 ± 3.94 cD 59. 23 ± 6.0 2 cE ** OP 30 °C 125.12 ± 3.83 aB 171.02 ± 4.03 aA 107.84 ± 7.12 aC 66.45 ± 2.45 bE 70.03 ± 4.56 bD 71.25 ± 3.52 bD 64. 23 ± 4.8 5 bE ** Sign. ** ** ** ** ** ** **
Data are presented as means ± standard deviations. Means followed by different capital letters in a row and different lowercase letters in a column are significantly different by Tukey HSDa test. ** Significance at p < 0.01.
Table 5. Carotenoid content (μg/g) in orange jam during storage at different temperatures.
Time Storage (Days)
0 15 30 45 60 75 90 Sig n. TP 15 °C 2.12 ± 0.218 bB 2.61 ± 0.46 cA 1.91 ± 0.37 cC 1.57 ± 0.17 dD 1,35 ± 0.11 cE 1.22 ± 0.10 dF 1.1 4 ± **
0.2 cG OP 15 °C 3.48 ± 0.31 aA 3.15 ± 0.51 aA 3.03 ± 0.21 aAB 2.88 ± 0.31 bAB 2.44 ± 0.37 aB 2.75 ± 0.42 aAB 2.4 2 ± 0.3 1 aB ** TP 30 °C 2.12 ± 0.36 bB 3.12 ± 0.42 bA 2.12 ± 0.22 bB 2.03 ± 0.12 cC 1.74 ± 0.11 bD 1.47 ± 0.14 cE 1.0 3 ± 0.0 8 dF ** OP 30 °C 3.48 ± 0.42 aA 3.12 ± 0.46 bB 3.03 ± 0.52 aC 3.01 ± 0.26 aC 2.44 ± 0.75 aD 1.89 ± 0.25 bE 1.7 7 ± 0.6 3 bF ** Sign. ** ** ** ** ** ** **
Data are presented as means ± standard deviations. Means followed by different capital letters in a row and different lowercase letters in a column are significantly different by Tukey HSDa test. ** Significance at p < 0.01.
The antioxidant activity of jam prepared with traditional pectin (TP) and orange peel (OP) was investigated.
In DPPH assay (Figure 2), the jam prepared with traditional pectin (TP) showed values ranging from 94.21 to 33.02 (% I) at 15 °C and 94.21 to 22.45 at 30 °C. In particular, it was observed that during storage of jams to reduce antioxidant capacity. The same trend was observed for jams prepared with addition orange peel (OP). In fact, values ranging from 119.06 to 48.03 (% I) at 15 °C and 119.06 to 31.56 at 30 °C.
In both cases, the jam stored at 15 °C showed a higher antioxidant activity and among the latter, the jam prepared with the addition of orange peels had the highest value (Figure 2).
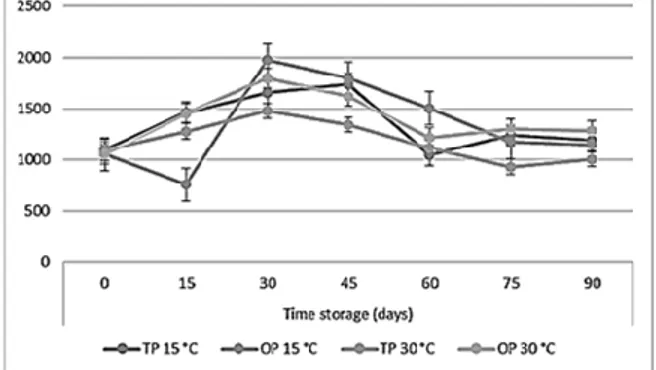
The same trend observed was observed with the ABTS test (Figure 3). In particular, an increase was observed for the first 60 days then decreased.
The 1st International Electronic Conference on Antioxidants in Health and Disease, 1–15 December 2020
Figure 3. ABTS° in orange jam during storage at different temperatures.
4. Discussion
Jams pH did not differ from each other (p > 0.01), which guarantees the stability of the product [10].
The addition of OP increased TA and TSS (p < 0.01). The highest TSS values detected for added samples(OP) could be linked to highest amount of pectina of orange peel. As previous studies reported [11], the increase of TSS depends on the formation of hydrogen bridges between sugars and citric and on the degradation of sucrose in glucose and fructose.
In addition, the formation of acids resulting to degradation of polysaccharides, the oxidation of reducing sugars and also the degradation of pectic and uronic acid could determine the increase of titrable acidity [4,12]. It was observed that the addition of orange peels to the jam resulted in an increase in antioxidant activity. This is due to the fact that the peel is rich in essential oil which contains bioactive molecules. Similar results were observed in fruit peel added jamelao [13].
Nevrethless, all samples showed an antioxidant activity in a concentration-dependent manner. Storage time and temperature affected the content of bioactive compounds as well as the antioxidant activity. Literature data reported that the decrease of bioactive compounds over time is due to odidation and polymerisation reactions. At the same time, the changes in antioxidant activity may be caused by a degradation or chemical alteration of product during storage [14]. the obtained results confirmed that the addition of OP improved the nutritional profile of orange jam. Furthermore, bioactive substances such as ascorbic acid, carotenoids, and phenolic compounds have antioxidant activity, adding potential functional properties to the product.
5. Conclusions
In this work, the orange peel was added to an orange jam. Product stability, and the antioxidant effect on storage time were investigated. The enriched samples (OP) show a slow decrease of all examined parameters. In fact, the addition of orange peel to jam slow down the oxidation. The obtained data show that the addition of orange peels is a valid alternative to pectin. Furthermore, the by-products of citrus fruits can be used as nutraceutical resources.
Author Contributions: V.S. carried out the overall project design experimental work, M.R.L., R.R., R.T., and
M.L. analysed results and wrote the manuscript. M.L. and R.R. assisted with experimental work. M.P., R.T., M.R.L. and V.S conceptualized aspects of the project and assisted with reviewing and editing the manuscript. All authors read and agree to the published version of the manuscript.
Conflicts of Interest: The authors declare no conflict of interest.
Abbreviations
TP traditional pectin
OP orange peel
TA Titratable acidity
DPPH 2,2-Diphenyl-1-picrylhydrazyl
ABTS 2,2′-azinobis (3-ethylbenzothiazoline-6-sulfonic acid) diammonium salt
References
1. Diomi Mamma, D.; Christakopoulos, P. Biotransformation of Citrus By-Products into Value Added Products. Waste Biomass Valori. 2014, 5, 529–549.
2. Sicari, V.; Pellicanò, T.M.; Giuffrè, A.M.; Zappia, C.; Capocasale, M. Bioactive compounds and antioxidant activity of citrus juices produced from varieties cultivated in Calabria. Food Meas. 2016, 10, 773–780. doi:10.1007/s11694-016-9362-8.
3. Mirabella, N.; Castellani, V.; Sala, S. Current options for the valorization of food manufacturing waste: A review. J.Clean. Prod. 2014, 65, 28–41.
4. Wang, Y.-C.; Chuang, Y.-C.; Hsu, H.-W. The Flavonoid, Carotenoid and Pectin Content in Peels of Citrus Cultivated in Taiwan. Food Chem. 2008, 106, 277–284.
5. Rafiq, S.; Kaul, R.; Sofi, S.A.; Bashir, N.; Nazir, F.; Nayik, G.A. Citrus peel as a source of functional ingredient: A review. J. Saudi Soc. Agric. Sci. 2018, 17, 351–358. doi:10.1016/j.jssas.2016.07.006.
6. Singleton, V.L.; Orthofer, R.; Lamanuela-Raventòs, Rm. 1999. Analysis of total phenols and other oxidation substrates and antioxidants by means of folin-ciocalteu reagent. Meth. Enzymol. 1999, 299C, 152–178. 7. Rodriguez-Amaya, D.B.; Kimura, M. Handbook for Carotenoid Analysis; International Food Policy Research
Institute (IFPRI) and International Center for Tropical Agriculture (CIAT): Washington, DC, USA, 2004. 8. Brand-Williams, W.; Cuvelier, M.; Berset, E.C. Use of a free radical method to evaluate antioxidant activity.
LWT-Food Sci. Technol. 1995, 28, 25–30.
9. Re, R.; Pellegrini, N.; Proteggente, A.; Pannala, A.; Yang, M.; Rice-Evans, C. 1999. Antioxidant activity applying an improved ABTS radical cation decolarization assay. Free Radic. Biol. Med. 1999, 26, 1231–1237. 10. Touati, N.; Tarazona-Diaz, M.P.; Aguayo, E.; Louaileche, H. Effect of storage time and temperature on the
physicochemical and sensory of commercial apricot jam. Food Chem. 2014, 145, 23–27.
11. Teixeira, F.; Santos, B.A.; Nunes, G.; Soares, J.M.; Amaral, L.A.; Souza, G.H.O.; Resende, J.T.V.; Menegassi, B.; Rafacho, B.P.M.; Schwarz, K.; et al. Addition of Orange Peel in Orange Jam: Evaluation of Sensory, Physicochemical, and Nutritional Characteristics. Molecules 2020, 25, 1670.
12. Rashid, F.; Kausar, T.; Qureshi, T.M.; Hussain, S.; Nadeem, M.; Ainee, A.; Zahra, S.M. Physico-chemical and sensory properties of orange marmalade supplemented with aloe Vera powder. J. Agric. Res. 2014, 52, 561–568.
13. Kamiloglu, S.; Pasli, A.A.; Ozcelik, B.; Van Camp, J.; Capanoglu, E. Influence of different processing and storage conditions on in vitro bioaccessibility of polyphenols in black carrot jams and marmalades. Food
Chem. 2015, 186, 74–82.
14. Tobal, T.M.; Rodrigues, L.V. Effect of storage on the bioactive compounds, nutritional composition and sensory acceptability of pitanga jams. Food Sci. Tech. 2019, 39, 581–587.
Publisher’s Note: MDPI stays neutral with regard to jurisdictional claims in published maps and institutional
affiliations.
© 2020 by the authors. Licensee MDPI, Basel, Switzerland. This article is an open access article distributed under the terms and conditions of the Creative Commons Attribution (CC BY) license (http://creativecommons.org/licenses/by/4.0/).