PAPER
SUMMARY
Whether the insulin resistance commonly observed in patients with inflammatory arthritis is a disease-specific feature and/or is limited to a disease phase (i.e., it occurs only during phases of high disease activity) is un-known.
Fifty-three rheumatoid arthritis (RA) and 44 psoriatic arthritis (PsA) patients were recruited consecutively along with 194 controls matched for age, sex and body mass index for a case-control study. All underwent an oral glucose tolerance test, the results of which were analysed to derive the following indexes: homeo-static model of insulin resistance (HOMA-IR), insulin sensitivity index (ISI) and early insulin sensitivity index (EISI). These data were related to anthropometric, clinical and laboratory findings.
Metabolic parameters of patients and controls were similar. Neither inflammatory markers nor disease activity scores were related to glucose metabolism for the generality of RA and PsA patients; however, by restricting the analysis to the subset of RA patients with residual disease activity, an association emerged between erythrocyte sedimentation rate, on the one hand, and fasting insulin (β=0.46, p=0.047) and HOMA-IR (β=0.44, p=0.02), on the other. Moreover, C-reactive protein (CRP) levels were associated with plasma glucose and insulin levels measured 120 min after the glucose load (β=0.91, p=0.0003 and β=0.77, p=0.0006, respectively); ISI and EISI were predicted by CRP (β=-0.79, p=0.0006; β=-0.80, p=0.0001, respectively). The same did not hold true for PsA patients.
The association between systemic inflammation and insulin resistance indexes is a feature of RA with residual disease activity, not a universal feature of inflammatory arthritides.
Key words: Insulin sensitivity; Insulin resistance; Rheumatoid arthritis; Psoriatic arthritis; Oral glucose toler-ance test.
Reumatismo, 2018; 70 (4): 232-240
n INTRODUCTION
C
omorbidities, including diabetes, have become a hot topic in the management of inflammatory arthritis (1). In this regard, an association has been reported between inflammation and insulin resistance in rheumatoid arthritis (RA) and psoriatic ar-thritis (PsA) (2, 3). Since insulin resistance is one of the major drivers of cardiovascu-lar diseases, which in turn are responsible for a significant morbidity and mortality burden among patients withinflammato-ry arthritis (4), this proposed association may have important clinical implications. First and foremost, it would support the hypothesis that better disease control may extend its benefits on cardiovascular health. Indeed, both classical and biologi-cal disease modifying anti-rheumatic drugs (DMARDs) improve insulin sensitivity (5, 6), confirming that activation of inflamma-tory pathways may impair insulin action. The mechanisms linking insulin resistance and inflammatory arthritis are debated, however, and very limited data on insulin
Corresponding author: Mattia Bellan Department of Translational Medicine Università del Piemonte Orientale UPO Via Solaroli, 17 - 28100 Novara (NO), Italy E-mail: [email protected]
Inflammatory markers predict insulin
sensitivity in active rheumatoid arthritis
but not in psoriatic arthritis
M. Bellan1-3, S. Bor1, A. Gibbin1,2, A. Gualerzi1,2, S. Favretto1,2, G. Guaschino1,2,
R. Bonometti1,2, A. Rossini2, D. Sola1,2, R. Pedrazzoli2, G.P. Carnevale Schianca2,
M. Pirisi1,2,4, P.P. Sainaghi2,4
1Department of Translational Medicine, Università del Piemonte Orientale, Novara;
2Division of Internal Medicine, Immunorheumatology Unit, Maggiore della Carità Hospital, Novara; 3Division of Internal Medicine, Sant’Andrea Hospital, Vercelli; 4IRCAD, Interdisciplinary Research Center
of Autoimmune Diseases, Novara, Italy
Reumatismo, 2018; 70 (4): 232-240
232 Reumatismo 4/2018 PAPER
Non-commercial
resistance dynamically investigated by an oral glucose tolerance test (OGTT) exist (7). Moreover, there is a paucity of data comparing glucose metabolism in RA vs PsA (8). With the present study, we aim to fill these gaps.
n MATERIALS AND METHODS
In the present case-control study, cases were consecutively recruited at an immune-rheu-matology clinic of an academic hospital, between November 2014 and June 2015. Inclusion criteria were: age >18, diagnosis of either RA (according to ACR/Eular clas-sification criteria 2010 (9)) or PsA (accord-ing to CASPAR criteria (10)). Patients were excluded if previously diagnosed as diabet-ics. The study was conducted according to the principles of the Helsinki Declaration. The following data were collected:
• Demographic and clinical characteris-tics: age, sex, active anti-rheumatic treat-ment, steroid treattreat-ment, cumulative dose of steroids administered in the preceding 3 and 12 months, comorbidities. The Dis-ease Activity Score (DAS28), the Clinical Disease Activity Index (CDAI) and the Simplified Disease Activity Index (SDAI) were used to assess disease activity in RA; patients affected by PsA were classified as achieving minimal disease activity when 5 of the 7 following criteria were met: ten-der joint count ≤1; swollen joint count ≤1; Psoriasis Activity and Severity Index ≤1 or body surface area ≤3%; patient pain visual analogue score (VAS) ≤15; patient global disease activity VAS ≤20; health assess-ment questionnaire ≤0.5; tender entheseal points ≤1 (11).
• Anthropometric data: weight (to the near-est 0.1 kg) and height (to the nearnear-est cm) were measured with the patient wearing only light underwear; body mass index (BMI) was calculated according to the formula weight (kg)/height (m)2, and interpreted
ac-cording to WHO classification (http://www. euro.who.int/en/health-topics/disease-pre- vention/nutrition/a-healthy-lifestyle/body-mass-index-bmi). Waist circumference was measured halfway between the costal edge and the crista.
• Laboratory data: erythrocyte sedimenta-tion rate (ESR) was measured by the West-ergren method (VES-Matic Cube 200”, DIESSE Diagnostica senese, Siena, Italy); C-Reactive Protein (CRP) was dosed by immunoturbidimetric analysis (Advia 1800 chemistry system, Siemens healthcare and diagnostics, Leverkusen, Germany). All pa-tients underwent a standard OGTT: follow-ing at least 12 hours of fastfollow-ing, 75 grams of glucose were administered after a first, baseline, blood sampling. A second sample was taken after 2 hours. Plasma glucose was measured by the hexokinase-reaction (Advia 1800 chemistry system, Siemens healthcare and diagnostics, Leverkusen, Germany), while insulin plasma concen-tration was determined by immunometric sandwich chemiluminescence (Advia Cen-taur, Siemens healthcare and diagnostics, Leverkusen, Germany). The results of the OGTT were interpreted according to ADA recommendations (12), as follows: normal fasting plasma glucose (FPG) if <100 mg/ dl (5.6 mmol/l); impaired FPG (IFG) if FPG was 100–125 mg/dl (6.9 mmol/l); im-paired glucose tolerance (IGT) if 2-h post-OGTT plasma glucose was 140–199 mg/dl (7.8-11.0 mmol/l); T2DM if FPG was ≥126 mg/dl (≥7 mmol/l) on two days apart, or if 2-h post-OGTT plasma glucose (2hPG) was ≥200 mg/dl (≥11.1 mmol/l). Glycated haemoglobin (HbA1c) was simultane-ously measured by a chromatographic as-say (Variant Biorad, Hercules, California, USA). HbA1c values of 5.7 and 6.5% were considered as thresholds for normal glu-cose metabolism and T2DM, respectively. Finally, the following insulin sensitivity and resistance indices were derived:
– Insulin resistance was calculated by the homeostatic model of insulin resistance (HOMA-IR) as fasting insulin (FPI, μU/m) × [FPG (mmol/l)/22.5] (13); – Insulin sensitivity index (ISI) (14) as 2/
[FPG+2hPG)/178 × (FPI+2hPI)/46.94 + 1];
– Early Insulin Sensitivity Index (EISI) (15): EISI = 0.156 − 0.0000459 × 2hPI − 0.000321 × FPI − 0.00541 × 2hPG. For each patient, two sex and age (+/- 2.5 years) matched controls were selected
Non-commercial
ORIGINAL PAPER
234 Reumatismo 4/2018
M. Bellan, S. Bor, A. Gibbin, et al.
PAPER
ORIGINAL PAPER
from a metabolic diseases clinic of the same academic hospital. Controls were also matched for presence/absence of arte-rial hypertension and belonged to the same World Health Organization BMI category of cases.
Data were recorded in a database and ana-lysed using the statistical software pack-age MedCalc v. 9.3.8.0 (MedCalc Soft-ware, Broekstraat 52, 9030, Mariakerke, Belgium). A significant departure from normal distribution was verified by the D’Agostino-Pearson test for continuous variables; accordingly, the measures of centrality and dispersion of data chosen were median and interquartile range [IQR]. Continuous variables of interest in groups (controls, RA and PsA) were compared by the Kruskal-Wallis (K-W) test. The distri-bution of categorical variables was com-pared between groups by Pearson’s χ2. The
existence of an association between poten-tial predictors of glucose metabolism and
blood glucose parameters was investigated by univariate analysis; the corresponding putative predictors of glucose metabolism were then used to build multivariate mod-els of prediction. The significance level chosen for each test was 0.05 (two-tails).
n RESULTS
The study population included 53 consecu-tive patients with RA, 44 with PsA and 194 controls matched for age, sex and BMI. Demographic features, metabolic and dis-ease-related parameters are reported in Ta-ble I. We found no significant differences comparing metabolic parameters of pa-tients and controls (see Table I for details). We then performed a univariate analysis on RA patients, to search for predictors (age, BMI, WC, ESR, CRP, daily pred-nisone dose, disease duration, disease activity, DAS28, CDAI, SDAI) of FPG, 2hPG, FPI, 2hPI, Hb1Ac alteration and of
Table I - Demographic, metabolic and disease related features of the population.
Controls (194) Rheumatoid Arthritis (53) Arthritis (44)Psoriatic or χAnova (K-W)* 2 (pearson)$
Age (years) 56 [48-64] 57 [50-67] 54 [48-60] p=0.025* Sex (M/F) 58/136 9/44 20/24 p=0.010$ BMI (kg/m2) 26.9 [23.8-31.1] 26.8 [23.3-31.4] 27.7 [24.3-32.5] p=0.259* WC (cm) 90 [80-101] 87 [75-98] 90 [81-102] p=0.241* FPG(mmol/l) 5.19 [4.89-5.67] 5.06 [4.72-5.61] 5.22 [4.94-5.72] p=0.279* 2hPG (mmol/l) 5.97 [5.11-7.61] 5.61 [5.00-6.83] 6.14 [4.94-7.67] p=0.355* FPI (pmol/l) 71.8 [47.6-105.4] 81.6 [52.0-114.0] 76.5 [50.5-114.8] p=0.510* 2hPI (pmol/l) 405.6 [258.4-808.3] 456.1 [258.4-719.5] 324.8 [159.5-739.7] p=0.359* HOMA-IR 2.25 [1.52-3.60] 2.53 [1.70-3.59] 2.53 [1.69-3.87] p=0.696* HbA1c 5.6 [5.4-5.9] 5.6 [5.3-6.0] 5.5 [5.3-5.8] p=0.440* ISI 0.74 [0.45-1.02] 0.76 [0.53-1.03] 0.89 [0.46-1.17] p=0.475* EISI 0.08 [0.04-0.10] 0.08 [0.06-0.10] 0.08 [0.05-0.10] p=0.955* ADA categories (NGT/IFG/IGT/IFG-IGT/diabetes) 118/12/32/20/12 35/1/9/4/4 27/2/7/5/3 p=0.971$
Prednisone use (y/n) 0/194 33/20 3/41 p=0.0001$
Median daily dose (mg) 0.00 [0.00-0.00] 1.46 [0.47-3.50] 0.00 [0.00-0.00] p<0.0001*
Disease activity (active/remission) n.a. 18/33 13/31 p=0.838$
Disease duration (months) n.a. 26 [19-60] 29 [21-58] p=0.505$
BMI, Body mass index; WC, Waist circumference; FPG, Fasting plasma glucose; 2hPG, 2-h post-OGTT plasma glucose; FPI, Fasting plasma insulin; 2hPI, 2-h post-OGTT plasma insulin; HOMA-IR, homeostatic model of insulin resistance; HbA1c, glycated hemoglo-bin; ISI, insulin sensitivity index; EISI, early insulin sensitivity index; NGT, normal glucose tolerance; IFG, impaired fasting glucose; IGT, impaired glucose tolerance.
Non-commercial
Reumatismo 4/2018
Inflammation and insulin sensitivity
ORIGINAL PAPER
Table II
- Pr
edictors of glucose metabolism in RA: univariate analysis, associations with clinical and lab data.
Rheumatoid Arthritis in r
emission (DAS28 < 2.6)
Rheumatoid Arthritis with r
esidual activity (DAS28 ≥ 2.6)
Age (years)
BMI
WC (cm) ESR (mm/h) CRP (mg/dl) Disease duration (months) PDN dose (mg) Age (years) BMI WC (cm) ESR (mm/h) CRP (mg/dl) Disease duration (months) PDN dose (mg) FPG (mmol/l) 0.082 p=0.651 0.726 p<0.001 0.568 p=0.001 0.136 p=0.459 0.212 p=0.243 0.052 p=0.772 0.273 p=0.124 0.323 p=0.191 0.017 p=0.946 0.190 p=0.450 0.116 p=0.658 0.421 p=0.092 0.238 p=0.342 -0.048 p=0.851 2hPG (mmol/l) 0.306 p=0.083 0.243 p=0.174 0.189 p=0.308 0.328 p=0.067 0.225 p=0.217 0.107 p=0.554 0.183 p=0.309 -0.002 p=0.994 -0.058 p=0.818 -0.030 p=0.907 0.208 p=0.422 0.754 p<0.001 0.335 p=0.174 -0.177 p=0.483 FPI (pmol/l) -0.199 p=0.266 0.643 p<0.001 0.439 p=0.013 0.018 p=0.920 -0.001 p=0.995 -0.147 p=0.413 0.157 p=0.383 0.625 p=0.006 0.125 p=0.621 0.187 p=0.458 0.594 p=0.012 0.174 p=0.504 -0.104 p=0.681 0.272 p=0.275 2hPI (pmol/l) 0.0264 p=0.138 0.235 p=0.189 0.212 p=0.253 0.338 p=0.059 0.066 p=0.721 0.162 p=0.368 0.044 p=0.810 0.474 p=0.047 0.199 p=0.429 0.304 p=0.220 0.186 p=0.473 0.781 p<0.001 0.371 p=0.130 0.093 p=0.714 HOMA-IR -0.199 p=0.268 0.655 p<0.001 0.419 p=0.019 0.016 p=0.931 0.013 p=0.942 -0.134 p=0.457 0.160 p=0.372 0.687 p=0.002 0.103 p=0.684 0.224 p=0.371 0.584 p=0.014 0.282 p=0.273 -0.048 p=0.851 0.227 p=0.366 HbA1c (mmol/mol) 0.035 p=0.856 0.583 p=0.001 0.313 p=0.112 0.070 p=0.722 0.268 p=0.168 -0.189 p=0.325 0.129 p=0.506 0.590 p=0.010 -0.129 p=0.609 0.054 p=0.832 0.429 p=0.086 0.376 p=0.137 -0.042 p=0.868 -0.035 p=0.891 ISI (Belfior e) -0.319 p=0.070 -0.427 p=0.013 -0.344 p=0.058 -0.129 p=0.481 -0.169 p=0.356 -0.200 p=0.264 -0.105 p=0.560 -0.456 p=0.057 -0.189 p=0.453 -0.299 p=0.229 -0.203 p=0.434 -0.736 p=0.001 -0.373 p=0.128 -0.036 p=0.888 EISI (Stumvoll) -0.055 p=0.763 -0.519 p=0.002 -0.383 p=0.033 -0.217 p=0.233 -0.065 p=0.724 -0.006 p=0.972 -0.140 p=0.438 -0.507 p=0.032 -0.135 p=0.592 -0.230 p=0.358 -0.428 p=0.087 -0.820 p<0.001 -0.304 p=0.219 -0.085 p=0.737
BMI, Body mass index; WC, W
aist cir
cumfer
ence; ESR, erythr
ocyte sedimentation rate; CRP
, C-r
eactive pr
otein; PDN, pr
ednisone; CDAI, clinical disease activity index; SDAI,
simplified disease activity index; DAS28, disease activity scor
e 28; FPG, Fasting plasma glucose; 2hPG, 2-h post-OGTT plasma glucose; FPI, Fasting plasma insulin; 2hPI, 2-h
post-OGTT plasma insulin; HOMA-IR, homeostatic model of insulin r
esistance; HbA1c, glycated hemoglobin; ISI, insulin sensitivity index; EISI, early insulin sensitivity index.
Non-commercial
ORIGINAL PAPER
236 Reumatismo 4/2018
M. Bellan, S. Bor, A. Gibbin, et al.
PAPER
insulin resistance indices (HOMA-IR, ISI (Belfiore) and EISI (Stumvoll) impairment (data not shown). Significant predictors were then assessed in multivariate analy-sis adjusted for sex and prednisone use; BMI was the single variable associated with FPG, FPI and HOMA-IR elevation (β>0.442, p<0.042 for all). Prednisone use was the single predictor of 2hPG eleva-tion (β=0.371, p<0.016), while we failed to identify predictors of impaired 2hPI, Hb1Ac, ISI (Belfiore) and EISI (Stumv-oll). We have also checked for the effect of citrullinated peptide antibody status on glucose metabolism. No differences could be detected between seropositive (N 37) and seronegative (N 16) patients (data not shown).
We performed the same analysis for PsA patients; predictors (age, BMI, WC, ESR, CRP, prednisone daily dose, disease dura-tion, disease activity) of FPG, 2hPG, FPI, 2hPI, Hb1Ac elevation and insulin resist-ance indices (HOMA-IR, ISI and EISI) impairment were assessed in univariate analysis (data not shown). Significant
pre-dictors were then included in a multivariate analysis model adjusted for sex and pred-nisone use. Disease duration was the only predictor of 2hPI elevation and ISI/EISI impairment (p<0.03).
Univariate and multivariate analysis were performed stratifying both RA and PsA pa-tients according to disease activity. Results of univariate analysis are reported in Tables II, III and IV.
Variables with statistically significant as-sociations were included in multivariate models adjusted for sex and prednisone use. Considering RA patients with residual disease activity, FPI elevation was pre-dicted by ESR alone (β=0.459, p=0.047); accordingly, HOMA-IR was predicted by ESR and age (β=0.445, p=0.020; β=0.432, p=0.028, respectively). 2hPG and 2hPI were predicted by CRP alone (β=0.915, p=0.0003 and β=0.772, p=0.0006); accord-ingly, ISI and EISI were predicted by CRP and age (ISI: CRP, β=-0.787, p=0.0006; Age 0.382, p=0.042. EISI: CRP β=-0.797, p=0.0001; Age β=-0.419, p=0.007). Finally, Hb1Ac was only related to age
Table III - Predictors of glucose metabolism in RA: univariate analysis, associations with disease activity scores.
Rheumatoid Arthritis in remission (DAS28 <
2.6) Rheumatoid Arthritis with residual activity (DAS28 ≥ 2.6)
CDAI SDAI DAS28 CDAI SDAI DAS28
FPG (mmol/l) p=0.2590.202 p=0.411-0.148 p=0.532-0.117 p=0.077-0.427 p=0.169-0.339 p=0.163-0.354 2hPG (mmol/l) p=0.2220.218 p=0.598-0.095 p=0.843-0.037 p=0.346-0.236 p=0.550-0.151 p=0.736-0.088 FPI (pmol/l) p=0.954-0.010 p=0.509-0.119 p=0.678-0.078 p=0.2140.308 p=0.662-0.111 p=0.496-0.177 2hPI (pmol/l) p=0.3580.165 p=0.488-0.125 p=0.822-0.042 p=0.780-0.071 p=0.984-0.005 p=0.975-0.008 HOMA-IR p=0.903-0.022 p=0.390-0.155 p=0.564-0.108 p=0.4580.187 p=0.461-0.185 p=0.336-0.249 HbA1c (mmol/mol) p=0.4580.143 p=0.3280.188 p=0.1370.294 p=0.514-0.164 p=0.327-0.245 p=0.416-0.211 ISI (Belfiore) p=0.550-0.108 p=0.9740.006 p=0.760-0.057 p=0.903-0.031 p=0.743-0.083 p=0.820-0.060 EISI (Stumvoll) p=0.563-0.104 p=0.4310.142 p=0.7070.070 p=0.948-0.017 p=0.6690.108 p=0.674-0.110
BMI, Body mass index; WC, Waist circumference; ESR, erythrocyte sedimentation rate; CRP, C-reactive protein; PDN, prednisone; CDAI, clinical disease activity index; SDAI, simplified disease activity index; DAS28, disease activity score 28; FPG, Fasting plasma glucose; 2hPG, 2-h post-OGTT plasma glucose; FPI, Fasting plasma insulin; 2hPI, 2-h post-OGTT plasma insulin; HOMA-IR, homeostatic model of insulin resistance; HbA1c, glycated hemoglobin; ISI, insulin sensitivity index; EISI, early insulin sensitivity index.
ORIGINAL PAPER
Non-commercial
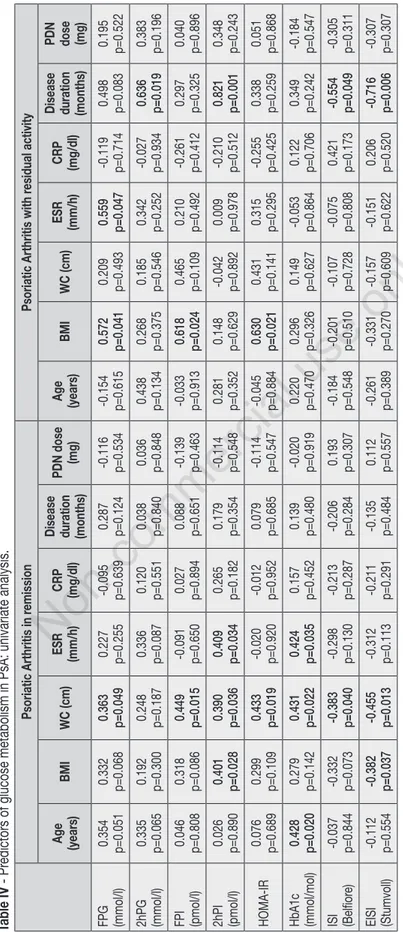
Table IV
- Pr
edictors of glucose metabolism in PsA: univariate analysis.
Psoriatic Arthritis in r
emission
Psoriatic Arthritis with r
esidual activity Age (years) BMI WC (cm) ESR (mm/h) CRP (mg/dl) Disease duration (months)
PDN dose (mg) Age (years) BMI WC (cm) ESR (mm/h) CRP (mg/dl) Disease duration (months) PDN dose (mg) FPG (mmol/l) 0.354 p=0.051 0.332 p=0.068 0.363 p=0.049 0.227 p=0.255 -0.095 p=0.639 0.287 p=0.124 -0.116 p=0.534 -0.154 p=0.615 0.572 p=0.041 0.209 p=0.493 0.559 p=0.047 -0.119 p=0.714 0.498 p=0.083 0.195 p=0.522 2hPG (mmol/l) 0.335 p=0.065 0.192 p=0.300 0.248 p=0.187 0.336 p=0.087 0.120 p=0.551 0.038 p=0.840 0.036 p=0.848 0.438 p=0.134 0.268 p=0.375 0.185 p=0.546 0.342 p=0.252 -0.027 p=0.934 0.636 p=0.019 0.383 p=0.196 FPI (pmol/l) 0.046 p=0.808 0.318 p=0.086 0.449 p=0.015 -0.091 p=0.650 0.027 p=0.894 0.088 p=0.651 -0.139 p=0.463 -0.033 p=0.913 0.618 p=0.024 0.465 p=0.109 0.210 p=0.492 -0.261 p=0.412 0.297 p=0.325 0.040 p=0.896 2hPI (pmol/l) 0.026 p=0.890 0.401 p=0.028 0.390 p=0.036 0.409 p=0.034 0.265 p=0.182 0.179 p=0.354 -0.114 p=0.548 0.281 p=0.352 0.148 p=0.629 -0.042 p=0.892 0.009 p=0.978 -0.210 p=0.512 0.821 p=0.001 0.348 p=0.243 HOMA-IR 0.076 p=0.689 0.299 p=0.109 0.433 p=0.019 -0.020 p=0.920 -0.012 p=0.952 0.079 p=0.685 -0.114 p=0.547 -0.045 p=0.884 0.630 p=0.021 0.431 p=0.141 0.315 p=0.295 -0.255 p=0.425 0.338 p=0.259 0.051 p=0.868 HbA1c (mmol/mol) 0.428 p=0.020 0.279 p=0.142 0.431 p=0.022 0.424 p=0.035 0.157 p=0.452 0.139 p=0.480 -0.020 p=0.919 0.220 p=0.470 0.296 p=0.326 0.149 p=0.627 -0.053 p=0.864 0.122 p=0.706 0.349 p=0.242 -0.184 p=0.547 ISI (Belfior e) -0.037 p=0.844 -0.332 p=0.073 -0.383 p=0.040 -0.298 p=0.130 -0.213 p=0.287 -0.206 p=0.284 0.193 p=0.307 -0.184 p=0.548 -0.201 p=0.510 -0.107 p=0.728 -0.075 p=0.808 0.421 p=0.173 -0.554 p=0.049 -0.305 p=0.311 EISI (Stumvoll) -0.112 p=0.554 -0.382 p=0.037 -0.455 p=0.013 -0.312 p=0.113 -0.211 p=0.291 -0.135 p=0.484 0.112 p=0.557 -0.261 p=0.389 -0.331 p=0.270 -0.157 p=0.609 -0.151 p=0.622 0.206 p=0.520 -0.716 p=0.006 -0.307 p=0.307
BMI, Body mass index; WC, W
aist cir
cumfer
ence; ESR, erythr
ocyte sedimentation rate; CRP
, C-r
eactive pr
otein; PDN, pr
ednisone; FPG, Fasting plasma glucose; 2hPG, 2-h
post-OGTT plasma glucose; FPI, Fasting plasma insulin; 2hPI, 2-h post-OGTT plasma insulin; HOMA-IR, homeostatic model of
insulin r
esistance; HbA1c, glycated hemoglobin;
ISI, insulin sensitivity index; EISI, early insulin sensitivity index.
Reumatismo 4/2018
Inflammation and insulin sensitivity
ORIGINAL PAPER
Non-commercial
ORIGINAL PAPER
238 Reumatismo 4/2018
M. Bellan, S. Bor, A. Gibbin, et al.
PAPER
(β=0.542, p=0.007). In RA patients with no residual disease activity, as expected, the most relevant predictor for impairment of glucose and insulin metabolism was BMI, which was a significant predictor of FPG, FPI, HOMA-IR, Hb1Ac and ISI (β=0.589, p=0.004; β=0.659, p=0.007; β=0.726, p=0.002; β=0.553, p=0.004; -0.392, p=0.044 respectively); furthermore, pred-nisone use predicted FPG and 2hPG eleva-tion (β=0.295, p=0.027; β=0.480, p=0.005 respectively).
Considering PsA patients with residual disease activity, no significant predictor was identified at multivariate analysis; in patients with no residual disease activity, WC was the only significant predictor of ISI impairment (β=-0.452, p=0.042), while age predicted Hb1Ac elevation (β=0.439, p=0.044).
n DISCUSSION
Growing evidence has related insulin re-sistance to inflammatory arthritis (2, 3); in this OGTT-based study we have investi-gated this association both in RA and PsA. Interestingly, we found that the correlation between inflammation and insulin sensitiv-ity is limited to patients with active RA, whereas it is not demonstrable in PsA. Looking at the indices of glucose metabo-lism in RA patients, BMI was the strongest predictor of insulin resistance, in agree-ment with the literature suggesting that obesity is the main determinant of glucose tolerance (16). On the other hand, pred-nisone use was the only predictor of 2hPG, as expected considering the detrimental impact of prednisone on insulin sensitiv-ity. In PsA, disease duration predicted higher insulin plasma concentration after OGTT; prednisone use was less relevant, its effect being more limited in PsA than in RA. Interestingly, we were not able to confirm previous studies which proved an altered insulin sensitivity in RA and PsA with respect to a control population (2, 17); recently, results consistent with ours have been reported in a population of patients affected by early RA, the insulin sensitivity of whom was not different from a control
group (18). It could be argued that in our study the high percentage of patients in clinical remission may have created a bias; to avoid it, we evaluated whether inflam-mation and disease activity were able to predict the result of OGTT in those patients with residual disease activity. Interestingly, in RA, ESR was in direct relationship with baseline blood glucose levels and, accord-ingly, the HOMA-IR was higher in the presence of high ESR values. On the con-trary, CRP was a predictor of the response to a glucose load, being directly related to ISI and EISI. The reason why different inflammatory markers predict different alterations of glucose metabolism is un-clear. One possible explanation is that ESR marks inflammation on a longer time scale than CRP which, conversely, is a marker of inflammation spanning a shorter period. In PsA the above mentioned associations were not confirmed, a finding that needs to be discussed at the light of the current literature. Recently, in fact, different au-thors have convincingly demonstrated an increased risk of type 2 diabetes mellitus (T2DM) in patients affected by PsA with respect to either a matched control group or patients affected by RA (19, 20). Two reasons may exist to explain this apparent discrepancy. Firstly, the patients enrolled in these studies had a significantly longer follow-up than our cohort PsA patients; secondly, for the present study we exclud-ed PsA patients with a definexclud-ed diagnosis of T2DM. As a matter of fact, we did not investigate incidence and prevalence of T2DM in PsA at all, since our aim was to give a cross-sectional picture of the asso-ciation between inflammation and insulin sensitivity. On the other hand, the reason(s) why inflammatory markers are less predic-tive of glucose metabolism impairment in PsA than in RA could be: i) the heteroge-neity of PsA; and/or ii) the fact that in PsA inflammatory markers reflect disease ac-tivity less well, especially among patients whose disease is mainly characterized by enthesopathy manifestations. Due to these limitations, we cannot entirely dismiss the hypothesis that a larger sample and a more disease-specific stratification of
activ-Non-commercial
ity (cutaneous, articular or enthesopathy) could disclose an association between in-flammation and insulin sensitivity in PsA as well as in RA.
Our study has other limitations. As just mentioned, its nature is explorative, with a relatively small sample size and short follow-up; a larger population is required to confirm our results and to allow a more comprehensive analysis. Specifically, it would be interesting to evaluate the re-sponse to OGTT, grouping patients accord-ing to the type of anti-rheumatic treatment in use, since it has been shown that some of the classical and biological DMARDs commonly employed in clinical practice have a positive impact on insulin sensitiv-ity (5, 6, 21). On the other hand, we would like to point out that a novel aspect of the study is the comparison of glucose me-tabolism between RA and PsA. These two conditions are characterized by a very dif-ferent biological behavior, which arguably is reflected on relevant differences in co-morbidities.
n CONCLUSIONS
In conclusion, appropriate management of comorbidities demands that an altered glu-cose metabolism should be ruled out for all patients affected by inflammatory arthritis. However, to interpret correctly the results of metabolic studies, clinicians need to be aware that the impact of disease activity is not necessarily similar for all rheumatic diseases. Our data indicate that they should be particularly alerted to its influence on patients with RA, among whom not only fasting insulin sensitivity, but also the re-sponse to an oral glucose load bears a rela-tionship with inflammatory markers.
Conflicts of interest: the authors declare
they have no conflicts of interest.
n REFERENCES
1. Roubille C, Richer V, Starnino T, et al. Evi-dence-based recommendations for the man-agement of comorbidities in rheumatoid ar-thritis, psoriasis and psoriatic arthritis: expert
opinion in the Canadian Dermatology-Rheu-matology comorbidity initiative. J Rheumatol. 2015; 42: 1767-80.
2. Giles JT, Danielides S, Szklo M, et al. Insu-lin resistance in rheumatoid arthritis: disease-indicators and associations with the presence and progression of subclinical atherosclerosis. Arthritis Rheumatol. 2015; 67: 626-36. 3. Haroon M, Gallagher P, Heffernan E,
FitzGer-ald O. High prevalence of metabolic syndrome and of insulin resistance in psoriatic arthritis is associated with the severity of underlying disease. J Rheumatol. 2014; 41: 1357-65. 4. Nurmohamed MT, Heslinga M, Kitas GD.
Cardiovascular comorbidity in rheumatic dis-eases. Nat Rev Rheumatol. 2015; 11: 693-704. 5. Ursini F, Russo E, Letizia Hribal M, et al.
Abatacept improves whole-body insulin sensi-tivity in rheumatoid arthritis: an observational study. Medicine (Baltimore). 2015; 94: e888. 6. Chen DY, Chen YM, Hsieh TY, et al.
Signifi-cant effects of biologic therapy on lipid profiles and insulin resistance in patients with rheuma-toid arthritis. Arthritis Res Ther. 2015; 17: 52. 7. Hoes JN, van der Goes MC, van Raalte DH,
et al. Glucose tolerance, insulin sensitivity and β-cell function in patients with rheumatoid ar-thritis treated with or without low-to medium dose glucocorticoids. Ann Rheum Dis. 2011; 70: 1887-94.
8. Labitigan M, Bahĉe-Altuntas A, Kremer JM,
et al. Higher rates and clustering of abnor-mal lipids, obesity, and diabetes mellitus in psoriatic arthritis compared with rheumatoid arthritis. Arthritis Care Res (Hoboken). 2014; 66: 600-7.
9. Aletaha D, Neogi T, Silman AJ, et al. 2010 rheumatoid arthritis classification criteria: an American College of Rheumatology/Europe-an League Against Rheumatism collaborative initiative. Arthritis Rheum. 2010; 62: 2569-81. 10. Taylor W, Gladman D, Helliwell P, et al.
Classification criteria for psoriatic arthritis: development of new criteria from a large in-ternational study. Arthritis Rheum. 2006; 54: 2665-73.
11. Coates LC, Fransen J, Helliwell PS. Defining minimal disease activity in psoriatic arthritis: a proposed objective target for treatment. Ann Rheum Dis. 2010; 69: 48-53.
12. American Diabetes Association. Standards of medical care in diabetes - 2012. Diabetes Care 2012; 35: S11-63.
13. Matthews DR, Hosker JP, Rudenski AS, et al. Homeostasis model assessment: insulin resist-ance and beta-cell function from fasting plas-ma glucose and insulin concentrations in plas-man. Diabetologia 1985; 28: 412-9.
14. Belfiore F, Iannello S, Camuto M, Fagone S. Insulin sensitivity of blood glucose versus insulin sensitivity of blood free fatty acids in
Non-commercial
ORIGINAL PAPER
240 Reumatismo 4/2018
M. Bellan, S. Bor, A. Gibbin, et al.
PAPER
normal, obese and obese-diabetic subjects. Metabolism 2001; 50: 573-82.
15. Stumvoll M, Van Haeften T, Fritsche A, Ger-ich J. Oral glucose tolerance test indexes for insulin sensitivity and secretion based on vari-ous availabilities of sampling times. Diabetes Care 2001; 24: 796-7.
16. Sainaghi PP, Castello L, Bergamasco L, et al. Metabolic characteristics of glucose intoler-ance: the critical role of obesity. Exp Clin En-docrinol Diabetes. 2008; 116: 86-93. 17. Tam LS, Tomlinson B, Chu TT, et al.
Cardio-vascular risk profile of patients with psoriatic arthritis compared to controls--the role of in-flammation. Rheumatology (Oxford). 2008; 47: 718-23.
18. Manrique-Arija S, Ureña I, Valdivielso P, et al. Insulin resistance and levels of adipokines in patients with untreated early rheumatoid
ar-thritis. Clin Rheumatol. 2016; 35: 43-53.
19. Labitigan M, Bahĉe-Altuntas A, Kremer JM,
et al. Higher rates and clustering of abnormal lipids, obesity, and diabetes mellitus in psori-atic arthritis compared with rheumatoid arthri-tis. Arthritis Care Res (Hoboken). 2014; 66: 600-7.
20. Castañeda S, Martín-Martínez MA, González-Juanatey C, et al. Cardiovascular morbidity and associated risk factors in Spanish patients with chronic inflammatory rheumatic diseas-es attending rheumatology clinics: Baseline data of the CARMA Project. Semin Arthritis Rheum. 2015; 44: 618-26.
21. Burska AN, Sakthiswary R, Sattar N. Effects of tumour necrosis factor antagonists on in-sulin sensitivity/resistance in rheumatoid ar-thritis: a systematic review and meta-analysis. PLoS One 2015; 10: e0128889.