© Author(s) 2015. This work is distributed under the Creative Commons Attribution 3.0 License.
A
A
tm
spheric
P
P
ollution
R
R
esearch
www.atmospolres.com
Wildfires impact on surface nitrogen oxides and ozone in Central Italy
Piero Di Carlo
1,2, Eleonora Aruffo
2, Fabio Biancofiore
1,2, Marcella Busilacchio
2, Giovanni Pitari
1,
Cesare Dari–Salisburgo
2, Paolo Tuccella
2, Yoshizumi Kajii
31 Dipartimento di Scienze Fisiche e Chimiche, Universita’ degli studi di L’Aquila, Via Vetoio, 67010 Coppito, L’Aquila, Italy 2 Center of Excellence CETEMPS, Universita’ degli studi di L’Aquila, Via Vetoio, 67010 Coppito, L’Aquila, Italy
3 Graduate School of Human and Environmental Studies, Kyoto University, Japan
ABSTRACT
A summer campaign in Central Italy was carried out to study the impact of fire emissions on the mixing ratios of surface trace gases. Observations with a selective and sensitive instrument that uses the laser induced fluorescence technique for direct measurements of nitrogen dioxide (NO2), show a significant increase of NO2 mixing ratios, in the evening, when a fire plume reached the observations site. The increase of NO2 mixing ratios is well correlated (R=0.83) with that of particulate matter (PM), which is one of the primary product of forest and grassland fires. The tight correlation between NO2 and PM is used to improve the performance of a statistical regression model to simulate the observed O3, and to highlight the effect of fire emissions on the O3 mixing ratios. The statistical regression model of O3 improves in terms of performance (bias reduction of 77% and agreement enhancement of 10% for slope and correlation coefficient) when PM2.5 is included as additional input and proxy of the fire emissions among the usual input parameters (meteorological data and NO2 mixing ratios). A case study, comparing observed and modeled O3 in different days (with and without fire plume), suggests an impact of fire emissions on the O3 mixing ratios of about 10%. Keywords: Nitrogen dioxide, ozone, biomass burning, urban pollution, laser induced fluorescence Corresponding Author:
Piero Di Carlo
: +39‐0862433084 : +39‐0862433033 : [email protected] Article History: Received: 24 April 2014 Revised: 15 June 2014 Accepted: 11 July 2014doi: 10.5094/APR.2015.004
1. Introduction
Ozone (O3) together with aerosols is a tropospheric pollutant and greenhouse gas (IPCC, 2013). In atmosphere, O3 is produced by the photolysis of nitrogen dioxide (NO2), which in turn is the result of the oxidation of volatile organic compounds (VOCs) in presence of nitrogen oxide (NO). O3 production is a non–linear function ofthe NOX (NO+NO2) concentrations (Kleinman, 2005), for this
reason, the accurate measurement of NOX is central to study the
O3 evolution. Combustion processes are the main sources of NOX
but their emissions from fires have still large uncertainties (Jaegle et al., 2005). The transport and removal of NOX are controlled by
reactive nitrogen compounds (NOY), which are the sum of all the
reservoir species of NOX (NOY=NO+NO2+RO2NO2+RONO2+HNO3+
2xN2O5+HONO+other nitrates). These species are produced in
proximity of NOX sources and their concentrations may be highly
influenced by fire emissions (Bertram et al., 2005). Peroxyacyl nitrate (PAN) is produced by the oxidation of VOCs in presence of NO2 and it has a lifetime on the order of days. PAN long lifetime allows long distance (thousands of kilometers) transport and, once
dissociated, alters the levels of NOX and ozone, even in areas not
impacted by the fire (Val Martin et al., 2008).
Biomass burning produces primarily water vapor, carbon
dioxide (CO2) and carbon monoxide (CO). At the same time, in
these combustion processes methane (CH4), a variety of VOCs and
carbon aerosols are emitted and, therefore released into the atmosphere. On global scale, fire emissions are one of the main sources of some of the species above, like CO and carbon aerosols
(Andreae and Merlet, 2001; Page et al., 2002). All the emissions from fires (burning of biomass in open air) are controlled by simple, but very variable, factors e.g. the quantity of water involved in the plant combustion, their size and the wind conditions. All these factors determine the overall efficiency of the
combustion, which is defined as the fraction of emitted CO2
compared to the total amount of carbon in the plant. Since these combustion processes are not 100% efficient, there is not complete conversion of all the plant carbon into CO2. Because of this inefficient combustion, there is a significant emission of VOCs and aerosols. The VOCs released into the atmosphere are mainly
oxidized by hydroxyl radical (OH) and nitrate radical (NO3) to
produce O3 and secondary organic aerosols; both responsible for
the deterioration of the air quality (Meng et al., 1997; Ryerson et al., 2001). In recent studies, both laboratory and intensive measurement campaigns, like that in the tropical forests of Brazil, has been showed that among the VOCs emitted by fires those containing oxygen (OVOCs) dominate with a ratio of 4:1 (Karl et al., 2007). Many OVOCs have very important implications in the chemistry of the atmosphere. Indeed OVOCs such as formaldehyde and acetone, which are the main tropospheric oxidants, have a role in the OH budget. Moreover, in atmosphere, acetone and other OVOC, such as acetaldehyde, can be converted, by oxidative processes, in peroxy radicals (peroxy acetyl nitrate), the precursors of PAN. Observations in various urban sites show that the emissions caused by fires have a role in the degradation of air quality in urban areas such as Zurich and Mexico City, both far from areas subjected to fire (Querol et al., 2008; Weimer et al., 2008). Besides OVOCs emissions, also highly reactive VOCs are
released, such as xylenes, isoprene, monoterpene and
sesquiterpenes that are efficient precursors of O3 and secondary
organic aerosols in presence of NOX (Calfapietra et al., 2009).
Emissions due to natural or deliberate fires of grassland and forest impact the atmospheric composition and aerosol load, both locally and globally. Several field campaigns and continuous observations have confirmed that biomass burning contributes to
the degradation of air quality in terms of increase of PM2.5. Carbon
emissions during these events are normally split among CO and carbonaceous particles, which in turn may be classified into two main families, e.g. organic carbon (OC) and black carbon (BC) particles. Organics (that normally dominate in mass) are highly soluble, with negligible absorption of the incoming solar radiation (i.e. imaginary part of the refractive index close to zero and single scattering albedo close to unity). On the other hand, BC particles are highly hydrophobic (at least for the first few hours after emission), with strong absorptivity of the incoming radiation (single scattering albedo 0.2). Fires produce particulate matter (aerosols) also indirectly as product of the oxidation of VOCs emitted. The aerosols formed are of submicrometer in size (Artaxo et al., 2002), they have low deposition rates associated with long lifetime in atmosphere. In some studies, it was shown that organic acids, soluble in water, are important components of the aerosols emitted by fires (Gao et al., 2003; Fuzzi et al., 2007). These organic compounds of the smoke particles are condensation nuclei for cloud droplets with potential impact on the microphysical characteristics of clouds and atmospheric chemistry in the aqueous phase (Andreae and Rosenfeld, 2008). The chemical composition of aerosols emitted by biomass burning has been analyzed in detail in several studies, and during particles aging takes place the condensation of inorganic salts such as sulfates and nitrates, with consequent effects on the budget of reactive nitrogen species (Decesari et al., 2006; Fuzzi et al., 2007).
In recent years, the processes of fire emissions and their influence on the atmospheric composition on local and global scale have been studied in detail, with particular attention to boreal, Amazon and South Africa forest fires (Fuzzi et al., 2007; Kaneyasu et al., 2007; Karl et al., 2007; Verma et al., 2009), as well as summer fires of Southern California (Muhle et al., 2007; Pfister et al., 2008). The nature and mixing ratios of compounds emitted by combustion processes depend on the type of the burned vegetation and on weather conditions during the combustion (Andreae and Merlet, 2001; Langmann et al., 2009). The Mediterranean area, due to high summer temperatures, is the European region in which fires are most frequent. It is also the region where the effects of fire emissions on the atmospheric composition are more evident and of greater interest because of the high intensity of solar radiation. In fact, Southern Europe is the area where the photochemistry of ozone is more active, and where in the past years have been recorded the highest number of exceedances of the thresholds established for ozone (Lelieveld et al., 2002; EEA, 2007). For these reasons, the Mediterranean area is considered a ‘hot spot’ for the effects of forest fires on the air quality and the factors that modify the climate (Cristofanelli et al. 2009; Cristofanelli et al. 2013).
In this work we report the observations of a campaign conducted in summer 2007 in Southern Europe (L’Aquila, Italy), focusing on the impact of some forest and grassland fires occurred
in proximity of the observation site, on the NO, NO2, O3, PM2.5 and
PM10 levels. Fire emissions contribution on the changes of NO2 and
O3 mixing ratios was studied using a regression model. Improve‐
ments on the O3 simulation including PM2.5 data as a proxy of the
fire emissions in the model are also discussed.
2. Observation Site
The campaign was carried out in July 2007 at the L’Aquila University buildings, about 3 km northwest from downtown L’Aquila (42°22’N, 13°21’E), a small town of less than 70 000
people in the central part of Italy. The town of L’Aquila is located in a valley at about 700 m above sea level (asl) between the Gran Sasso mountain chain with the highest peak of the Apennines (2 912 m asl), and the Sirente mountain chain (2 348 m asl). The measurement site is far away from strong anthropogenic pollutant sources, such us industries: the main pollution sources are traffic and public and private energy consumption from the town of L’Aquila. Recent analysis shows that the site is mainly impacted by air masses that originate from west to north and is located upwind from the town of L’Aquila, suggesting that the observations are relatively less impacted from local anthropogenic sources (Di Carlo et al., 2007).
3. Air Sampling and Instrumentation
Air was sampled on top of the L’Aquila University building (about 15 m tall) and was drawn down through a 20 m Teflon tube (inner diameter 4.6 mm) at the rate of 6 L/min. All the instruments
used in this campaign (NO2–LIF instrument, O3 and NOX analyzers)
took the air from the Teflon tube. The residence time in the tube was about 3 s, much shorter than the reaction time between NO
and O3 (about 1 min for 50 ppb of O3), which assures that no
significant chemical conversion occurs before the sampling (Dari– Salisburgo et al., 2009).
NO2 was measured using a Laser Induced Fluorescence (LIF)
system developed at the University of L’Aquila. Briefly, the version of the University of L’Aquila LIF employed in this campaign used a
Yag laser to excite NO2 molecules and, detecting the fluorescence
induced in these molecules, the NO2 mixing ratio is derived directly
(Dari–Salisburgo et al., 2009; Di Carlo et al., 2013). In this tech‐ nique, ambient air is drawn into a detection cell through an orifice to reduce air pressure down to 4–6 Torr, in order to minimize the
quenching (non–radiative relaxation of the NO2 molecules due to
collision with other molecules and water vapor) and consequently increase the signal to noise ratio. In the detection cell, the laser beam crosses the ambient airflow and a photomultiplier detects the fluorescence photons (Dari–Salisburgo et al., 2009; Di Carlo et al., 2013). The time resolution of the system was 10 Hz with a detection limit of 3.6 pptv. The first version of the LIF used in this campaign and its evolutions towards a Thermal Dissociation LIF (TD–LIF) used onboard a research aircraft are described in detail in previous papers, reporting instrumental performance and inter‐ comparison with other systems (Dari–Salisburgo et al., 2009; Di Carlo et al., 2013).
NO and NO2 were measured using a commercial NOX
chemiluminescent analyzer (Thermo Model 42i TL). NO is
measured directly, whereas NO2 is measured after conversion into
NO by means of molybdenum converter heated to 325 °C. Every measurement cycle takes 10 s, 6 s for NO and the remaining for
NO2. The instrument was calibrated before the measurement
campaign by a standard procedure using the gas phase titration method.
Ozone was measured with a commercial analyzer Dasibi 1308.
It quantifies O3 mixing ratio by measuring the UV absorption using
the Lambert–Beer law. The instrument is equipped with catalytic
filter that removes O3 from the sample air to measure the
background before each measurement. The data are updated every 10 s and the precision is 5%.
Mass and number mixing ratios of aerosols were carried out using a multi–channel aerosol laser spectrometer (Grimm analyzer, series 1.108). PM10 is obtained as the total aerosol mass mixing
ratios in channels 1 to 13, PM1 in channels 1 to 7, and PM–coarse
as PM10–PM1 (channels 8 to 13) with an uncertainty of about 20%
(Kinne et al., 2003). Data were collected with a 1 min time resolution. Ambient temperature, relative humidity, wind speed and direction, and sun radiation were monitored with a
NO and NO2. Meteorological data were logged every 15 min. In
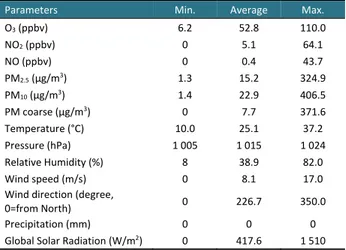
Table 1 all parameters measured during the campaign are reported and, for each of them, minimum, average and maximum values are shown. Table 1. Parameters measured during the campaign in July 2007 in L’Aquila, including their mean, minimum and maximum value
Parameters Min. Average Max.
O3 (ppbv) 6.2 52.8 110.0 NO2 (ppbv) 0 5.1 64.1 NO (ppbv) 0 0.4 43.7 PM2.5 (µg/m3) 1.3 15.2 324.9 PM10 (µg/m3) 1.4 22.9 406.5 PM coarse (µg/m3) 0 7.7 371.6 Temperature (°C) 10.0 25.1 37.2 Pressure (hPa) 1 005 1 015 1 024 Relative Humidity (%) 8 38.9 82.0 Wind speed (m/s) 0 8.1 17.0 Wind direction (degree, 0=from North) 0 226.7 350.0 Precipitation (mm) 0 0 0 Global Solar Radiation (W/m2) 0 417.6 1 510
4. Observations
During the period of the measurements reported here (July 2007), the region around the observation site and most of the Central and Southern Italy were impacted by a relevant number of grassland and forest fires. Summer 2007 was one of the hottest summers for southeastern Europe in recent years, in fact for example, air temperature anomalies of the surface in the period June–August 2007 with respect to the 1961–1990 reference period exceeded between 3 and 4 °C in most of the Southeastern Europe and Balkan Peninsula (Founda and Giannakopoulos, 2009). The environmental emergency has resulted, for the Central and Southern Italy, in 23 dead people, 26 injured, demolished houses, destroyed habitats, landscapes, forests and pastures, everything in ashes. Globally, in summer 2007, in Italy were reported 10 614 fires that have burned an area of 225 563 hectares, of which 115 242 wooded. The average area for each fire was 21.3 hectares, the highest ever recorded from 1970 (RIPALA, 2008). L’Aquila, where the observations reported here were carried out, is the regional Capital of Abruzzo (Central Italy), one of the Italian regions more impacted by fires in the last years. Figure 1 shows the map of the fires occurred during summer 2007 in the Abruzzo region: 274 fires were recorded with 21 167 hectares burned, the highest number of fires and hectares destroyed in the period 2004–2010 (see Table 2) (RIPALA, 2008). Figure 2 shows an image elaborated from reflectance data acquired by MODIS (MODerate resolution Imaging Spectrometer), which is a radio‐ meter installed on–board the TERRA and AQUA satellites. MODIS observes the solar spectrum in the wavelength range between 0.41 and 14.24 µm, using 36 channels with spatial resolution between 250 m and 1 km. Figure 2 shows the plume due to the fires in Abruzzo observed by MODIS on–board the AQUA satellite at 12:05
Local Time (LT) of the 24th July 2007. Among the numerous fire
spots active in Abruzzo, the massive one near L’Aquila produced the big plume evident in the MODIS image (Figure 2).
4.1. Data overview
The overview of the main observations carried out during the campaign is showed in Figure 3. The measurements cover the
period between the 15th and the 31st of July 2007. In the evening of
the 15th July, the first big fire occurred in the surrounding area of
L’Aquila, after several other small fires in the same area. The sign of the big fire, which started in the late afternoon, is evident in the NO2 mixing ratio that, around 19:00 LT, increased from less than
1 ppbv to up to 20 ppbv. The NO2 increase matches exactly that of
PM2.5, with a correlation coefficient (R) equal to 0.83 (Figure 4),
which confirms that the abrupt change in the NO2 mixing ratios is
due to the fire. The wind direction observed in the site confirms the provenience of the plume from the fire area. On the other hand, the fire plume arrival on the observations site was also visually evident; in fact, a persistent smoke cloud surrounded the site that evening. Before the big fire, of the evening, several spikes in the NO2 mixing ratio were recorded, due to some other minor fire plumes that reached the measurement site (Figure 4). The
elevated mixing ratios of NO2 and PM2.5, were observed until
midnight. The period after the 15th of July (until the 24th of July)
was characterized by low mixing ratios of NO2 and PM2.5 with the
exception of the 18th of July when the NO
2 mixing ratio increase
was not associated to a PM2.5 growth, since no fires were reported
that day. From the 24th of July there were some other fires around
L’Aquila evident from concomitant changes of the NO2 and PM2.5,
especially during the 25th July when, several fires plumes reached
the observational site during the day and night. The biggest plume was characterized by a big increase of PM2.5, NO2 and O3 in the early afternoon, ozone raised up to 110 ppbv (Figure 3), which is above the European population information threshold of
180 μg/m3 (about 90 ppb). Observations at Mt. Cimone in northern
Italian Apennines, during the summer 2007, a month after the
measurements reported here, show O3 peaks higher than
100 ppbv, as observed in L’Aquila (Cristofanelli et al., 2009). The
number of plumes that reached the site on 25th of July at different
hours of the day is suitable to show the role of NO2 injection in the
O3 budget. Figure 5 shows the scatter plot between O3 and NO2 dividing the observed data between daytime (dominated by
photochemistry: production of O3 from photo–dissociation of NO2)
and nighttime when O3 is loss due to reaction with NO2 that
produces NO3. As expected, during daytime O3 grows following the
NO2 increase, the contrary happens during nighttime (Figure 5). Figure 1. Map of the fires (yellow spots) reported during the summer 2007 in the Abruzzo region (Central Italy). The monitoring site was in L’Aquila (white spot).
Table 2. Number of fires and hectares of forest or grassland destroyed in the Abruzzo region (Central Italy) in the period 2004–2010
Year Number of Fires Hectares Burned
2004 54 606 2005 40 347 2006 56 340 2007 274 21 167 2008 159 439 2009 34 159 2010 64 379
Figure 2. Image elaborated from reflectance data acquired by MODIS measurements on–board of the AQUA satellite (24th July 2007 at 12.05 LT). The white plume toward East is the signature of the fires around the observational site, in L’Aquila. The color–bar is the reflectance and it is unit–less because it is the ratio of surface radiance to surface irradiance.
Figure 3. Time series of NO2, PM2.5 and O3measured in L’Aquila during the campaign carried out in July 2007.
4.2. Case study: Application of linear regression models for evaluating the contribution of wildfires emissions on the ozone mixing ratio
To analyze the evolution of the ozone in a period of observations when fire emissions played a big role, we used a linear regression model constrained with observed chemical compounds and meteorological parameters (Sousa et al., 2007). The linear regression model is based on the backward stepwise technique that involves the identification of the best set of parameters to model ozone, and the iterative alteration of the model by adding or removing a predictor variable to maximize the regression coefficients between model and measurements
(Darlington, 1990; Di Carlo et al., 2007; Demuzere et al., 2009; Di
Carlo et al., 2009). The strong correlation between NO2 mixing
ratios and PM2.5, observed in a plume emitted from a wildfire
(Figure 4) suggests that, besides meteorological parameters, PM2.5
could play a role to simulate the evolution of chemical species impacted by fire emissions. This is something expected, because
contrary to other short– or medium–lived fire products (e.g. NOX,
CO, VOC), PM2.5 behaves as an almost perfect passive tracer,
considering that the wet deposition of PM2.5 is negligible due to the absence of precipitations during all the observational period, therefore PM2.5 brings the “fire signal” unperturbed over signifi‐ cant distances. The increase of PM due to fire emission is observed in several other sites (Fuzzi et al., 2007; Muhle et al., 2007;
Longitude
Latitude
Cristofanelli et al., 2009) including the Mediterranean area (Cristofanelli et al., 2013), while the correlation between PM and
NO2 is reported quite sparsely. To highlight the role of fire emission
on the O3 mixing ratios we compared two days of the observation
period: one when a big fire plume reached the observations site (25th of July 2007) and the other (19th of July) with no–fire in the surroundings of the site, nor transported plume from distant areas.
For both days we considered measured and modeled O3 including
and excluding PM2.5 mixing ratios as input parameter in the
regression model. First, using the stepwise regression technique, we identified the best set of input parameters to be used in the model, excluding redundant, not statistical significant parameters (Di Carlo et al., 2007). Then, at the best set of input parameters, we
added PM2.5 mixing ratios as the other input parameter, and run
again the regression model to find changes in agreement between observations and model. In this case, for both days, the stepwise technique identifies as “best” set of input data for the regression model: temperature, relative humidity, wind speed, solar radiation,
NO and NO2. Figure 6a shows the scatter plot between measured
and modeled O3 using the “best” set of input parameters for the day affected by fire plume, whereas Figure 6b shows the same
scatter plot but including PM2.5 mixing ratios as additional input parameter. The inclusion of PM2.5 mixing ratios as an extra input
parameter results in a better simulation of the observed O3 mixing
ratios in terms of (1) correlation coefficient that increases of 10% (from 0.88 to 0.97, see Figure 6a and Figure 6b); (2) slope that rises from 0.88 to close to one (0.97), and (3) reduction of the bias of 77% (from 6.48 ppbv to 1.48 ppbv). On the contrary, the inclusion
of PM2.5 concentrations as an additional input parameter does not
improve the agreement of measured and modeled O3 for the day
not affected by fire plumes (Figure 6c and 6d). In fact, in this case, the slope, bias and correlation coefficient of the regression line of
the modeled–measured O3 do not change with the inclusion of
PM2.5 mixing ratios as an extra proxy. These analyses support the hypothesis that in case of fire plume the mixing ratio of O3 is influenced by fire emissions and on the average this contribution can be quantified in about 5 ppbv (see the 77% bias reduction), about 10% of the daily average O3, as in the case study reported here. Moreover, for O3 observations in a site impacted by a fire
plume the quality of modeled O3 can be improved using fine
particles emission as an additional proxy in statistical regression model.
Figure 4. Two days of observations during July 2007 at the University of L’Aquila site. The abrupt increase of NO2, well correlated with PM2.5 at about 19:00 LT (196.8 day of the year, 15th of July) is due to transport from
intense grassland and forest fires, at about 30 km south–east from L’Aquila.
Figure 5. Scatter plot of O3 and NO2 dividing daytime from nighttime observed in L’Aquila during the 25th of July
Figure 6. (a) Measured and modeled ozone using as proxy the temperature, relative humidity, and wind speed, solar radiation, NO and NO2 mixing ratio for a day impacted by fire emissions. (b) Measured and modeled ozone using as proxy the same parameters as in (a) plus PM2.5 mixing ratios, for a day impacted by fire emissions. (c) Measured and modeled ozone using as proxy the same parameters as in (a) for a day not impacted by fire emissions. (d) Measured and modeled ozone using as proxy the same parameters as in (a) plus PM2.5 mixing ratios, for a day not impacted by fire emissions.
7. Conclusions
In this study, observations of O3, NOX and PM result impacted
by fire emissions in the vicinity of the observation site. The strong
correlation between NO2 and PM2.5 allows to improve the model
simulation of O3, including the mixing ratios of the latter as an additional proxy in a statistical regression model. The improvement is of 77% in terms of bias reduction and 10% in terms of slope and correlation coefficient enhancement between measured and
modeled O3, for a day impacted by fire emissions. The comparison
between measured and modeled O3 in a day impacted by fire
emissions and another with no–fire plume, shows that the
contribution of fire emission on the O3 level is, on average, about
10%, at least for the case study reported here. This result suggests
the important role of fire emissions in the O3 budget in background
sites with low local anthropogenic emissions, but frequently impacted by forest and grassland fires, like Central Italy and most of the Mediterranean area. However more investigations, especial‐ ly detecting more fire events to confirm the results reported here, are needed.
Acknowledgement
We thank the staff of CETEMPS and Department of Physical and Chemical Science of the University of L’Aquila for the support during the campaign and Dr. Manuela Rastelli for kindly reviewing the English of the manuscript.
References
Andreae, M.O., Rosenfeld, D., 2008. Aerosol–cloud–precipitation interactions. Part 1. The nature and sources of cloud–active aerosols.
Earth–Science Reviews 89, 13–41.
Andreae, M.O., Merlet, P., 2001. Emission of trace gases and aerosols from biomass burning. Global Biogeochemical Cycles 15, 955–966. Artaxo, P., Martins, J.V., Yamasoe, M.A., Procopio, A.S., Pauliquevis, T.M.,
Andreae, M.O., Guyon, P., Gatti, L.V., Leal, A.M.C., 2002. Physical and chemical properties of aerosols in the wet and dry seasons in Rondonia, Amazonia. Journal of Geophysical Research–Atmospheres 107, art. no. 8081.
Bertram, T.H., Heckel, A., Richter, A., Burrows, J.P., Cohen, R.C., 2005. Satellite measurements of daily variations in soil NOX emissions.
Geophysical Research Letters 32, art. no. L24812.
Calfapietra, C., Fares, S., Lofeto, F., 2009. Volatile organic compounds from Italian vegetation and their interaction with ozone. Environmental
Pollution 157, 1478–1486.
Cristofanelli, P., Fierli, F., Marinoni, A., Calzolari, F., Duchi, R., Burkhart, J., Stohl, A., Maione, M., Arduini, J., Bonasoni, P., 2013. Influence of biomass burning and anthropogenic emissions on ozone, carbon monoxide and black carbon at the Mt. Cimone GAW–WMO global station (Italy, 2 165 m a.S.L.). Atmospheric Chemistry and Physics 13, 15–30.
Cristofanelli, P., Marinoni, A., Arduini, J., Bonafe, U., Calzolari, F., Colombo, T., Decesari, S., Duchi, R., Facchini, M.C., Fierli, F., Finessi, E., Maione, M., Chiari, M., Calzolai, G., Messina, P., Orlandi, E., Roccato, F., Bonasoni, P., 2009. Significant variations of trace gas composition and aerosol properties at Mt. Cimone during air mass transport from North Africa – contributions from wildfire emissions and mineral dust.
Atmospheric Chemistry and Physics 9, 4603–4619.
Dari–Salisburgo, C., Di Carlo, P., Giammaria, F., Kajii, Y., D'Altorio, A., 2009. Laser induced fluorescence instrument for NO2 measurements: Observations at a Central Italy background site. Atmospheric
Environment 43, 970–977.
Darlington, R.B., 1990. Regression and Linear Models, McGraw–Hill Publishing Co, New York, pp. 40–45.
Decesari, S., Fuzzi, S., Facchini, M.C., Mircea, M., Emblico, L., Cavalli, F., Maenhaut, W., Chi, X., Schkolnik, G., Falkovich, A., Rudich, Y., Claeys, M., Pashynska, V., Vas, G., Kourtchev, I., Vermeylen, R., Hoffer, A., Andreae, M.O., Tagliavini, E., Moretti, F., Artaxo, P., 2006. Characterization of the organic composition of aerosols from Rondonia, Brazil, during the LBA–SMOCC 2002 experiment and its representation through model compounds. Atmospheric Chemistry and
Physics 6, 375–402.
Demuzere, M., Trigo, R.M., de Arellano, J.V.G., van Lipzig, N.P.M., 2009. The impact of weather and atmospheric circulation on O3 and PM10 levels at a rural mid–latitude site. Atmospheric Chemistry and Physics 9, 2695– 2714.
Di Carlo, P., Aruffo, E., Busilacchio, M., Giammaria, F., Dari–Salisburgo, C., Biancofiore, F., Visconti, G., Lee, J., Moller, S., Reeves, C.E., Bauguitte, S., Forster, G., Jones, R.L., Ouyang, B., 2013. Aircraft based four– channel thermal dissociation laser induced fluorescence instrument for simultaneous measurements of NO2, total peroxy nitrate, total alkyl nitrate, and HNO3. Atmospheric Measurement Techniques 6, 971–980. Di Carlo, P., Pitari, G., De Luca, N., Battisti, D., 2009. Observations of surface
radon in Central Italy. Environmental Geology 58, 431–436.
Di Carlo, P., Pitari, G., Mancini, E., Gentile, S., Pichelli, E., Visconti, G., 2007. Evolution of surface ozone in central Italy based on observations and statistical model. Journal of Geophysical Research–Atmospheres 112, art. no. D10316.
EEA (European Environment Agency), 2007. Air Pollution by Ozone in Europe in Summer 2006, Technical report No 5/2007, http:// reports.eea.eu.int, accessed in March 2014.
Founda, D., Giannakopoulos, C., 2009. The exceptionally hot summer of 2007 in Athens, Greece – a typical summer in the future climate?
Global and Planetary Change 67, 227–236.
Fuzzi, S., Decesari, S., Facchini, M.C., Cavalli, F., Emblico, L., Mircea, M., Andreae, M.O., Trebs, I., Hoffer, A., Guyon, P., Artaxo, P., Rizzo, L.V., Lara, L.L., Pauliquevis, T., Maenhaut, W., Raes, N., Chi, X.G., Mayol– Bracero, O.L., Soto–Garcia, L.L., Claeys, M., Kourtchev, I., Rissler, J., Swietlicki, E., Tagliavini, E., Schkolnik, G., Falkovich, A.H., Rudich, Y., Fisch, G., Gatti, L.V., 2007. Overview of the inorganic and organic composition of size–segregated aerosol in Rondonia, Brazil, from the biomass–burning period to the onset of the wet season. Journal of
Geophysical Research–Atmospheres 112, art. no. D01201.
Gao, S., Hegg, D.A., Hobbs, P.V., Kirchstetter, T.W., Magi, B.I., Sadilek, M., 2003. Water–soluble organic components in aerosols associated with savanna fires in southern Africa: Identification, evolution, and distribution. Journal of Geophysical Research–Atmospheres 108, art. no. 8491.
IPCC (Intergovernmental Panel on Climate Change), 2013. The Physical Science Basis. Contribution of Working Group I to the Fifth Assessment Report of the Intergovernmental Panel on Climate Change, Cambridge University Press, pp. 19–20.
Jaegle, L., Steinberger, L., Martin, R.V., Chance, K., 2005. Global partitioning of NOX sources using satellite observations: Relative roles of fossil fuel combustion, biomass burning and soil emissions. Faraday Discussions 130, 407–423.
Kaneyasu, N., Igarashi, Y., Sawa, Y., Takahashi, H., Takada, H., Kumata, H., Holler, R., 2007. Chemical and optical properties of 2003 Siberian forest fire smoke observed at the summit of Mt. Fuji, Japan. Journal of
Geophysical Research–Atmospheres 112, art. no. D13214.
Karl, T.G., Christian, T.J., Yokelson, R.J., Artaxo, P., Hao, W.M., Guenther, A., 2007. The tropical forest and fire emissions experiment: Method evaluation of volatile organic compound emissions measured by PTR– MS, FTIR, and GC from tropical biomass burning. Atmospheric
Chemistry and Physics 7, 5883–5897.
Kinne, S., Lohmann, U., Feichter, J., Schulz, M., Timmreck, C., Ghan, S., Easter, R., Chin, M., Ginoux, P., Takemura, T., Tegen, I., Koch, D., Herzog, M., Penner, J., Pitari, G., Holben, B., Eck, T., Smirnov, A.,
Dubovik, O., Slutsker, I., Tanre, D., Torres, O., Mishchenko, M., Geogdzhayev, I., Chu, D.A., Kaufman, Y., 2003. Monthly averages of aerosol properties: A global comparison among models, satellite data, and aeronet ground data. Journal of Geophysical Research–
Atmospheres 108, art. no. 4634.
Kleinman, L.I., 2005. The dependence of tropospheric ozone production rate on ozone precursors. Atmospheric Environment 39, 575–586. Langmann, B., Duncan, B., Textor, C., Trentmann, J., van der Werf, G.R.,
2009. Vegetation fire emissions and their impact on air pollution and climate. Atmospheric Environment 43, 107–116.
Lelieveld, J., Berresheim, H., Borrmann, S., Crutzen, P.J., Dentener, F.J., Fischer, H., Feichter, J., Flatau, P.J., Heland, J., Holzinger, R., Korrmann, R., Lawrence, M.G., Levin, Z., Markowicz, K.M., Mihalopoulos, N., Minikin, A., Ramanathan, V., de Reus, M., Roelofs, G.J., Scheeren, H.A., Sciare, J., Schlager, H., Schultz, M., Siegmund, P., Steil, B., Stephanou, E.G., Stier, P., Traub, M., Warneke, C., Williams, J., Ziereis, H., 2002. Global air pollution crossroads over the Mediterranean. Science 298, 794–799.
Meng, Z., Dabdub, D., Seinfeld, J.H., 1997. Chemical coupling between atmospheric ozone and particulate matter. Science 277, 116–119. Muhle, J., Lueker, T.J., Su, Y., Miller, B.R., Prather, K.A., Weiss, R.F., 2007.
Trace gas and particulate emissions from the 2003 southern California wildfires. Journal of Geophysical Research–Atmospheres 112, art. no. D03307.
Page, S.E., Siegert, F., Rieley, J.O., Boehm, H.D.V., Jaya, A., Limin, S., 2002. The amount of carbon released from peat and forest fires in Indonesia during 1997. Nature 420, 61–65.
Pfister, G.G., Wiedinmyer, C., Emmons, L.K., 2008. Impacts of the fall 2007 California wildfires on surface ozone: Integrating local observations with global model simulations. Geophysical Research Letters 35, art. no. L19814.
Querol, X., Pey, J., Minguillon, M.C., Perez, N., Alastuey, A., Viana, M., Moreno, T., Bernabe, R.M., Blanco, S., Cardenas, B., Vega, E., Sosa, G., Escalona, S., Ruiz, H., Artinano, B., 2008. PM speciation and sources in Mexico during the MİLAGRO–2006 Campaign. Atmospheric Chemistry
and Physics 8, 111–128.
RIPALA (Italian Civil Protection Agency and Lega Ambiente), 2008. Ecosistemi Incendi (Report on wildfires and ecosistems in summer 2007), Report No. 106, 56 pages.
Ryerson, T.B., Trainer, M., Holloway, J.S., Parrish, D.D., Huey, L.G., Sueper, D.T., Frost, G.J., Donnelly, S.G., Schauffler, S., Atlas, E.L., Kuster, W.C., Goldan, P.D., Hubler, G., Meagher, J.F., Fehsenfeld, F.C., 2001. Observations of ozone formation in power plant plumes and implications for ozone control strategies. Science 292, 719–723. Sousa, S.I.V., Martins, F.G., Alvim–Ferraz, M.C.M., Pereira, M.C., 2007.
Multiple linear regression and artificial neural networks based on principal components to predict ozone concentrations. Environmental
Modelling & Software 22, 97–103.
Val Martin, M., Honrath, R.E., Owen, R.C., Lapina, K., 2008. Large–scale impacts of anthropogenic pollution and boreal wildfires on the nitrogen oxides over the central North Atlantic region. Journal of
Geophysical Research–Atmospheres 113, art. no. D17308.
Verma, S., Worden, J., Pierce, B., Jones, D.B.A., Al–Saadi, J., Boersma, F., Bowman, K., Eldering, A., Fisher, B., Jourdain, L., Kulawik, S., Worden, H., 2009. Ozone production in boreal fire smoke plumes using observations from the tropospheric emission spectrometer and the ozone monitoring instrument. Journal of Geophysical Research–
Atmospheres 114, art. no. D02303.
Weimer, S., Alfarra, M.R., Schreiber, D., Mohr, M., Prevot, A.S.H., Baltensperger, U., 2008. Organic aerosol mass spectral signatures from wood–burning emissions: Influence of burning conditions and wood type. Journal of Geophysical Research–Atmospheres 113, art. no. D10304.