Seismic response of RC buildings during the M
w6.0 August 24,
2016 Central Italy earthquake: the Amatrice case study
Masi A.1, Chiauzzi L.1, Santarsiero G.1, Manfredi V.1, Biondi S.2, Spacone E.2, Del Gaudio C.3, Ricci P.3, Manfredi G.3, Verderame G.M.3
1Scuola di Ingegneria, Università della Basilicata, Potenza, Italy
[email protected],[email protected],[email protected],[email protected]
2
Dipartimento di Ingegneria e Geologia, Università degli Studi “G. D'Annunzio” Chieti-Pescara, Italy
[email protected],[email protected]
3Dipartimento delle Strutture per l’Ingegneria e l’Architettura, Università degli Studi di Napoli “Federico II”, Italy
[email protected],[email protected],[email protected],[email protected]
Keywords: Central Italy earthquake, RC buildings, field survey, seismic response, damage
scenario.
ABSTRACT
In the aftermath of the Mw6.0 August 24, 2016 Central Italy earthquake, the Authors carried
out a reconnaissance survey in the municipality of Amatrice and gathered extensive photographic evidence of damage, with emphasis on 37 reinforced concrete buildings located outside the historical centre. Damage distribution is generally represented by widespread cracking and/or collapse of the masonry infill panels at the lower buildings’ stories. Moreover, damage was observed in the columns due to the interaction with masonry infill panels. Starting from the collected information, POST - a mechanics-based damage prediction model - was applied in order to compare predicted damage distribution and damage observed during the field reconnaissance. The comparison shows an overall good agreement between the results of the POST method and the observed damage with a slightly conservative tendency by POST.
1. INTRODUCTION
Reinforced Concrete (RC) buildings represent a large portion of the built environment in many countries, including Italy and other Mediterranean earthquake-prone countries. While new buildings are designed according to state-of-the art seismic codes, older RC buildings were often designed for gravity loads only. Post-earthquake damage surveys and seismic vulnerability assessment studies on existing buildings frequently show outdated anti-seismic criteria and lack of detailing in both structural and non-structural elements. For these reasons,
older RC buildings often displayed unsatisfactory seismic behavior during past earthquakes (e.g., Mw=6.8 Southern Italy 1980, Mw=6.3 L’Aquila 2009, Mw=6.1 Emilia 2012).
In the 2009 L’Aquila earthquake, that caused a total of 197 fatalities in the urban centre of L’Aquila, more than 130 fatalities (66%) were due to RC buildings’ failures, even though the majority of buildings in the City center were masonry structures and only 30% were RC frames (Ricci et al., 2010). Several older RC buildings suffered heavy structural damage and in a few cases there was total collapse (Masi et al., 2011).
Such extensive damage to structural and non-structural elements in RC buildings was not found in previous Italian earthquakes, also because of the limited percentage of RC structures in the building stock of the affected zones, characterized by old historical centers mostly made of masonry structures. For example, Braga et al. (1982) report that in the towns hit by the 1980 Irpinia earthquake (Ml = 6.9), only 13% of buildings had RC structure. In the 2002 Molise earthquake (Ml = 5.3) Decanini et al. (2004) report that out of the 662 RC building inspected most showed no or light damage: only 3.5% experienced Damage Level 2 according to the EMS 98 scale (ESC 1998), corresponding to moderate damage to non-structural elements.
In the more recent 2012 Emilia earthquake sequence, most of the damage observed in RC building was limited to the external layer of the two-leaf masonry infills typically found in older Italian RC buildings. Only few severe damage cases were reported, with brittle failures in RC elements caused by either column-infill interaction or by poor reinforcement details (Manfredi et al., 2013).
After the August 24, 2016 Mw 6.0 Central Italy Earthquake the Authors carried out a
reconnaissance survey of structural and non-structural damage outside the “red zone” (i.e. the totally collapsed historic city center) of Amatrice - the most epicentral town hit by the August 24 earthquake - with a specific focus on RC buildings (Santarsiero et al., 2016). Following the damage survey, a vulnerability and damage estimation model, based on a mechanical approach, was applied in order to compare surveyed and predicted damage distributions. After a short description of the seismic event characteristics and an overview of the building types and of the seismic code evolution in the area under study, the paper presents the damage survey outcomes and the damage prediction model results.
2. CHARACTERISTICS OF THE AUGUST 24, 2016 SEISMIC EVENT
On August 24, 2016 Central Italy was struck by an earthquake of magnitude Mw6.0. Several
following this strong event, the area was hit by a long sequence with two additional strong events on October 26 (Mw 5.9) and October 30 (Mw 6.5) 2016, whose characteristics and
effects are not discussed in the present paper.
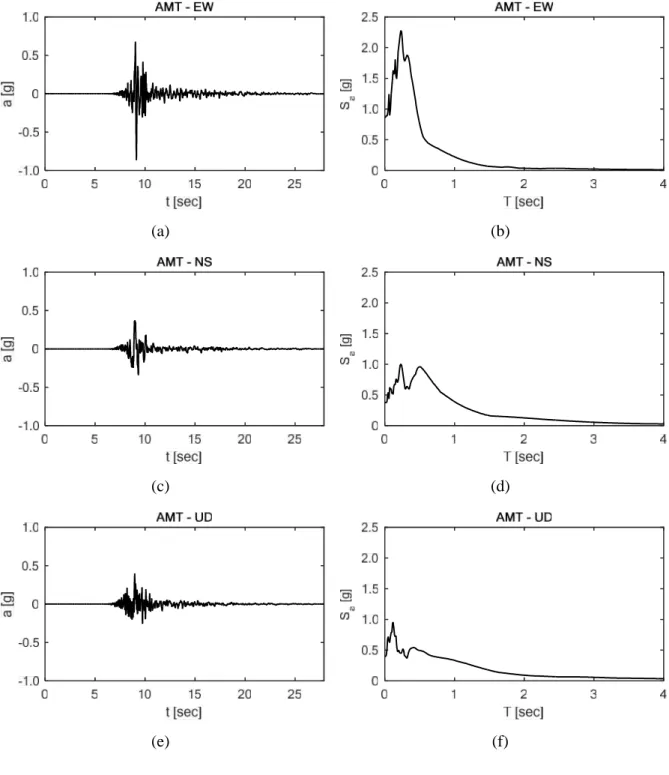
Figure 1 shows on the left column the triaxial recorded signals at the AMT (Amatrice) station during the August 24, 2016 mainshock and on the right column the relevant pseudo-acceleration response spectra (for 5% damping). The soil type at the AMT site is classified as B according to NTC (2008). This station is at the Joyner-and-Boore distance from the rupture plane RJB=1.4km.
(a) (b)
(c) (d)
Figure 1. Recorded signals and corresponding elastic pseudo-acceleration response spectra (5% damping) for
East-West EW (a,b), North-South NS (c,d) and Up-Down UD (e,f) directions, respectively.
The signals were extracted from the Engineering Strong-Motion (ESM) database (Luzi et al., 2016), which provides data processed according to Paolucci et al. (2011). Peak Ground Acceleration, Velocity and Displacement (PGA, PGV and PGD, respectively) and integral (Housner Intensity, IH) values of the triaxial signals recorded at the AMT station are reported
in Table 1. More insight into the question can be found in Iervolino et al. (2016) where detailed information on the ground motion analysis of this event is reported.
Component PGA (g) PGV (cm/s) PGD (cm) IH (cm) EW 0.88 45.0 3.0 75 NS 0.41 40.5 7.2 109 UP 0.40 26.2 6.6 85
Table 1. Peak (PGA, PGV and PGD) and integral (Housner Intensity - IH) parameter values for triaxial signals recorded at AMT station (soil class B).
(a) (b)
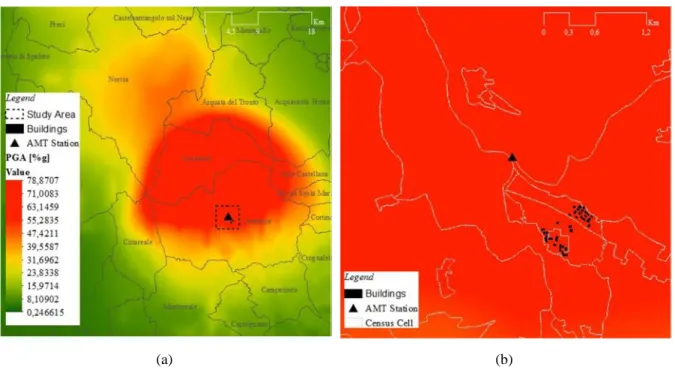
Figure 2. Shake map data of the August, 24 2016 earthquake - http://shakemap.rm.ingv.it/shake/index.html (a)
and zooming in on the study area (b).
Additionally, the Italian National Institute of Geophysics and Volcanology (INGV) published the shakemap of the event (http://shakemap.rm.ingv.it/shake/index.html). The map was generated using the ShakeMap® software package developed by the USGS Earthquake Hazards Program (Wald et al., 2006) in order to obtain maps of the peak ground motion parameters (Michelini et al., 2008). The data used to obtain the real-time maps is provided
mainly by the INGV broadband stations, some of which paired with strong motion sensors, in addition to strong motion data obtained from the Italian Strong Motion Network (RAN). The peak ground motion parameters (e.g., PGA and spectral pseudo-acceleration for different periods of vibration) are determined through different Ground Motion Prediction Equations (GMPEs) and, for events with Mw > 5.5, on the basis of the relations by Ambraseys et al.
(1996) and Bommer et al. (2000) for PGA and PGV, respectively. Figure 2a reports the ShakeMap of the August 24, 2016 event, with PGA values from 0 to 1.00g along with the location of each geo-referenced RC building analyzed in the present work. In order to define the seismic input for the fragility curves shown later in the paper, at each building location the corresponding PGA value was extrapolated from the shake map provided by INGV, as shown in Figure 2b.
3. ANALYSIS OF BUILDING TYPES AND DAMAGE
According to the ISTAT (2011) census data, Amatrice has a total area of about 175 square kilometers and a population of about 2650 inhabitants. The total number of buildings is 5288: of these, 4103 have a residential use while the number of units occupied by at least one person is 1278.
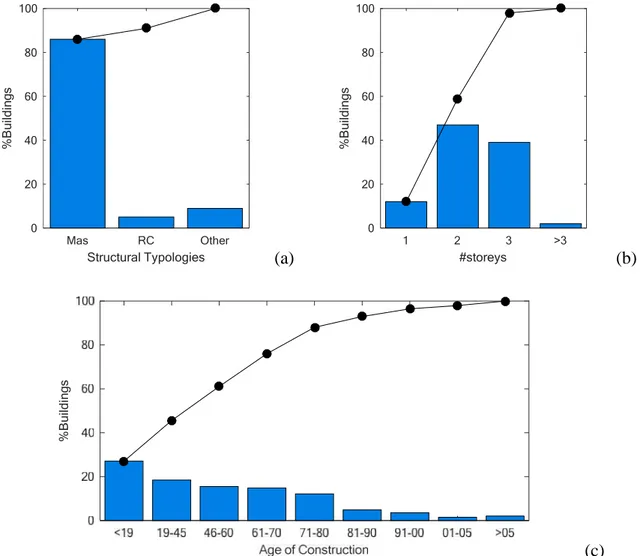
As shown in Figure 3a, 86% of residential buildings (3511) are masonry buildings (Mas), 5% are RC buildings (219), and 9% are made with other materials (373). Figure 13b shows that 12% of residential buildings is characterized by a single storey, 47% by two-storeys, 39% by three storeys and the remaining 2% by buildings with at least four floors. This is typical for an Italian small town such as Amatrice. Finally, 27% of residential buildings were built before 1919, 18% between 1919 and 1945, 43% between 1946 and 1980, and 12% after 1981 (Fig. 3c).
(a) (b)
(c)
Figure 3. Distribution of structural typologies (a), number of storeys (b) and age of construction (c) according
to ISTAT (2011) census data for the municipality of Amatrice.
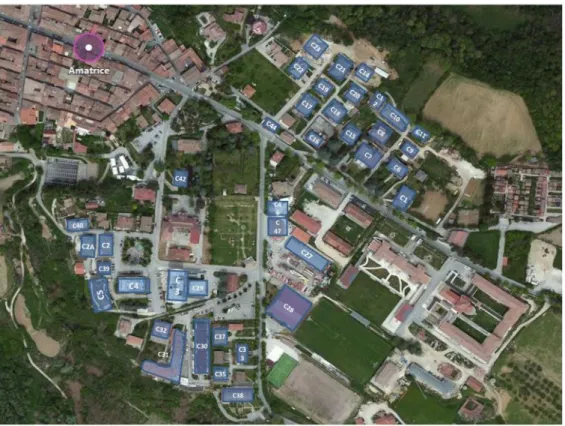
The RC buildings surveyed in this study are identified in Figure 4 and are located just outside the historical centre of Amatrice.
Mas RC Other Structural Typologies 0 20 40 60 80 100 % B ui ld in gs 1 2 3 >3 #storeys 0 20 40 60 80 100 % B ui ld in gs % B ui ld in gs
Figure 4. RC buildings surveyed in the town of Amatrice. RC buildings are indicated by a "C" prefix and are
progressively numbered from C1 to C37.
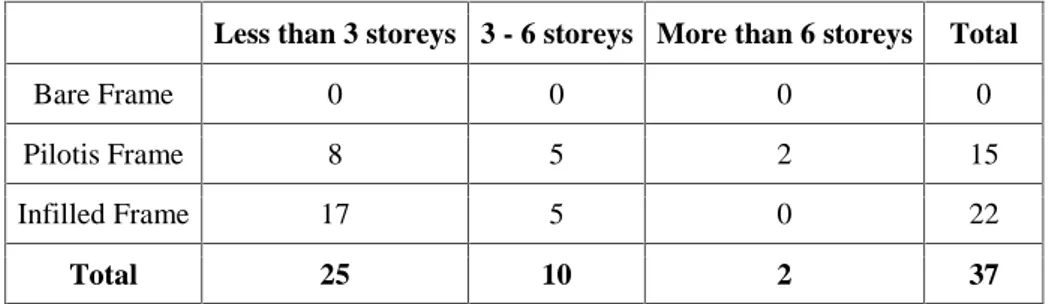
Considering the dataset reported in the ISTAT (2011) database, the 37 RC buildings inspected represent about 20% of the whole RC building stock of Amatrice. If we assume that all RC buildings are newer than the town masonry buildings and considering the percentage of RC buildings in the whole building stock, it is likely that the vast majority of RC buildings were constructed after 1981. Table 2 reports the typological characterization of the surveyed buildings, with a short identification based on the buildings’ height and on the presence of infill panels within the external structural frames. In accordance with previous vulnerability studies (Masi, 2003) three building types are considered in Table 2: frames without masonry infills (BF, Bare Frame), frames with regularly arranged masonry infills (IF, Infilled Frame) and frames without masonry infills at the ground floor (PF, Pilotis Frame). BF type, which represent buildings without effective infills (i.e. with infills having many and/or very large openings or badly connected to the structure so that their contribution to the strength and stiffness of the structure can be neglected), is completely absent in the surveyed building set. Most of the surveyed buildings are low rise (less than 3 storeys), about 25% have between 3 and 6 storeys and have infill panels at all levels (IF). There are only 2 buildings with more than 6 storeys.
Less than 3 storeys 3 - 6 storeys More than 6 storeys Total
Bare Frame 0 0 0 0
Pilotis Frame 8 5 2 15
Infilled Frame 17 5 0 22
Total 25 10 2 37
Table 2. Building typological characterization of surveyed building stock.
3.1 Present and past seismic hazard provisions for Amatrice and their implications
The seismic hazard provisions for Amatrice, their changes in recent decades and the Italian seismic design code evolution are briefly described in this section. Past and present seismic hazards provisions are used to evaluate the expected seismic capacity (with respect to the current seismic hazard code level and to the August 24, 2016 earthquake intensity) of existing RC buildings designed according to old technical standards.
The first Italian seismic zonation that included Amatrice dated back to 1927 (Regio Decreto Legge 431, 1927). Two seismic areas were identified: Amatrice belonged to the area with lower seismicity (second category). Further, Regio Decreto Legge 431 imposed a limitation on the max number of storeys (three or four) and generally prescribed lateral storey forces equal to 1/10 the storey weight for structures up to 15m high, and 1/8 for higher structures. Between 1930 and 1937, three seismic codes were introduced (Regio Decreto Legge 682, 1930; Regio Decreto Legge 640, 1935; Regio Decreto Legge 2105, 1937). The main novelties were in the definition of the lateral seismic forces. The base shear coefficient (i.e. the ratio between the base shear due to the horizontal seismic loads and the building seismic weight) for the second category seismic areas was reduced from 0.10 (Regio Decreto Legge 431) to 0.05 in Regio Decreto Legge 640 (1935) and to 0.07 in Regio Decreto Legge 2105 (1937). These prescriptions were left in the 1962 code (Legge 1684, 1962), that increased the maximum allowed number of storeys to seven.
The 1975 seismic code (DM 3/3/1975) introduced the structure dynamic properties in the design process. The effects of the seismic actions can be evaluated by means of static or dynamic analyses. In the static analysis, a triangular distribution of lateral forces is imposed, with the total seismic base shear Fh given by Eq. 1, where W is the total weight of the
structural masses; R the response coefficient, that depends on the fundamental period of the structure (T), and is 1 for T<=0.8 sec and 0.862/T^(2/3) for T>0.8 sec; C represents the seismic action (Eq. 2), and is defined by means of S, the seismic intensity parameter; ε and β
take into account, respectively, soil compressibility (ε = 1.00–1.30) and the possible presence of structural walls (β = 1.00–1.20).
Fh= C·R·ε·β·W (1)
C = (S – 2)/100 (2)
For Amatrice (second category seismic area), S was assumed equal to 9. If ε and β are taken equal to 1 (corresponding to stiff soil and absence of structural walls), for a structure with T<=0.8sec Fh/W was equal to 0.07 (similarly to the 1937 code). Fh/W represents an inelastic
design acceleration demand that implicitly includes a strength reduction factor that accounts for the structure dissipative capacity, similarly to what current technical codes do through the behavior factor q.
The 1986 and 1996 seismic codes (DM 24/1/1986; DM 16/1/1996) did not change the 1975 lateral force calculation procedure. However, the Limit State method was introduced for safety verifications and, at the Ultimate Limit State (ULS), the design accelerations were increased by a factor of 1.50. The first prescriptions based on to the performance-based seismic design approach were introduced in 1997 with a non-mandatory document (Circ. M.LL.PP. 65 1997).
In the 2003 seismic code (OPCM 3274, 2003) and its 2005 revision (OPCM 3431, 2005) an updated seismic input definition was introduced: elastic spectra on stiff soil (type A) were provided for each municipality, based on an updated national seismic hazard map. Note that soil identification substantially complies with the ground classification scheme provided in EC8 (CEN, 2004). Amatrice was classified as first category with the highest PGA (0.35g on ground type A for a 475 year return period design earthquake). The elastic spectrum was amplified depending on site-specific soil category and topographic conditions. The elastic spectrum was then reduced by the q factor value to obtain the inelastic design spectrum. OPCM 3274 introduced capacity design principles. This innovative Code was mandatory for strategic buildings and infrastructures only and its impact on the construction practice has been minor.
The current Italian building code (NTC, 2008) defines site specific PGA values for different design earthquake return periods TR based on the geographic coordinates of the site. For
Amatrice (latitude 42.633; longitude 13.286), the PGA is 0.259g on soil type A for TR=475
years. This is the PGA value of the elastic design spectrum at the Life Safety Limit State for ordinary structures.
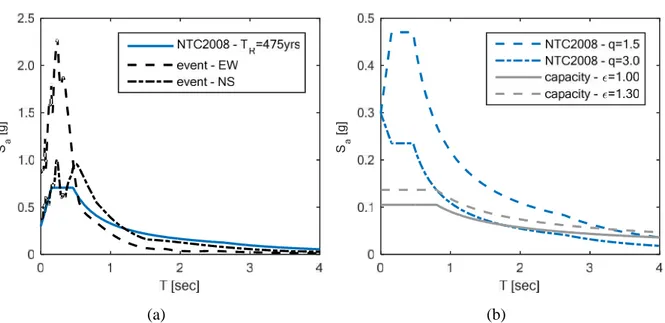
To give an idea of the maximum intensity values recorded during the August 24 event, the spectral characteristics of the elastic design spectrum provided by NTC (2008) are compared
with those of the records of the AMT station reported in Figure 1. Since the AMT station is on type B soil, the code prescribed PGA value is increased to 0.299g. Figure 5a superimposes the elastic design spectrum for TR=475yrs and the spectra of the two horizontal ground
motion components recorded at the AMT station. The spectral ordinates for the NS ground record exceed the code spectrum over a wide period range (up to approximately T=1 sec), whereas for the EW record the spectral ordinates are significantly higher than those of the code spectrum over a narrower period range (up to the end of the constant acceleration branch, corresponding to TC=0.46 sec) – which likely corresponds to the range of interest for
2-3 storey RC buildings – with peaks up to three times those of the code spectrum.
(a) (b)
Figure 5. Comparison between elastic design spectrum for TR=475yrs (soil type B) according to NTC (2008) for Amatrice (lat: 42.633; lon: 13.286) and elastic spectra of the ground motions recorded at AMT station in the EW and NS directions (a); comparison between NTC (2008) inelastic design spectra with different behavior factors q and DM 3/3/1975 and DM 16/1/1996 inelastic design spectra at ULS for Amatrice (second category) (b).
Based on the above-reported considerations, a comparison is proposed between the current seismic demand and the capacity of existing buildings. It is assumed that the seismic capacity of structures designed according to old codes is equal to the seismic demand prescribed by these codes, in terms of inelastic acceleration spectra. The current seismic demand (and the minimum required capacity) can be represented by current inelastic acceleration spectra using the behavior factor values prescribed by NTC (2008) for the assessment of existing RC buildings. More specifically, current provisions prescribe that q varies between 1.5 and 3.0. The minimum value is used for capacity checks of brittle mechanisms, whereas a value in the 1.5–3.0 range is prescribed in case of ductile mechanisms. Figure 5b displays the spectra for q=1.5 and 1=3.0. As previously mentioned, the spectrum prescribed by the 1975 code (modified by the coefficient equal to 1.50 prescribed by the 1996 code in order to obtain a
Sa [g ] S a [g ]
ULS spectrum comparable with current spectral demands) is characterized by a constant value of 0.105g (=0.07x1.50) for spectral ordinates between 0 and 0.8 sec, which is the most likely range of interest for the RC buildings in Amatrice, based on the number of storeys (see Figure 3). According to DM 3/3/1975, ε is 1.00 or 1.30, depending on the soil compressibility. Figure 5b reports both cases, since the soil type at the AMT station is non-stiff (namely type B soil).
Figure 5b clearly shows that in the 0-0.8 sec period range the current seismic demand is generally significantly higher than the seismic capacity required by the older seismic code, for both q=1.5 and q=3.0, irrespective of the soil-dependent value.
Considering that from Figure 5a it is reasonable to assume that in the same period range the demand deriving from the August 2016 earthquake significantly exceeds that of the current Italian code and, even more, it is likely to have largely exceeded the capacity required by the older codes. Thus, it can be roughly concluded that the RC buildings of Amatrice designed according to older codes most likely exceeded the Life Safety Limit State during the August 2016 earthquake. However, difficulties arise in this comparison mainly due to uncertainties in: i) assessing failure mechanisms (brittle or ductile) controlling the seismic capacity due to the absence of capacity design principles in older seismic codes, and ii) selecting the proper q value. In the case of a ductile failure, moreover, the fact that the demand exceeds the capacity simply indicates that the expected ductility demand is higher than the ductility capacity implicitly assumed by the current code for existing buildings. This assumption may underestimate the actual ductility capacity of the building. Finally, it should be noted that the previous considerations may lead to a conservative evaluation of the capacity provided by codes since they do not consider:
• the overstrength of buildings designed according to older codes;
• the role of non-structural elements, such as masonry panels and their stiffness/strength contribution (see sect. 4).
3.2 Examples of surveyed damage
In this section some examples of structural and non structural damage to RC structures in Amatrice, observed after the August 24 event, are reported. The Authors carried out a reconnaissance survey in the municipality of Amatrice and gathered extensive photographic evidence of damage. Specifically, photographic documentation on 37 reinforced concrete buildings located outside the historical centre was collected in the days immediately following the August 24 mainshock (Santarsiero et al., 2016). In general terms, structural
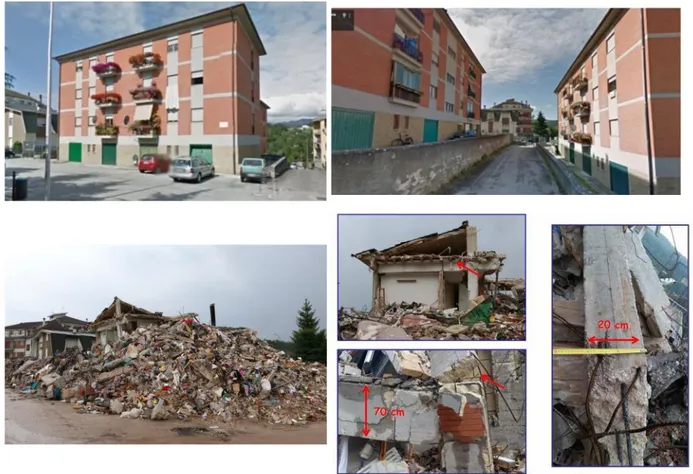
damage appears not so frequent and it seldom involves the whole structural system, while damage to non structural elements, mainly masonry infill panels, is heavy and widespread. Two totally collapsed buildings were found in the surveyed area and are shown in Figure 6 (top). The collapsed buildings are perfectly equal and, to the best of the Authors’ knowledge, were built at the same time, presumably during the ‘70s. A quick analysis of the collapsed buildings (Fig. 6, bottom, on the right) shows that the RC slabs were not well connected to the beams and the small size of one side of some column and beam members (i.e. 20 cm).
Figure 6. Images of two collapsed RC buildings before (top) and after (bottom, on the left) the August 2016
earthquake, with some details of buildings’ characteristics and damage (bottom, on the right).
As for the non-collapsed buildings, as already found in past earthquakes (e.g. L’Aquila 2009, Braga et al., 2011), damage frequently consisted of widespread cracking and/or collapse of the facade masonry infill panels (generally at the lower stories), sometimes accompanied by local damage in column members. Coherently with the design practice of the period (Braga et al., 2011), infills were generally made up of two layers (cavity walls), both of hollow brick masonry, having a total thickness of about 30cm (external panel 12 cm, hollow space about 10 cm, internal panel 8 cm). Infills were inserted into the surrounding RC frame whilst paying
scant attention to their connection to it. It was observed that in some cases the external layer was placed outside the structural frame and was not connected to the RC frame or to the internal masonry layer, also due to the presence of a thermally insulating panel between the two brick layers (this is a construction technique frequently found in older Italian RC buildings).
Figure7 7 displays a damage scenario observed in several cases: infills totally collapsed at one level, with moderate damage to a limited number of beam-column joints (in some cases also due to inappropriate concrete casting).
Figure 7. Partial collapse of the masonry infills of the second level (left) and moderate damage to a
beam-column joint (right).
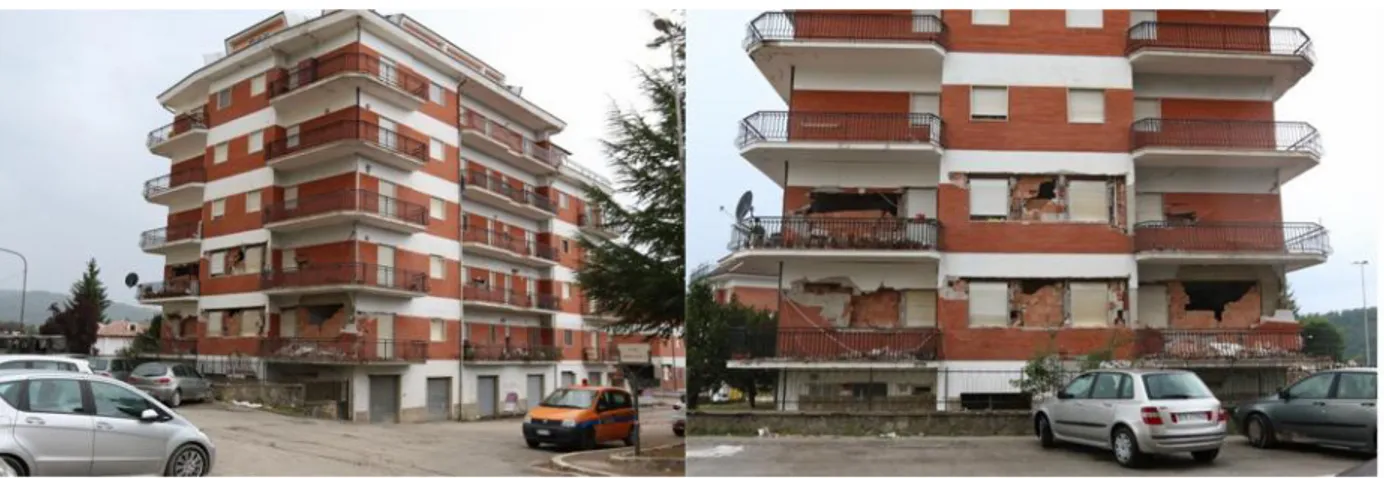
Figure 8 shows a similar non-structural damage distribution for a taller building, where the infills are severely damaged at two levels (in the more flexible direction only).
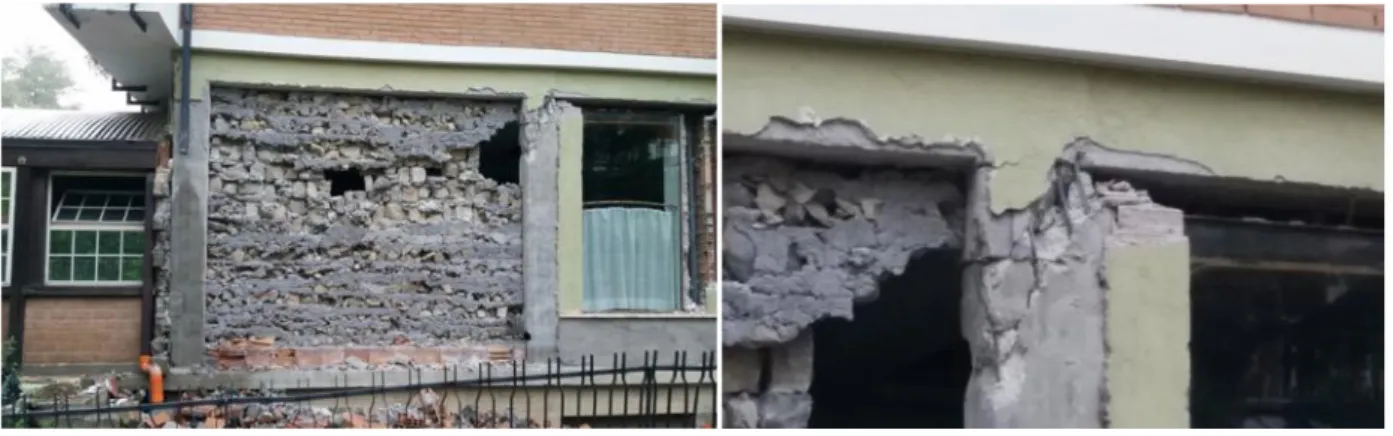
Figure 9 and Figure 10 show another typical mechanism found in several buildings, with heavy damage at column ends to be partially ascribed to masonry infill-column interaction, particularly in the building in Figure 10 where stone masonry infills are present. Generally, damage affects lateral columns (Fig. 9) and, in some cases, also internal columns (Fig. 10).
Figure 9. Damage to the brick masonry infill (left) and details of the column damage (right).
Figure 10. Damage to the stone masonry infill (left) and details of the column damage (right).
4. BUILDING DAMAGE SCENARIO AND COMPARISON WITH OBSERVED DATA
Due to the large number of structures that is analyzed when preparing damage scenarios, simplified methods are needed. Several mechanics-based models carry out a simplified evaluation of the nonlinear static response of the building. Among these, some are based on the Displacement-Based method (Priestley, 1997), such as Calvi (1999). The development of this procedure led to the Displacement-Based Earthquake Loss Assessment (DBELA) method (Pinho et al., 2002; Glaister and Pinho, 2003; Crowley et al., 2004; Crowley et al., 2006) and to the Simplified Pushover-Based Earthquake Loss Assessment (SP-BELA) method (Borzi et al., 2008). The two previous methods are based on the definition of a Pushover (PO) curve
using a simplified mechanics-based procedure. In Iervolino et al. (2007) the seismic risk of building classes is evaluated applying the Capacity Spectrum Method (CSM), that relies on static PO analyses on building models generated through a simulated design procedure. In all of these methods, uncertainties are taken into account by treating several input parameters as random variables. The CSM method is implemented in HAZUS (FEMA, 2001; Kircher et al., 1997a; Kircher et al., 1997b; Whitman et al., 1997) to compute fragility curves - including Damage State (DS) threshold capacities and associated variability - based on capacity curves defined for different building typologies.
Several studies on damage scenario evaluations were published following the 2009 L’Aquila earthquake. Some studies report damage predictions for the whole building stock (e.g. Bernardini et al., 2010; Sabetta et al., 2013), while others present single-building damage scenarios. Among these, D’Ayala and Paganoni (2011) analyzed the response of residential masonry buildings in the historic city center of L’Aquila and in the villages of Paganica and Onna. They report an EMS-98-based damage classification for each building and compare the predicted collapse mechanism (D’Ayala and Speranza, 2003) and the extent of damage (D’Ayala, 2005). A good agreement between observed and predicted damage is found. Fiorini et al. (2012) applied the SP-BELA procedure to the 2009 L’Aquila earthquake to generate damage scenarios both at regional and at local scale, using census data or single-building data collected by Tertulliani et al. (2011), respectively. A correlation between the Limit States adopted in SP-BELA and the damage evaluation outcomes provided by the Italian Department of Civil Protection through the AEDES forms (Agibilità e Danno nell’Emergenza
Sismica, Usability and Damage in Post-Earthquake Emergency - Baggio et al., 2007) is
assumed. In Biondi et al. (2012) a comparison of in situ post-earthquake survey (via AEDES forms) and Seismic Code Hazard was carried out showing a good correlation. In De Luca et al. (2015) empirical fragility curves for EMS-98 DSs were derived from a database of RC buildings located in Pettino (L’Aquila), and the simplified spectral-based mechanical procedure FAST (De Luca et al., 2013) was used to derive analytical fragility curves at the same DSs.
As for more recent Italian earthquakes, the damage scenarios presented by Verderame et al. (2014) for RC buildings hit by the Emilia 2012 earthquake were obtained through the analysis of benchmark structures assumed as representative of the whole building stock. A seismic capacity assessment is carried out on the benchmark structures within the N2 spectral assessment framework at different DSs defined according to a mechanical interpretation of the EMS-98 scale. The models explicitly include the infill panels’ contribution to the
structural response. Finally, in Del Gaudio et al. (2016) and Del Gaudio et al. (2017b) EMS-98-based damage scenarios were derived for the same database used in De Luca et al. (2013) and for a wider version, respectively, through the POST (Del Gaudio et al., 2015) simplified mechanical procedure. Fragility curves were derived for each single building in the database. A very good agreement is reported between predicted and observed damage. Since the POST procedure is used in this study, more details on this procedure are provided in the following section.
4.1 The POST method
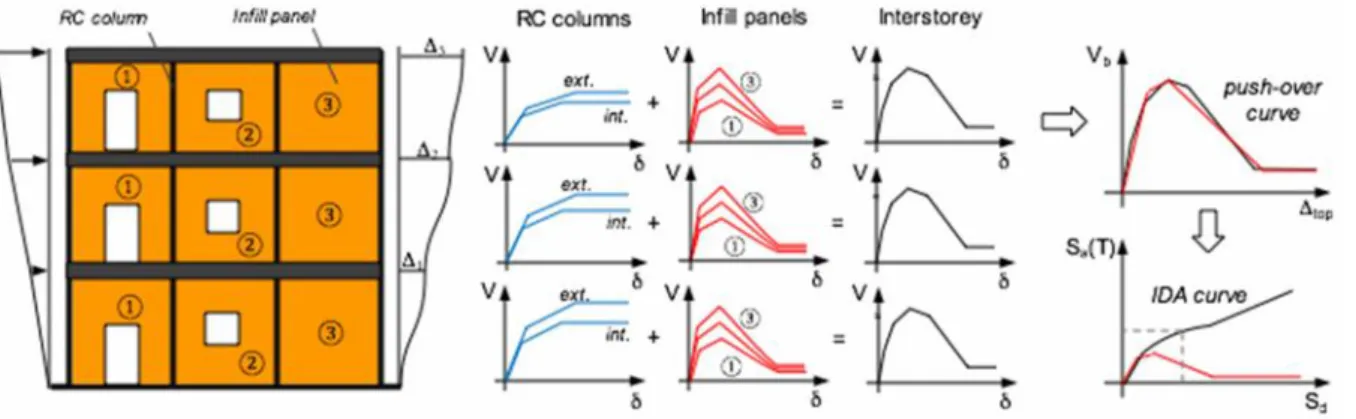
The POST (PushOver on Shear Type models) method is a simplified, mechanics-based procedure for the prediction of the damage caused by a given earthquake on a structure. POST is based on the following steps (summarized in Figure 11):
I. Definition of building model: the structural model of the building is created through a
simulated design procedure in compliance with design code prescriptions, professional practice and seismic classification of the selected area at the time of construction. Further details can be found in Verderame et al (2010);
II. Non-linear static response: the evaluation of the non-linear static response of the
building is performed through a simplified Shear-Type frame model. RC columns and infill elements respond in parallel: a tri-linear shear-displacement envelope is used for the RC columns and the multi-linear model by Panagiotakos and Fardis (1996) describes the infill panels’ shear-displacement response. The PO curve is obtained from a force-controlled procedure up to the peak strength and using a displacement-controlled procedure thereafter. The storey with the largest interstorey shear demand to shear strength ratio will be the only one to reach its peak strength and to continue onto the softening post-peak behavior;
III. Definition of DSs: the DSs are defined according to the damage classification proposed
by the European Macroseismic Scale EMS98 (Grünthal 1998);
IV. Seismic capacity assessment: the SPO2IDA (Vamvatsikos and Cornell, 2006)
frame-work is applied to evaluate the seismic capacity at the performance levels of interest in terms of spectral intensity measures;
V. Evaluation of fragility curves: depending on the knowledge level of the building, a few
parameters (m) are treated as random variables (for details see Tabel 4 at sect. 4.2). A Monte Carlo simulation is then performed to create a population of buildings. For each run, an n-vector with the n realizations of each random variable is extracted from the
relevant distributions to generate a building model. In each run the non-linear static response of the building model is computed. The displacements corresponding to predefined DS values are determined and the seismic capacity assessment is performed in terms of spectral ordinates and PGA values. The PGA capacity at a given DS is calculated for all generated buildings, and the corresponding cumulative frequency distributions provide the fragility curves.
Figure 11. POST method: building model, non-linear static response and seismic capacity assessment
Different configurations of infill panels can be considered: (i) solid, (ii) with window openings, and (iii) with door openings. Depending on the opening sizes, the non-linear behavior of the infill panels is modified according to the model by Kakaletsis and Karayannis (2009). Internal partitions are modeled through a shear-displacement relationship modified from that of the external panels to consider the different boundary conditions. More specifically, the post-cracking hardening of the multi-linear model by Panagiotakos and Fardis (1996) is replaced by a constant branch. As for the internal partitions, only solid- and with door opening-panels are considered. The internal partitions’ thickness is set equal to 100 mm, while for external panels it varies randomly in the 200÷240 mm range (see Table 4). A fundamental issue in the POST method is the DS definition. The qualitative description of the observational DSs reported by the EMS-98 damage classification are transformed into displacement thresholds - such as the Interstorey Drift Ratio (IDR) - for the building structural model. The infill panels’ capacity (IDRIP,DS1, IDRIP,DS2, IDRIP,DS3) is defined
according to the IDR limits proposed in Colangelo (2013).
In order to evaluate the RC columns’ IDR capacity, the expected failure mode has to be determined through the comparison between the flexural plastic shear and the shear strength. The former is evaluated from the plastic moment My as Vy=My/0.5 h. The column shear
(2004). A coefficient k that expresses the maximum ductility-related shear strength decrease is defined. It is assumed to be equal to 0.7 according to the Authors’ suggestion. Columns with (Vy/Vn)<k are expected to fail in flexure, while columns with (Vy/Vn)≥k are expected to
fail in shear or flexure-shear.
Hence, different IDR capacities are evaluated based on the qualitative descriptions of the EMS-98 DSs, as a function of the expected failure mode of the columns (left column of Table 3 for F-columns and right column for S-columns):
• DS1: IDR at the column cracking moment (IDRRC,cr);
• DS2: IDR at the column yield moment (IDRRC,y);
• DS3: IDR corresponding to concrete cover spalling (IDRRC,s) or longitudinal reinforcement buckling, (IDRRC,b) (for columns failing in bending) or Shear failure
(IDRRC,SF) according to the Aslani and Miranda (2005) model;
• DS4-5: IDR corresponding to the zero-strength point (IDRRC,pc) of the first column on the degrading backbone curve of the Haselton et al. (2008) model (for columns failing in bending) or to the loss of the axial load carrying capacity (IDRRC,A SF ) of the first
column (for columns failing in shear).
The above DS definitions are summarized in Table 3. Note that, due to the assumed Shear-Type behavior, the IDR of each DS is the minimum between the values reported in Table 3 for infill panels and RC columns. The capacity in terms of spectral ordinate Sa(T) is assessed
through an approximate IDA curve, evaluated according to the SPO2IDA framework (Vamvatsikos and Cornell, 2006) for the IDR value corresponding to the assumed DS. The corresponding PGA capacity is evaluated as a function of the elastic pseudo-acceleration response spectrum following the procedure by Bird et al. (2004) already applied in Del Gaudio et al. (2017b). The spectral shape is obtained from the spectral ordinates provided by Shakemap - PGA, Sa(0.3s), Sa(1s), Sa(3s) - at selected site.
EMS-98 Damage State
Infill panels RC columns
EMS-98 description POST
threshold EMS-98 description
POST threshold
F-Type* S-Type*
DS1 Negligible to slight damage
Fine cracks in partitions
and infills IDRIP,DS1
Fine cracks in plaster
over frame members IDRRC,cr
DS2 Moderate
damage
Cracks in partition and
infill walls. IDRIP,DS2 Cracks in columns IDRRC,y
DS3 Substantial to heavy damage
Large cracks in partition and infill walls, failure of individual infill panels
IP,DS3
IDR Spalling of concretecover, buckling of
reinforced bars min IDR
RC,s; IDRRC,b
RC,SFIDR DS4-5 Very heavy damage Large cracks in structural elements (...) Collapse of a few columns or of a single upper floor RC,pc
IDR for first column IDRRC,A SF for first column
*: F-Type: columns failing in Bending; S-Type: columns failing in Shear or Bending-Shear
The steps I to IV (i.e. up to the seismic capacity assessment) are repeated through a Monte Carlo simulation to generate a population of buildings. For each run a different building model is created and a non-linear static response is performed. DSs and corresponding IDR values are determined on the building response curve and seismic capacity assessment is carried out in terms of spectral ordinates and PGA values. At the end of the Monte Carlo simulation, the cumulative frequency distributions of PGA values for the different DSs provide the corresponding building fragility curves. The fragility curves, together with the PGA values obtained from the ShakeMap of the reference earthquake, allow to define the damage scenario for the investigated building dataset. More specifically, the intersections between the fragility curves and the PGA values allow to compute the probabilities of having
a given DSi (Pr ds DS | PGA
i
). This procedure is repeated for all DSi on all buildings of thedataset. Summing up all the probabilities of having a given DSi for all the buildings leads to
the damage distribution for the considered building dataset:
• The distribution of damage provides the number of buildings that fall in each DSi,
i=0:5, (N ds
DSi
);• The cumulative distribution of damage provides the number of buildings with a damage
state DSior higher (N ds
DSi
).Additional details on the procedure can be found in Del Gaudio et al. (2015), Del Gaudio et al. (2016), Del Gaudio et al. (2017b).
Figure 12. Conceptual representation of the procedure for deriving damage scenarios for the entire building
dataset starting from the seismic fragility assessment of single buildings.
4.2 Damage assessment of selected RC buildings using the POST method
The POST method was applied to the 37 RC buildings selected and surveyed in Amatrice. The geometric dimensions of the buildings (Lx, Lyand number of storeys) are evaluated from
the survey and are considered deterministic. Coherently with the survey, the buildings result roughly symmetric in plan (in both horizontal directions). The buildings’ structural models are defined through a simulated design procedure that follows the design practice and seismic prescriptions at time of construction. The beam and column dimensions and the relevant transverse and longitudinal reinforcements are evaluated following the procedure proposed by Verderame et al. (2010). Since Amatrice was classified in seismic zone II by Regio Decreto Legge 431 (1927) all buildings were designed considering both gravitational and seismic loads, considering the different technical codes’ prescriptions throughout the years (see Section 3.1).
Type of R.V. R.V. Reference Distribution Median value CoV [-]
Material properties
fc
Verderame et al. (2001); Masi
and Vona (2009) lognormal 25 MPa
31% or 25% fy STIL Verderame et al. (2012) lognormal Computed Computed Ew Circolare 617 (2009) lognormal 4500 MPa 30%
Geometrical characteristics sw - uniform [200; 220; 240]mm -Type of opening - uniform [solid; window opening; door opening] -Modelling
parameters EIy Haselton et al. (2008) lognormal 0.95*Computed 28%
Displacement thresholds
IDRRC,b Berry and Eberhard (2003) lognormal Computed 26.2% IDRRC,s Berry and Eberhard (2003). lognormal Computed 35.6% IDRRC,cap,pl Haselton et al. (2008 lognormal 1.02*Computed 54% IDRRC,SF Aslani and Miranda (2005) lognormal 1.05*Computed 55% IDRRC,A-SF Aslani and Miranda (2005) lognormal 1.03*Computed 33% IDRIP,DS1 Colangelo (2013) normal 0.03% 59.9% IDRIP,DS2 Colangelo (2013) normal 0.35% 96.5% IDRIP,DS3 Colangelo (2013) normal 1.62% 23.7%
Spectral Shape
Spectral shape from ShakeMap
http://shakemap.rm.ingv.it normal Computed Calculated
Record-to-record variability Record-to-record variability
Vamvatsikos and Cornell,
(2006) lognormal Computed
Table 4. Summary of median and CoV values for the selected random variables.
parameters of the distributions required for their definition. Specifically, the random variables considered in this study are: concrete compressive strength, fc; longitudinal and transverse
reinforcement yield strength, fy; mechanical characteristics of infill panels, (Ew, sw); all the
displacement thresholds of Table 3; spectral shape and record-to-record variability.
Data collected from the in-situ survey was processed to derive the distributions of the building main geometrical and typological parameters, as reported in Figure 13. The database contains information about geometrical, typological and morphological characteristics of the surveyed buildings (number of storeys, building area, age of construction), in addition to information regarding damage observed in structural and non-structural components (namely RC columns and infill panels).
(a) (b)
(c)
Figure 13. Distribution of: (a) number of storeys ;(b) Lx/Lyratio; (c) average plan surface
Damage levels are firstly evaluated following the approach reported at section 4 (Damage to
structural elements and existing short term countermeasures) of the AEDES survey form
separately for vertical structures (VSs) and infills/partitions (IPs). A four-level classification
1 2 3 4 5 6 7 #storeys 0 8 16 24 32 40 % B ui ld in gs 1.0-1.5 1.5-2.0 2.0-2.5 >2.5 Plan Ratio 0 8 16 24 32 40 % B ui ld in gs <50 50-70 70-100 100-130 130-170 170-230 230-300 300-400 400-500 500-650 Average Surface 0 8 16 24 32 40
scale is considered: D0 no damage, D1 slight damage, D2-D3 medium-severe damage, D4-D5 very heavy damage. Furthermore, information about the extent of damage is also considered, using the AeDES three level scale, based on the percentage of elements affected by a given damage level (1 3; between 1 3 and 2 3; 2 3). This data is available for all 37 RC buildings. As a result, 86% of buildings have no damage in VSs, while 3% and 11% have a medium-severe (D2-D3) and severe damage (D4-D5), respectively. On the other hand, damage to IPs is more severe and widespread: 35% of buildings are characterized by no damage (D0), 30% by slight damage (D1), 16% by medium-severe damage (D2-D3) and 19% by severe damage (D4-D5). Assuming the damage level D as the higher between that of VSs and IPs, Figure 14a displays the Ds distribution for the 37 Buildings, showing that 36% of buildings are affected by no damage (D0), 28% by slight damage (D1), 17% by medium-severe damage (D2-D3), and 19% by medium-severe damage (D4-D5). It is worth noting that the damage distribution is substantially dependent on the damage to IPs, thus confirming the key role played by non-structural elements in assessing damage in RC frame buildings.
Damage data collected according to the AeDES survey forms are further elaborated considering the six DSs given in the the EMS-98 scale (DS0 “No damage”; DS1 “Negligible
to slight damage”; DS2 “Moderate damage”; DS3 “Substantial to heavy damage”; DS4 “Very heavy damage”; DS5 “Destruction”). To this end the approach proposed by Dolce et al.
(1999) and Rota et al. (2008) for the VSs is followed, while the approach proposed by De Luca et al. (2013) and Del Gaudio et al. (2016) is used for the IPs. As a result, two different DSs, one for the VSs, the other for the IPs, are generally obtained for each building, therefore the higher one is assumed as the building DS. Figure 14b shows the related DS distribution for the 37 buildings. It should be noted that most of the buildings have damage between DS0 (35%) and DS1 (30%), while 16% of buildings has DS2, and lower percentages are found for DS3 (8%) and DS4-5 (11%).
(a) (b)
Figure 14. Distribution of surveyed damage for the 37 RC buildings under study: a) Damage Levels (Ds)
directly obtained from AeDES survey forms; b) Damage States (DSs) defined according to EMS-98 damage classification.
Figure 15 shows the damage distribution estimated by the POST procedure on the basis of the seismic input reported in the ShakeMaps. In the same Figure the comparison with the observed damage distribution deriving from AeDES survey form evaluated according to the EMS-98 classification (see Figure 14b) is reported. Large differences are found for no damage (DS0) and for heavy damage (DS3), while for the other DSs the agreement appears reasonably good, also taking into account the small number of buildings in the sample under study. Specifically, POST predicts a smaller number of buildings for the extreme damage states (DS0 and DS4-5), and a greater number of buildings for the intermediate DSs. With regard to the difference for DS4-5, it should be considered that the damage examples reported at sect. 3.2 (see Figure 6) show the presence of very poor details in collapsed buildings. A global comparison can be made on the basis of mean damage index DImed as defined in
(Masi et al., 2015): n f DS DI i i i med ) (
where DSiis a generic damage state (DSi = 1-4), fiis the related frequency. The summation is
carried out for n = 4, i.e. No damage state DS0 is not included. In this way, DImed varies
between 0 and 1, where DImed = 0 means total absence of damage and DImed = 1 means total
destruction.
A slightly higher DImed value is computed for POST results with respect to AeDES data, i.e.
0.42 vs 0.32. Therefore, globally, POST appears slightly conservative thus confirming the
D0 D1 D2-D3 D4-D5 Damage Levels 0 5 10 15 20 #B ui ld in gs DS0 DS1 DS2 DS3 DS4-5 Damage States 0 5 10 15 20 #B ui ld in gs
tendency of the analytically-derived models to be more conservative than the observed damage (e.g. Colombi et al., 2008; Masi et al., 2015).
Figure 15. Comparison between observed (AeDES) and predicted (POST) damage distributions for the 37 RC
buildings.
5. CONCLUSIONS
Damage and vulnerability assessment of 37 RC buildings, located outside the historical centre of Amatrice, was carried out after the Mw6.0 August 24, 2016 Central Italy earthquake. Most
buildings (86%) were reported to have slight or no structural damage according to the field survey based on AeDES forms (quick Italian Civil Protection Department survey form), while 3% and 11% had medium-severe (D2-D3) and severe (D4-D5) damage, respectively. Based on the same information, damage to infills and partitions is more severe and widespread. More specifically, 35% of buildings are characterized by no damage (D0), 30% by slight damage (D1), 16% by medium-severe damage (D2-D3) and 19% by severe damage (D4-D5). The behavior of RC buildings during the Amatrice earthquake reflects the damage observed during recent Italian earthquakes: the infills frequently suffer heavy damage, mainly located at the lower stories, and there is a significant interaction with the surrounding RC structure that causes, in some cases, severe damage to column members. Considering the earthquake severity, as shown by the high spectral accelerations’ values discussed in the paper, it can be concluded that most of the 37 RC buildings generally behaved well with respect to the life safety requirements. Some exceptions have been found and pointed out in the paper.
Availability of post-earthquake damage survey data allowed the application of the POST method, a procedure developed by some of the Authors to predict damage scenarios. The comparison between observed and POST-estimated damage distributions shows an overall good agreement, with a slightly conservative estimation of damage by POST, as already
found in other studies based analytical models (e.g. fragility curves proposed by Masi et al., 2015). The comparison shows, on the one hand, the need to enhance the prediction capabilities of the POST method for higher damage levels (DS4-5 is the only level in which POST underestimates damage). On the other hand, it points out the potential of the analytically-derived models, and specifically of POST method, in large scale vulnerability assessments, thus becoming powerful tools in predicting damage distributions over large areas in a seismic risk mitigation framework.
REFERENCES
Ambraseys N.N., Simpson, K.A. and Bommer, J.J. 1996. Prediction on horizontal response spectra in Europe, Earthquake Eng. And Struct. Dyn., 25, 4, 371-400.
Aslani H., and Miranda E., 2005. Probabilistic earthquake loss estimation and loss dis-aggregation in buildings. Diss. Stanford University.
Bernardini A, Lagomarsino S, Mannella A, Martinelli A, Milano L, Parodi S, Troffaes M 2010 Forecasting seismic damage scenarios of residential buildings from rough inventories: a case-study in the Abruzzo Region Italy. Proc Inst Mech Eng O J Risk Reliab 2244:279–296.
Berry M, Eberhard MO. Performance models for flexural damage in reinforced concrete columns. PEER Report 2003/18Pacific Engineering Research Center. Berkeley, CA, USA: University of California; 2003.
Bird JF, Bommer JJ, Bray JD, Sancio R, Spence RJS 2004 Comparing loss estimation with observed damage in a zone of ground failure: a study of the 1999 Kocaeli earthquake in Turkey. Bull Earthq Eng 23:329–360 Biondi, S., Fabietti, V., Sigismondo, S., Vanzi, I., “2009 Abruzzo Earthquake Reconstruction Plans: a multidisciplinary approach”, 15th World Conference on Earthquake Engineering, Lisbon, Portugal, September 24-28, 2012, Paper No. 3402, , Isbn: 978-1-63439-651-6
Bommer J.J., Elnashai, A.S. and Weir A.G. 2000. Compatible acceleration and displacement spectra for seismic design codes. In: Proceedings of the 12th World Conference on Earthquake Engineering, Auckland, New Zeland, Paper no. 207.2000.
Borzi B, Pinho R, Crowley H 2008 Simplified pushover-based vulnerability analysis for large scale assessment of RC buildings. Eng Struct 303:804–820
Braga F., Manfredi V., Masi A., Salvatori A., Vona M., 2011, “Performance of non-structural elements in RC buildings during the L’Aquila, 2009 earthquake”, Bull. Earthq. Eng, 91, 307-324.
Calvi GM 1999 A displacement-based approach for vulnerability evaluation of classes of buildings. J Earthq Eng 33:411–438
CEN 2004 Eurocode 8: design of structures for earthquake resistance—Part 1: general rules, seismic actions and rules for buildings, prEN 1998-1, December 2004, Brussels
Circolare del Ministero dei Lavori Pubblici n. 65 del 10/4/1997 1997 Istruzioni per l’applicazione delle “Norme tecniche per le costruzioni in zone sismiche” di cui al Decreto Ministeriale 16 gennaio 1996. G.U. n. 97 del 28/4/1997 in Italian
Circolare del Ministero dei Lavori Pubblici n. 617 del 2/2/2009 2009 Istruzioni per l’applicazione delle “Nuove norme tecniche per le costruzioni” di cui al D.M. 14 gennaio 2008. G.U. n. 47 del 26/2/2009 in Italian
Colangelo, F., 2013. Drift-sensitive non-structural damage to masonry-infilled reinforced concrete frames designed to Eurocode 8. Bulletin of Earthquake Engineering 11.6: 2151-2176.
Colombi M., Borzi B., Crowley H., Onida M., Meroni F., Pinho R. 2008, “Deriving vulnerability curves using Italian earthquake damage data”, Bull. Earthq. Eng., 63, 485-504.
Crowley H, Pinho R, Bommer JJ 2004 A probabilistic displacement-based vulnerability assessment procedure for earthquake loss estimation. Bull Earthq Eng 22:173–219
Crowley H, Pinho R, Bommer JJ, Bird JF 2006 Development of a displacement-based method for earthquake loss assessment. ROSE Research Report No. 2006/01, IUSS Press, Pavia
D’Ayala D 2005 Force and displacement based vulnerability assessment for traditional buildings. Bull Earthq
Eng 33:235–265
D’Ayala D, Paganoni S 2011 Assessment and analysis of damage in L’Aquila historic city centre after 6th April
2009. Bull Earthq Eng 91:81–104
D’Ayala D, Speranza E 2003 Definition of collapse mechanisms and seismic vulnerability of historic masonry
buildings. Earthquake Spectra 193:479–509
De Luca F, Verderame GM, Manfredi G 2013 FAST vulnerability approach: a simple solution for damage assessment of RC infilled buildings. In: Proceedings of the Vienna Congress on Recent Advances in Earthquake Engineering and Structural Dynamics & 13. D-A-CH Tagung VEESD20013, August 28–30, Vienna, Austria. Paper 436
De Luca F, Verderame GM, Manfredi G 2015 Analytical versus observational fragilities: the case of Pettino
L’Aquila damage data database. Bull Earthq Eng 134:1161–1181
Decreto Ministeriale n. 40 del 3/3/1975 1975 Approvazione delle norme tecniche per le costruzioni in zone sismiche. G.U. n. 93 dell’8/4/1975 in Italian
Decreto Ministeriale del 24/1/1986 1986 Istruzioni relative alla normativa tecnica per le costruzioni in zona sismica. G.U. n. 108 del 12/5/1986 in Italian
Decreto Ministeriale del 16/1/1996 1996 Norme tecniche per le costruzioni in zone sismiche. G.U. n. 29 del 5/2/1996 in Italian
NTC 2008. Decreto Ministeriale del 14/1/2008. Approvazione delle nuove norme tecniche per le costruzioni. G.U. n. 29 del 4/2/2008 in Italian
Del Gaudio C., Ricci P., Verderame G.M., Manfredi G., 2015. Development and urban-scale application of a simplified method for seismic fragility assessment of RC buildings. Engineering Structures, 91, 40-57.
Del Gaudio C., Ricci P., Verderame G.M., Manfredi G., 2016. Observed and predicted earthquake damage scenarios: the case study of Pettino L’Aquila after the 6th April 2009 event. Bulletin of Earthquake Engineering. Del Gaudio C., De Martino G., Di Ludovico M., Manfredi G., Prota A., Ricci P., Verderame G.M., 2017a. Empirical fragility curves from damage data on RC buildings after the 2009 L’Aquila earthquake. Bulletin of Earthquake Engineering. Vol. 15, Issue 4, pp. 1425-1450.
Del Gaudio C., Ricci P., Verderame G.M., Manfredi G., 2017b. Urban-scale seismic fragility assessment of RC buildings subjected to L'Aquila earthquake. Soil Dynamics and Earthquake Engineering. 96, 49–63.
FEMA 2001 HAZUS99 Technical Manual. Service Release 2. Federal Emergency Management Agency, Washington
Fiorini E, Borzi B, Iaccino R 2012 Real Time damage scenario: case study for the L’Aquila earthquake. In: Proceedings of the 15th world conference on Earthquake Engineering, September 24–28, Lisbon, Portugal Glaister S, Pinho R 2003 Development of a simplified deformation-based method for seismic vulnerability assessment. J Earthq Eng 7SI1:107–140
Grünthal G. 1998. Cahiers du Centre Européen de Géodynamique et de Séismologie: Volume 15 – European Macroseismic Scale 1998. European Center for Geodynamics and Seismology, Luxembourg.
Haselton C.B., Liel A.B., Taylor-Lange S., Deierlein G.G., 2008. Beam-column element model calibrated for predicting flexural response leading to global collapse of RC frame buildings. PEER Report 2007/03, Pacific Engineering Research Center, University of California, Berkeley, CA, USA.
ISTAT, 2011. 15° Censimento della popolazione e delle abitazioni 2011. Istituto Nazionale di Statistica. http://www.istat.it/it/censimento-popolazione/censimento-popolazione-2011.
Iervolino I., Baltzopoulos G., Chioccarelli E. 2016. Preliminary engineering analysis of the August 24th 2016, ML 6.0 central Italy earthquake records. Annals of Geophysics, 59, Fast Track 5, 2016; DOI: 10.4401/ag-7182
Iervolino I, Manfredi G, Polese M, Verderame GM, Fabbrocino G 2007 Seismic risk of R.C. building classes. Eng Struct 295:813–820
Joyner, W. B. and D. M. Boore 1981. Peak horizontal acceleration and velocity from strong-motion records including records from the 1979 Imperial Valley, California, earthquake. Bulletin of the Seismological Society of America, Vol. 71, No. 6, pp. 2011-2038.
Kakaletsis DJ, Karayannis CG 2009 Experimental investigation of infilled reinforced concrete frames with openings. ACI Structural Journal 1062:132–141.
Kircher CA, Nassar AA, Kustu O, Holmes WT 1997a Development of building damage functions for earthquake loss estimation. Earthquake Spectra 134:663–682.
Kircher CA, Reitherman RK, Whitman RV, Arnold C 1997b Estimation of earthquake losses to buildings. Earthquake Spectra 134:703–720.
Legge n. 1684 del 25/11/1962 1962 Provvedimenti per l’edilizia, con particolari prescrizioni per le zone sismiche. G.U. n. 326 del 22/12/1962 in Italian.
Luzi L, Puglia R, Russo E & ORFEUS WG5 2016. Engineering Strong Motion Database, version 1.0. Istituto Nazionale di Geofisica e Vulcanologia, Observatories & Research Facilities for European Seismology. doi: 10.13127/ESM.
Masi A. 2003, “Seismic vulnerability assessment of gravity load designed RC frames”, Bull. Earthq. Eng., 13, 371-395.
Masi A., Digrisolo A., Manfredi V., 2015. Fragility curves of gravity-load designed RC buildings with regularity in plan, Earthquakes and Structures, Vol. 9, No. 1, 1-27, DOI:10.12989/eas.2015.9.1.001.
Masi A., Santarsiero G., Digrisolo A., Chiauzzi L., Manfredi V., 2016. Procedures and experiences in the post-earthquake usability evaluation of ordinary buildings. Bollettino di Geofisica Teorica ed Applicata, 57 2, pp. 199-210.
Michelini A, Faenza L, Lauciani V, Malagnini L. ShakeMap implementation in Italy. Seismological research letters, 795; 2008, 688–697.
Ordinanza del Presidente del Consiglio dei Ministri n. 3274 del 20/3/2003 2003 Primi elementi in materia di criteri generali per la classificazione sismica del territorio nazionale e di normative tecniche per le costruzioni in zona sismica. G.U. n. 105 dell’8/5/2003 in Italian.
Ordinanza del Presidente del Consiglio dei Ministri n. 3431 del 3/5/2005 2005 Ulteriori modifiche ed integrazioni all’ordinanza del Presidente del Consiglio dei Ministri n. 3274 del 20 marzo 2003. G.U. n. 107 del 10/5/2005 in Italian.
Panagiotakos T.B., Fardis M.N., 1996. Seismic response of infilled RC frames structures. Proceedings of the 11th World Conference on Earthquake Engineering, Acapulco, México. Paper No. 225.
Paolucci R., Pacor F., Puglia R., Ameri G., Cauzzi C., Massa M. 2011 Record Processing in ITACA, the New Italian Strong-Motion Database. In Earthquake Data in Engineering Seismology - Predictive Models, Data Management and Networks, S. Akkar, P. Gülkan, T. van Eck Editors, ISBN: 978-94-007-0151-9 Printed version 978-94-007-0152-6 E-book version, Springer.
Pinho R, Bomber JJ, Glaister S 2002 A simplified approach to displacement-based earthquake loss estimation analysis. In: Proceedings of the 12th european conference on earthquake engineering, London, UK, September 9–13. Paper No. 738
Priestley MJN 1997 Displacement-based seismic assessment of reinforced concrete buildings. J Earthq Eng 11:157–192
Regio Decreto Legge n. 431 del 13/3/1927 1927 Norme tecniche ed igieniche di edilizia per le località colpite dai terremoti. G.U. n. 82 dell’8/4/1927 in Italian
Regio Decreto Legge n. 682 del 3/4/1930 1930 Nuove norme tecniche ed igieniche di edilizia per le località sismiche. G.U. n. 133 del 7/6/1930 in Italian
Regio Decreto Legge n. 640 del 25/3/1935 1935 Nuovo testo delle norme tecniche di edilizia con speciali prescrizioni per le località colpite dai terremoti. G.U. n. 120 del 22/5/1935 in Italian
Regio Decreto Legge n. 2105 del 22/11/1937 1937 Norme tecniche di edilizia con speciali prescrizioni per le località colpite dai terremoti. G.U. n. 298 del 27/12/1937 in Italian
Rota M, Penna A, Strobbia CL 2008 Processing Italian damage data to derive typological fragility curves. Soil Dynamics and Earthquake Engineering 2810:933–947
Sabetta F, Speranza E, Borzi B, Faravelli M 2013 Scenari di danno empirici e analitici a confronto con recenti terremoti italiani. Atti del 32° Convegno Nazionale GNGTS Gruppo Nazionale di Geofisica della Terra Solida, November 19–21, Trieste, Italy. Volume 2, pp 136–141. in Italian
Santarsiero G., Chiauzzi L., Masi A., 2016. Analisi del danneggiamento di edifici situati nella zona Sud del comune di Amatrice: confronto pre e post sisma del 24/08/2016 V2, available at http://www.reluis.it.
Sezen, H., and Moehle, J. P., 2004. Shear strength model for lightly reinforced concrete columns. J. Struct. Eng., 130 11, 1692–1703.
Tertulliani A, Arcoraci L, Berardi M, Bernardini F, Camassi R, Castellano C, Del Mese S, Ercolani E, Graziani L, Leschiutta I, Rossi A, Vecchi M 2011 An application of EMS98 in a medium-sized city: the case of L’Aquila Central Italy after the April 6, 2009 Mw 6.3 earthquake. Bull Earthq Eng 91:67–80
Verderame G.M., Polese M., Mariniello C., Manfredi G., 2010. A simulated design procedure for the assessment of seismic capacity of existing reinforced concrete buildings. Advances in Engineering Software, 412, 323-335. Verderame G.M., Ricci P., De Luca F., Del Gaudio C., De Risi M.T., 2014. Damage scenarios for RC buildings during the 2012 Emilia Italy earthquake. Soil Dynamics and Earthquake Engineering. Vol. 66, pp. 385-400. Verderame GM, Ricci P, Esposito M, Manfredi G. STIL v1.0 - Software per la caratterizzazione delle proprietà meccaniche degli acciai da c.a. tra il 1950 e il 2000. ReLUIS; 2012,〈http://www.reluis.it/〉.
Vamvatsikos D., Cornell C.A., 2006. Direct estimation of the seismic demand and ca-pacity of oscillators with multi-linear static pushovers through IDA. Earthquake Engineering and Structural Dynamics, 359, 1097-1117. Wald, D. J., Worden, C. B., Quitoriano, V., and K. L. Pankow 2006. ShakeMap® Manual, technical manual, users guide, and software guide, available at http://pubs.usgs.gov/tm/2005/12A01/pdf/508TM12-A1.pdf, 156 pp. Whitman RV, Anagnos T, Kircher CA, Lagorio HJ, Lawson RS, Schneider P 1997 Development of a national earthquake loss estimation methodology. Earthquake Spectra 134:643–661.