R E S E A R C H
Open Access
STAble: a novel approach to de novo
assembly of RNA-seq data and its
application in a metabolic model network
based metatranscriptomic workflow
Igor Saggese
1, Elisa Bona
1, Max Conway
2, Francesco Favero
3, Marco Ladetto
4,6, Pietro Liò
2, Giovanni Manzini
1,5and Flavio Mignone
1*From 12th and 13th International Meeting on Computational Intelligence Methods for Bioinformatics and Biostatistics (CIBB 2015/16)
Naples, Italy and Stirling, UK. 10-12 September 2015, 1-3 September 2016
Abstract
Background: De novo assembly of RNA-seq data allows the study of transcriptome in absence of a reference genome either if data is obtained from a single organism or from a mixed sample as in metatranscriptomics studies. Given the high number of sequences obtained from NGS approaches, a critical step in any analysis workflow is the assembly of reads to reconstruct transcripts thus reducing the complexity of the analysis. Despite many available tools show a good sensitivity, there is a high percentage of false positives due to the high number of assemblies considered and it is likely that the high frequency of false positive is underestimated by currently used benchmarks. The reconstruction of not existing transcripts may false the biological interpretation of results as– for example – may overestimate the identification of“novel” transcripts. Moreover, benchmarks performed are usually based on RNA-seq data from annotated genomes and assembled transcripts are compared to annotations and genomes to identify putative good and wrong reconstructions, but these tests alone may lead to accept a particular type of false positive as true, as better described below.
Results: Here we present a novel methodology of de novo assembly, implemented in a software named STAble (Short-reads Transcriptome Assembler). The novel concept of this assembler is that the whole reads are used to determine possible alignments instead of using smaller k-mers, with the aim of reducing the number of chimeras produced. Furthermore, we applied a new set of benchmarks based on simulated data to better define the performance of assembly method and carefully identifying true reconstructions.
STAble was also used to build a prototype workflow to analyse metatranscriptomics data in connection to a steady state metabolic modelling algorithm. This algorithm was used to produce high quality metabolic interpretations of small gene expression sets obtained from already published RNA-seq data that we assembled with STAble.
Conclusions: The presented results, albeit preliminary, clearly suggest that with this approach is possible to identify informative reactions not directly revealed by raw transcriptomic data.
* Correspondence:[email protected]
1Dipartimento di Scienze e Innovazione Tecnologica, Università degli Studi
del Piemonte Orientale, 15121 Alessandria, Italy
Full list of author information is available at the end of the article
© The Author(s). 2018 Open Access This article is distributed under the terms of the Creative Commons Attribution 4.0 International License (http://creativecommons.org/licenses/by/4.0/), which permits unrestricted use, distribution, and reproduction in any medium, provided you give appropriate credit to the original author(s) and the source, provide a link to the Creative Commons license, and indicate if changes were made. The Creative Commons Public Domain Dedication waiver (http://creativecommons.org/publicdomain/zero/1.0/) applies to the data made available in this article, unless otherwise stated.
Background
Among many applications of Next Generation Sequen-cing (NGS), [1] there are two techniques that can be ap-plied to the “omic” study of transcripts: RNA-seq [2] that profiles transcriptomes from a single organism or metatranscriptomics that profiles transcriptomes from a complex microbial community.
The first field is more established and allows to assess the presence of RNA transcripts in a biological sample at a given moment and to perform quantification. The latter is a more recent and less explored approach re-lated to metagenomics studies: while metagenomics aims at the identification of species, metatranscriptomics tries to characterize functional active bacteria and their metabolic interaction through the identification of the expressed transcripts.
Facing the growing promises and challenges of clinical metagenomics, metatranscriptomics analysis might rep-resent a critical step to further elucidate the role of com-plex microbial communities in the physiology and pathology of host organisms with a growing impact in clinical application. Indeed, most of the evidence so far accumulated is linked to the role of specific species, gen-era or families rather that to their metabolic output. While this might be optimal in terms of impact on im-mune recognition, imim-mune education and trigger of autoimmune processes, this approach may be insuffi-cient to fully elucidate the impact of microbial commu-nities on processes such as metabolic diseases, inflammatory response, and nutrient availability which are potentially more strictly related to the global meta-bolic output rather than to the phylogenesis of the species composing a specific microbiota.
From the perspective of data analysis, current NGS se-quencing platforms do not output the whole transcripts but short reads representing a fragment of the original sequence. Assembly of reads to reconstruct full tran-scripts represents a crucial point in data analysis and any subsequent steps in the analysis of transcriptomics data heavily rely on the quality of reconstructions. Even when a reference genome is available for the organism under study, the preventive assembly of reads can prove useful to reduce the complexity of the analysis by both increasing the length and lowering the number of input sequences. Currently state-of-the-art tools to reconstruct RNA-seq data are Bridger [3], Oases [4] and Trinity [5]. They share a similar approach as they rely on the identi-fication of k-mer sequences. Bridger then uses this infor-mation to build and traverse splicing graphs, while Oases and Trinity rely on De-Bruijn graphs.
Despite exhibiting a good sensitivity, all of them show two main limitations: i) high number of false positive re-constructions and ii) very high demands of computa-tional power.
Working with real data, in absence of any reference, it is not trivial - and maybe not even possible - to deter-mine the correctness of a reconstruction, so it is advis-able to use approaches that minimize the production of false reconstructions. High sensitivity claimed in bench-marks is often obtained by increasing the number of re-constructions, at the cost of increasing the number of false positives too, but this aspect is usually neglected. Furthermore, current approaches are very demanding in terms of hardware specifications and dedicated infra-structures are required but they are not always available.
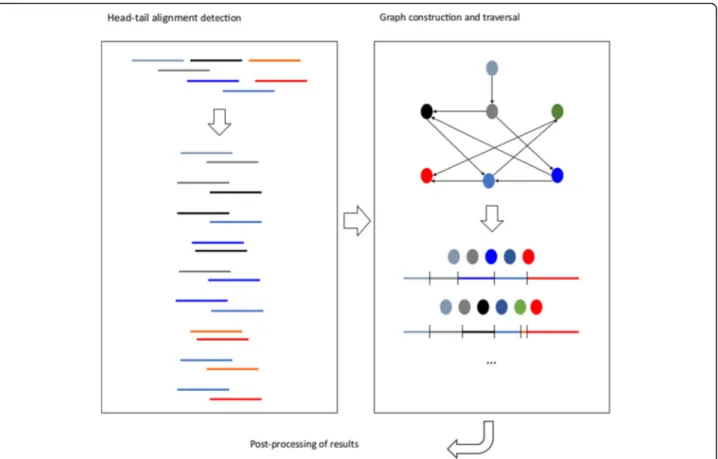
Here we present STAble, a prototype for a new de novo assembler developed around a novel approach quite differ-ent from the state-of-the-art: the whole reads are used to determine possible alignments instead of using smaller k-mers, with the aim of drastically reduce the number of chimeras produced. STAble consists of three different modules (see Fig.1). The first step is the efficient detec-tion of potential head-tail alignments between reads, pos-sibly with mismatches. This information is then used by the second module to build an unweighted directed graph, which is traversed by a custom algorithm that takes into account biological properties of input data. Finally, the third module performs some post-processing on results assuming no reference information is available.
In benchmarks, STAble has shown a sensitivity com-parable to current tools, while producing a smaller num-ber of false positive reconstructions. STAble is designed to be parallelizable and grid-friendly, allowing to split in-put datasets in blocks that can be processed sequentially or in parallel computations: this feature allows to per-form analyses even in absence of dedicated computing infrastructures. Moreover, STAble was tested with both simulated and real metatranscriptomics data. With sim-ulated data we were able to evaluate the ability of our system to correctly reconstruct transcripts while with real data we tested a prototype implementation of a new approach based on the integration of transcriptomics data with metabolic network.
Methods
STAble implements an original approach based on the idea to let the whole reads guide the assembly process, instead of considering smaller k-mers with the aim of re-ducing false positive reconstructions. Analysis workflow is shown in Fig.1and consists of three main modules:
1. Efficient detection of head-tail alignments. 2. Construction and traversal of an unweighted
directed graph.
3. Post processing of results.
The first module identifies overlapping reads: it starts from a fastq file containing input sequences and finds all
“valid” head-tail overlaps between pairs of reads. More precisely, the module is based on a custom procedure to identify head-tail overlaps that works as follow. Compu-tation starts by recoding input FASTQ from 8-bit ASCII characters to a 2-bit alphabet: this allows a reduction in memory consumption and speeds up subsequent opera-tions. No special symbol is assigned to ambiguous bases - such as N - but the same symbol reserved for C is used. This choice was made to keep the size of the new alphabet as low as possible. Results quality is not af-fected since reads with too many ambiguous bases are usually discarded by pre-processing steps because of low quality, so false matches with C are expected to be rare.
After initialisation is done, the algorithms proceed to analyse input sequences one at a time and each 7 nt long anchor is indexed. The first and last anchor scope (default: 5) anchors are searched in the anchor index to detect po-tential aligning reads. Read pairs are then shifted to align the anchor and Hamming distance of the overlapping area is efficiently computed as number of mismatches by using XOR metrics. The module returns a list of triples [i; j; k] where i and j represent two reads and k is the length of the overlap found between the tail of read i and the head of read j. A head-tail overlap is considered“valid” only if it satisfies the following two conditions:
1) Hamming distance between the length-k tail of sequence i and the length-k head of sequence j must not be greater than max_errors, where max_errors is the maximum number of mismatches allowed. (default: 10% of overlap length).
2) Overlap length k is a value between min_len and max_len. min_len is the minimum length allowed for overlaps (default: 20% of longer sequence between overlapping pair) and max_len is the maximum length allowed for overlaps (default: 90% of shorter sequence between overlapping pair). Although RNA-seq reads are supposed to have all the same length, our algorithm can work even on reads with different lengths. This is useful if sequences have been previously quality filtered.
The first condition is pivotal to guarantee a good alignment and avoid the reconstruction of chimeric transcripts.
Regarding the second condition, a minimum length for the overlap is required to avoid alignments caused by casual similarities.
Similarly, a maximum length must be set to deal with redundancy of information caused by high sequencing depths: an alignment caused by an excessive overlap will
Fig. 1 STAble’s analysis workflow. The first module detects potential head-tail alignments between reads, the second one uses this information to build and traverse a directed unweighted graph to reconstruct transcripts that are then post-processed before returning final output
generate a poorly informative contig (just “few” bases longer than the single read).
The triples returned by the first module are used to build an unweighted directed graph G where each node represents a read and an arc a head-tail alignment be-tween two reads. Ideally, every path in G from a source (node without incoming edges) to a sink (node without outgoing edges) would represent a transcript, or a frag-ment of it. However, due to the high sequencing depths the same transcript or fragment could be obtained by many paths differing for a small number of nodes and it would be too expensive to generate all of them. In addition, the presence of alternative splicing and head-tail alignments over repeated regions may lead to chimeric reconstructions. To take into account all these issues we have developed a custom traversal algorithm, which is the core of the second module.
The traversal algorithm executes a depth-first search starting from each source node in G. When a sink node is reached, the current path is output if its length is greater than the parameter minLenght. During the depth-first search we discard the current path if it turns out to be“too similar” to a prefix of an already generated path originating from the same source. For this purpose, two paths are considered “too similar” if they have the same first and last nodes, and one path can be obtained from the other replacing at most simThreshold nodes. Another technique to reduce the number of paths pro-duced by the traversal algorithm is to enforce that each path should contain a minimum number of“new” nodes. This is achieved as follows. Initially all nodes are colored white. When a path is output all its nodes are colored black, and we output a new path only if it contains at least whiteThreshold nodes. At the end of the graph tra-versal, all produced paths are transformed into tran-scripts by replacing each node with the read it represents and combining the reads keeping into ac-count the length of their overlaps. This set of transcripts is the output of the second module.
Finally, the third module processes the resulting tran-scripts are processed by performing various operations: the most important one is the clustering of sequences to remove the last degree of redundancy that is not de-tected by traversal algorithm.
The last module performs a post-processing removal of redundancies by using clustering algorithms. Currently we implement Usearch algorithm [6] for a fast removal of duplicated sequences.
Finally, all reconstructed transcripts are weighted by a quick bowtie alignment with raw reads.
STAble is designed to be parallelizable and grid-friendly in order to speed up analysis process and reduce hardware requirements. The idea is to random split in-put dataset in smaller blocks of size k: each block is then
processed with the three modules described above. Processing of each block can be performed sequentially or in parallel computations even on common desktop computers. Results are then merged, clustered and used as input for a new iteration: computation stops when dataset size becomes smaller than k.
Known limitations
Current version of STAble suffers from some known limi-tations. First it treats paired-end reads as single-end and does not takes advantages of the information provided by the paired end approach. Moreover, the head-tail align-ment of reads does not manage reverse complealign-ment pairing. This leads to the redundant identification of each transcript in both forward and reverse strand. This issue is minimised by the post-processing clustering applied but it would be advisable to upgrade the analysis procedure to correctly handle reverse complement pairing with an ex-pected improvement of reconstructions.
Benchmark
Simulated datasets were generated selecting random transcripts from human genome or from bacteria and producing reads using ART [7] as Illumina 150 bp single end with 20× of fold coverage and HiSeq 2500 quality profile. Reads were used to reconstruct transcripts with STAble and with other assemblers (default parameters were used). Reconstructed transcripts were aligned to database used for simulations using BLASTn: recon-structed transcripts not aligning as a single match for at least 85% of its length to any reference sequence were marked as False Positives. False Positives were then aligned to genome with GMAP [8]. If the mapping showed a realistic pattern of introns-exons the recon-structed transcript was labelled as False Positive class A – FPA, A match was considered “realistic” if resulting from GMAP analysis as a single path covering 90% of the transcript with at least 90% of similarity. False posi-tive reconstructions not satisfying these criteria were la-belled as False Positive class B - FPB (see results for details). True Positives transcripts reconstructing reference se-quences for at least 90% of their length were labelled as full-length reconstructed.
Hardware
STAble was run on a desktop computer equipped with a dual-core Intel Core i3 processor and 8GB of RAM. Other tools were tested on an Intel Xeon with 8 cores and 48GB of RAM.
Real datasets
Raw data described in [9] were downloaded from National Centre for Biotechnology Information Se-quence Read Archive, accession number SRA075938,
bioproject number PRJNA202380 [10]. We downloaded a total number of six metatranscriptomic samples with the following names according to [9] Sheep tag: S1234 = SRR1206249 (high), S1494 = SRR873453 (low), S1333 = SRR873463 (high), SRR1283 = SRR873451 (low), S1265 = SRR873454 (low), S1586 = SRR873461 (high). Raw datasets were downloaded in fastq format and used as input for our analysis workflow. The first step was the assembly of reads with STAble to reconstruct tran-scripts. We then downloaded bacterial FASTA sequences of orthologous genes of several pathways (glycolysis/glu-coneogenesis, butanoate metabolism, methane metabol-ism, carbon fixation pathways, phosphotransferase system) from KEGG ortholog database [11]. Recon-structed transcripts were aligned to bacterial genes using BLAST accepting matches with at least 92% of similarity and allowing up to 20 nucleotides of mismatches over flanking regions. The contingency tables with read count for each orthologous gene were processed with meta-bolic models to interpret gene expression. The method adopted is described in [12]. Briefly, we performed a blind Monte-Carlo simulation over feasible flux configu-rations. Specifically, we sampled from the set of flux configurations that provide near optimal biomass, while also providing optimality against a second random set of objectives. We then regard this large set of flux configu-rations as the set of possible populations (G), and then find the subset (termed L) of G which is consistent with the experimentally determined gene expression vectors. This is achieved by gene-by-gene parametric comparison between G and the set of gene expression vectors. Finally, we compare L to G to understand which reac-tions are most strongly influenced by the gene expres-sions tested. The overall method is depicted in Fig.2.
Results and discussion
STAble performance was compared with Bridger, Oases and Trinity. The prototype was tested on a large set of simulated data in order to be able to perform deeper evaluations on results quality. Benchmarks are usually performed on real data, using RNA-seq data from organ-isms for which a reference genome is available. Reconstructed transcripts are then compared with anno-tated transcripts to identify good quality reconstructions. By aligning reconstructed transcripts with genome it is possible to identify chimeric or unrealistic transcripts (i. e. mapping onto multiple chromosomes, with unlikely long introns or with inversions).
We benchmarked STAble with simulated data because they allow the unambiguous identification of true and false assembled transcripts which is only partially pos-sible with real datasets. By working with simulated data-sets we highlighted a new kind of false positive reconstruction which is not visible with real data. This
false positive type (we named False Positive class A -FPA) is depicted in Fig. 3. Let’s suppose that t1, t2 and
t3 are annotated alternative splicing forms of the same gene and that only t1 and t2 are present in sample: reads may allow to reconstruct t3 even if it is not effectively transcribed, so t3 has to be considered as a false positive. However, with real data it is not be possible to identify FPA (as t3 is a real transcript albeit not expressed in the sample under analysis) so the rate of false positives is likely to be underestimated.
In the following discussion we label as FPA (False Positive class A) false positive reconstructions that do not match any sequence in the database used for simula-tion but correctly match with genome, while we label as FPB (False Positive class B) chimeric reconstructions.
Simulated data and analysis were performed as de-scribed in Methods.
Table 1 summarizes the results obtained assembling 147,800 simulated reads from a pool of 200 transcripts and 1,088,271 reads from a pool of 6309 transcripts ran-domly picked from human transcriptome. Results show that STAble performs similarly with other tools in term of sensitivity. While Oases and Trinity show a slightly higher number of transcripts reconstructed at 100% it has to be noted that they are affected by a high rate of false positives. Bridger and Oases show the highest rate of FPB, Oases and Trinity show a very high number of FPA. Only STAble performs reconstructions with a low rate of both FPA and FPB. Moreover, it is important to underline that when considering reference transcripts reconstructed at least 70% STAble performance is al-most the same as Trinity’s. It is interesting to note that on benchmark datasets based on real data with reference
Fig. 2 Workflow of metatranscriptomic analysis integrated with metabolic network. a Raw reads from were assembled with a default STAble analysis. b Reconstructed transcripts were assigned to orthologous transcripts included in several metabolic pathways as annotated in KEGG database. A contingency table with KEGG reference genes binned with reconstructed transcripts is generated. c Metabolic model flux analysis to interpret gene expression using the method described in [13]
genome (for which a real set of actually expressed sequences is not available) - where it is not possible to de-tect FPA Trinity would have shown a very low false positive rate as FPA would have been detected as True Positives.
Finally, we performed some benchmarks on simulated bacterial metatranscriptomic datasets. Annotated tran-scripts from 10 different species were mixed and used to generate two additional simulated datasets: 1242040 reads from a pool of 11,815 mixed bacterial transcripts, and 2,382,790 reads from a pool of 43,578 mixed bacterial tran-scripts. Results are summarized in Table 2. STAble has shown the highest sensibility with a comparable FPR with the other programs. It is interesting to note that due to ab-sence of alternative splicing in bacterial transcriptome it is not possible to produce FPA class errors (see Table 2). Noticeably STAble - running on a desktop computer equipped with 8GB of RAM - was the only assembler cap-able of completing the assembly task with the larger data-set. All existing tools terminated returning an out of memory error even on a computer with 48GB of RAM.
To test our workflow on real data we took advantage of the work by Kamke and colleagues [9]. In their paper, they make a comparison of rumen microbiome of high and low methane yield sheep with metatranscriptomic studies. We downloaded raw reads from SRA for 3 high and 3 low methane yield samples and we processed them as described in Materials and Methods, then we compared our results with the ones discussed by Kamke and colleagues [9]. Briefly, reads were assembled with STAble, mapped to KEGG orthologous genes of few ba-sics bacteria metabolic pathways. The usage of few meta-bolic pathways instead of the more time-consuming usage of the entire genes set is consistent with our ap-proach. Indeed, as described in Materials and Methods the metabolic flux algorithm used can work well even with small gene expression sets. In particular, we com-pared reconstructed transcripts with genes involved in some metabolic pathway such as the glycolysis/gluco-neogenesis pathway (as an example of basic bacterial metabolism pathway), the butanoate metabolism and the
Fig. 3 Supposing that only splicing variants t1 and t2 are present in the sample, reads may allow to reconstruct t3 that is a valid annotated alternative but has to be considered as a false positive
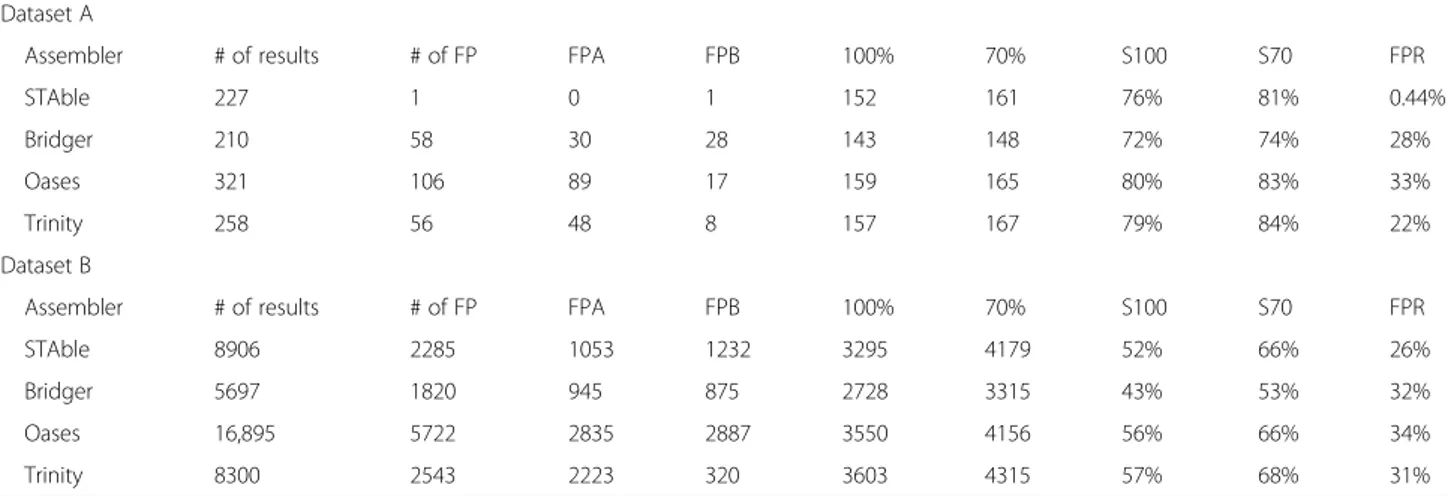
Table 1 Results on 200 (Dataset A) and 6309 (Dataset B) random human transcripts. STAble returned the most reliable set of results showing a sensitivity comparable to other assemblers while producing only 3 false positives
Dataset A
Assembler # of results # of FP FPA FPB 100% 70% S100 S70 FPR
STAble 227 1 0 1 152 161 76% 81% 0.44%
Bridger 210 58 30 28 143 148 72% 74% 28%
Oases 321 106 89 17 159 165 80% 83% 33%
Trinity 258 56 48 8 157 167 79% 84% 22%
Dataset B
Assembler # of results # of FP FPA FPB 100% 70% S100 S70 FPR
STAble 8906 2285 1053 1232 3295 4179 52% 66% 26%
Bridger 5697 1820 945 875 2728 3315 43% 53% 32%
Oases 16,895 5722 2835 2887 3550 4156 56% 66% 34%
Trinity 8300 2543 2223 320 3603 4315 57% 68% 31%
Assembler Name of the assembler, # of results Total number of reconstructed transcripts, # of FP Number of False Positive results, FPA False Positive class A, FPB False Positive class B,100% Number of full reconstructed transcripts, 70% Number of transcripts reconstructed at 70%, S100 Percentage of full reconstructed transcripts,S70 Percentage of transcripts reconstructed at 70%, FPR False Positive Ratio
methane metabolism pathway. We also used the carbon fixation pathways in prokaryotes and the membrane transport pathway of phosphotransferase system that is one of the pathway cited and analysed by Kamke and colleagues [9].
The contingency tables with genes and their abun-dance were used to feed a metabolic model network to interpret gene expression. The simplest approach when performing this kind of analysis is to directly design a mapping function, which projects the gene expressions as constraints on their associated reactions in the meta-bolic model. This gives a one to one mapping between gene expression vectors and metabolic models, and ne-cessitates a great degree of care in the design of the mapping function. Specifically, the mapping function needs to produce detectable differences between meta-bolic models, while also ensuring that predicted fluxes are all within the bounds of what is biologically feasible.
Here, we take a radically different approach. Rather than parameterizing metabolic models using gene ex-pression vectors directly, we instead perform a blind Monte-Carlo simulation over flux configurations that provide near optimal biomass. We then regard this large set of flux configurations as the set of possible popula-tions (G), and then find the subset (termed L) of G, which is consistent with the experimentally determined gene expression vectors. Finally, we compare L to G to understand which reactions are most strongly influenced by the gene expressions tested (summarized in Table 3
and Table4).
Results obtained from our metabolic network analysis are consistent with data about differences in usage of Glycolysis/Gluconeogenesis and Butanoate Biosyntesis pathways described in the paper (data not shown). Inter-estingly our analysis identified new pathways that are in-dependent from the original set of transcripts used to feed the metabolic model network. Indeed, our meta-bolic network analysis identified that both in LMY and HMY bacteria, transport channels are highly expressed.
STAble can improve data about gene coding for trans-port membrane proteins and for nutrient (Fe, Ca and Na) transport in bacterial cells both in LMY and HMY, comparing results with those obtained by Kamke and coworkers [9]. Moreover, the performed analysis re-vealed carbohydrate metabolism as dominating followed by amino acid metabolism, results in agreement with those reported by Hinsu and colleagues that described functionally active bacteria and their biological processes in rumen of buffalo (Bubalus bubalis) adapted to differ-ent dietary treatmdiffer-ents [13].
These results are intriguing because they confirm that our workflow appears to produce more punctual informa-tion regarding metabolic pathways upregulated or down-regulated into the same microbiome, not directly correlated with the transcripts, identified with raw RNA-seq data.
Our results highlight the potential of our new ap-proach to de novo assembly of RNA-seq data. STAble’s sensitivity is comparable to other assemblers while the rate of false positives which has been our main focus -is lower. When working in absence of any reference a reasonable trade-off between sensitivity and accuracy is very important for the all the subsequent analyses that have to be performed on results. Indeed false positive re-constructions may lead to biased biological interpret-ation of results as– for example – they might lead to an overestimation of“novel” transcripts.
In addition, STAble was designed to be parallelizable and grid-friendly, allowing to perform the computation-ally onerous assembly task even in absence of dedicated infrastructures: is quite surprising that in one of the test scenarios existing assemblers failed with 48GB of RAM while STAble was able to run on a desktop PC.
STAble was successfully integrated with a new analysis workflow based on metabolic model network recently described in [12]. The combination of STAble with this workflow can be used as an “expert system” to obtain more punctual information about the metabolic path-ways activated in a bacterial community. The same level of information is not fully available when using only metagenomics and even meta-transcriptomics data.
Conclusions
Metatranscriptomics is the community based evolution of RNA-Seq analysis and might represent a critical step Table 2 Eleven thousand eight hundred fifteen (dataset C) and
43,578 (dataset D) mixed bacterial transcripts. STAble shown the best sensitivity while producing the lowest false positive ratio alongside with Trinity. Due to absence of alternative splicing in bacterial transcriptome it is not possible to produce FPA class errors. With the larger dataset it is not possible to compare results with existing assemblers as they terminated with an out of memory error Dataset C Assembler # of results # of FP 100% 70% S100 S70 FPR STAble 13,985 983 10,007 10,263 85% 87% 7% Bridger 5873 253 8510 9075 72% 77% 4% Oases 5579 268 6687 8603 57% 73% 5% Trinity 7597 145 9136 9565 77% 81% 2% Dataset D Assembler # of results # of FP 100% 70% S100 S70 FPR STAble 134,110 1040 20,800 35,424 48% 81% 0.8%
Assembler Name of the assembler, # of results Total number of reconstructed transcripts,# of FP Number of False Positive results, FPA False Positive class A, FPB False Positive class B, 100% Number of full reconstructed transcripts, 70% Number of transcripts reconstructed at 70%,S100 Percentage of full reconstructed transcripts,S70 Percentage of transcripts reconstructed at 70%, FPR False Positive Ratio
to further elucidate the role of complex microbial com-munities in their environment and in the physiology and pathology of host organisms. From a clinical per-spective most of the evidence so far accumulated (and that can be collected from standard metagenomics studies) is linked to the role of specific species, genera or families rather than their metabolic output. While
this might be optimal in terms of impact on immune recognition, immune education and trigger of auto-immune processes, this approach may be insufficient to fully elucidate the impact of microbial communities on processes such as metabolic diseases, inflammatory re-sponse, and nutrient availability which are potentially more strictly related to the global metabolic output Table 3 List of all bacterial metabolic reactions identified in high methane yield animals
Abbreviation Subsystem Official Name
NADH16pp Oxidative Phosphorylation NADH dehydrogenase (ubiquinone-8 & 3 protons) (periplasm) PROt2rpp Transport L-proline reversible transport via proton symport (periplasm)
PROt4pp Transport Na+/Proline-L symporter (periplasm)
GLCP2 Glycolysis/Gluconeogenesis glycogen phosphorylase GLCS1 Glycolysis/Gluconeogenesis glycogen synthase (ADPGlc)
GLGC Glycolysis/Gluconeogenesis glucose-1-phosphate adenylyltransferase
THRt2rpp Transport L-threonine reversible transport via proton symport (periplasm) THRt4pp Transport L-threonine via sodium symport (periplasm)
INSt2pp Transport inosine transport in via proton symport (periplasm) INSt2rpp Transport inosine transport in via proton symport reversible (periplasm) PPCSCT Alternate Carbon Metabolism Propanoyl-CoA: succinate CoA-transferase
SUCOAS Citric Acid Cycle succinyl-CoA synthetase (ADP-forming)
TALA Pentose Phosphate Pathway transaldolase
ACCOAL Alternate Carbon Metabolism acetate-CoA ligase (ADP-forming)
GLUt4pp Transport Na+/glutamate symport (periplasm)
PPAKr Alternate Carbon Metabolism Propionate kinase PTA2 Alternate Carbon Metabolism Phosphate acetyltransferase
THFAT Folate Metabolism Tetrahydrofolate aminomethyltransferase
FOMETRi Folate Metabolism Aminomethyltransferase
ADK3 Nucleotide Salvage Pathway adentylate kinase (GTP)
FBA3 Pentose Phosphate Pathway 7-bisphosphate D-glyceraldehyde-3-phosphate-lyase PFK_3 Pentose Phosphate Pathway phosphofructokinase (s7p)
URAt2pp Transport uracil transport in via proton symport (periplasm) URAt2rpp Transport uracil transport in via proton symport reversible (periplasm) GLYt2pp Transport glycine transport in via proton symport (periplasm) GLCP Glycolysis/Gluconeogenesis glycogen phosphorylase
NDPK1 Nucleotide Salvage Pathway nucleoside-diphosphate kinase (ATP:GDP)
CA2t3pp Inorganic Ion Transport and Metabolism calcium (Ca + 2) transport out via proton antiport (periplasm) CAt6pp Inorganic Ion Transport and Metabolism calcium / sodium antiporter (1:1)
PPKr Oxidative Phosphorylation polyphosphate kinase
URIt2pp Transport uridine transport in via proton symport (periplasm) URIt2rpp Transport uridine transport in via proton symport reversible (periplasm)
NADH18pp Oxidative Phosphorylation NADH dehydrogenase (demethylmenaquinone-8 & 3 protons) (periplasm)
FRD3 Citric Acid Cycle fumarate reductase
ALAt2pp Transport L-alanine transport in via proton symport (periplasm) ALAt2rpp Transport L-alanine reversible transport via proton symport (periplasm) GLYt2rpp Transport glycine reversible transport via proton symport (periplasm)
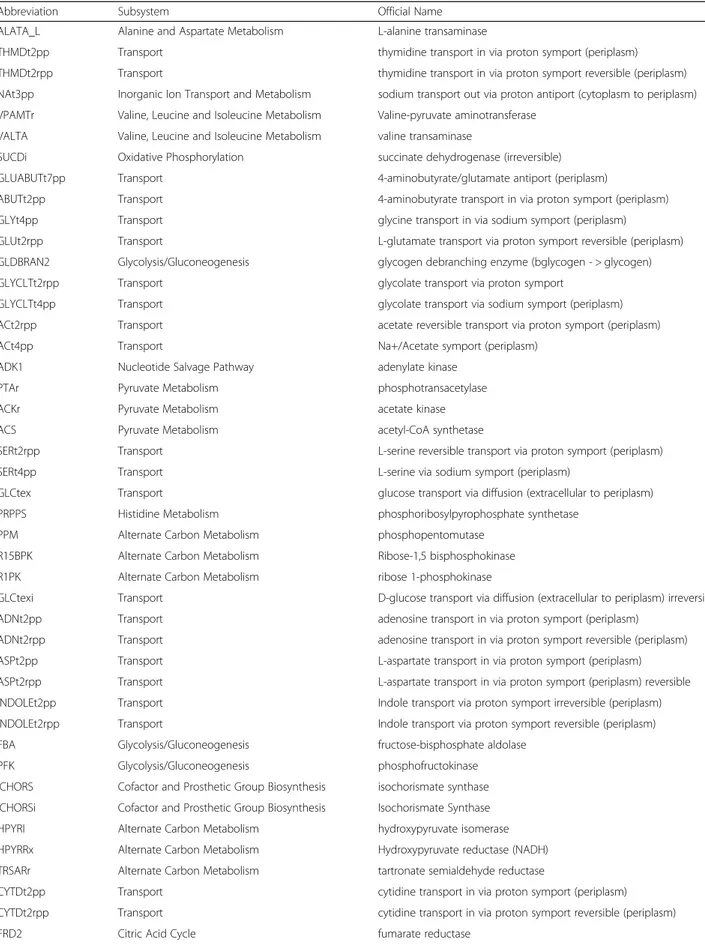
Table 4 List of all bacterial metabolic reactions identified in low methane yield animals
Abbreviation Subsystem Official Name
ALATA_L Alanine and Aspartate Metabolism L-alanine transaminase
THMDt2pp Transport thymidine transport in via proton symport (periplasm) THMDt2rpp Transport thymidine transport in via proton symport reversible (periplasm) NAt3pp Inorganic Ion Transport and Metabolism sodium transport out via proton antiport (cytoplasm to periplasm) VPAMTr Valine, Leucine and Isoleucine Metabolism Valine-pyruvate aminotransferase
VALTA Valine, Leucine and Isoleucine Metabolism valine transaminase
SUCDi Oxidative Phosphorylation succinate dehydrogenase (irreversible) GLUABUTt7pp Transport 4-aminobutyrate/glutamate antiport (periplasm)
ABUTt2pp Transport 4-aminobutyrate transport in via proton symport (periplasm) GLYt4pp Transport glycine transport in via sodium symport (periplasm)
GLUt2rpp Transport L-glutamate transport via proton symport reversible (periplasm) GLDBRAN2 Glycolysis/Gluconeogenesis glycogen debranching enzyme (bglycogen - > glycogen) GLYCLTt2rpp Transport glycolate transport via proton symport
GLYCLTt4pp Transport glycolate transport via sodium symport (periplasm) ACt2rpp Transport acetate reversible transport via proton symport (periplasm)
ACt4pp Transport Na+/Acetate symport (periplasm)
ADK1 Nucleotide Salvage Pathway adenylate kinase
PTAr Pyruvate Metabolism phosphotransacetylase
ACKr Pyruvate Metabolism acetate kinase
ACS Pyruvate Metabolism acetyl-CoA synthetase
SERt2rpp Transport L-serine reversible transport via proton symport (periplasm)
SERt4pp Transport L-serine via sodium symport (periplasm)
GLCtex Transport glucose transport via diffusion (extracellular to periplasm) PRPPS Histidine Metabolism phosphoribosylpyrophosphate synthetase
PPM Alternate Carbon Metabolism phosphopentomutase
R15BPK Alternate Carbon Metabolism Ribose-1,5 bisphosphokinase R1PK Alternate Carbon Metabolism ribose 1-phosphokinase
GLCtexi Transport D-glucose transport via diffusion (extracellular to periplasm) irreversible ADNt2pp Transport adenosine transport in via proton symport (periplasm)
ADNt2rpp Transport adenosine transport in via proton symport reversible (periplasm) ASPt2pp Transport L-aspartate transport in via proton symport (periplasm) ASPt2rpp Transport L-aspartate transport in via proton symport (periplasm) reversible INDOLEt2pp Transport Indole transport via proton symport irreversible (periplasm) INDOLEt2rpp Transport Indole transport via proton symport reversible (periplasm) FBA Glycolysis/Gluconeogenesis fructose-bisphosphate aldolase
PFK Glycolysis/Gluconeogenesis phosphofructokinase
ICHORS Cofactor and Prosthetic Group Biosynthesis isochorismate synthase ICHORSi Cofactor and Prosthetic Group Biosynthesis Isochorismate Synthase HPYRI Alternate Carbon Metabolism hydroxypyruvate isomerase HPYRRx Alternate Carbon Metabolism Hydroxypyruvate reductase (NADH) TRSARr Alternate Carbon Metabolism tartronate semialdehyde reductase
CYTDt2pp Transport cytidine transport in via proton symport (periplasm) CYTDt2rpp Transport cytidine transport in via proton symport reversible (periplasm)
rather than to the phylogenesis of the species compos-ing a specific microbiota.
Integrating a robust assembler for metatranscrip-tomic data and expanding its informative potential with the integration of a metabolic model network could be an improved tool to characterize actively transcribed genes in a microbial community and to predict their metabolic output.
Abbreviations
FPA:False Positive class A; FPB: False Positive class B; HMY: High Methane Yield; KEGG: Kyoto Encyclopedia of Genes and GenomesLMYLow Methane Yield; NGS: Next Generation Sequencing; RNA-seq: RNA sequencing; SRA: Sequence Read Archive
Funding
Research and publication costs has been supported by University of Piemonte Orientale through local research and visiting funding program.
Availability of data and materials
Software and datasets used for benchmark are available upon request. About this supplement
This article has been published as part of BMC Bioinformatics Volume 19 Supplement 7, 2018: 12th and 13th International Meeting on Computational Intelligence Methods for Bioinformatics and Biostatistics (CIBB 2015/16). The full contents of the supplement are available online athttps:// bmcbioinformatics.biomedcentral.com/articles/supplements/volume-19-supplement-7.
Authors’ contributions
GM and IS wrote the algorithm for transcripts reconstruction. MC added metabolic pathways analysis to STAble. FF performed integration and validation tests. Interpretation of biological data was carried out by ML and EB. FM and PL conceived the work. All authors contributed to the writing. All authors read and approved the final manuscript.
Ethics approval and consent to participate Not applicable
Competing interests
The authors declare that they have no competing interests.
Publisher’s Note
Springer Nature remains neutral with regard to jurisdictional claims in published maps and institutional affiliations.
Author details
1Dipartimento di Scienze e Innovazione Tecnologica, Università degli Studi
del Piemonte Orientale, 15121 Alessandria, Italy.2Computer Laboratory,
University of Cambridge, Cambridge CB2 1TN, UK.3Dipartimento di Scienze della Salute, Università degli Studi del Piemonte Orientale, 28100 Novara, Italy.4AO SS Antonio e Biagio e Cesare Arrigo, 15121 Alessandria, Italy. 5Istituto di Informatica e Telematica, CNR, 56124 Pisa, Italy.6Dipartimento di
Biotecnologie e Scienze per la Salute, Università di Torino, 10124 Torino, Italy.
Published: 9 July 2018 References
1. Zhang J, Chiodini R, Badr A, Zhang G. The impact of next-generation sequencing on genomics. J Genet Genomics. 2011;38:95–109. 2. Wang Z, Gerstein M, Snyder M. RNA-Seq: a revolutionary tool for
transcriptomics. Nat Rev Genet. 2010;10(Suppl 1):57–63.
3. Chang Z, Li G, Liu J, Zhang Y, Ashby C, Liu D, Cramer CL, Huang X. Bridger: a new framework for de novo transcriptome assembly using RNA-seq data. Genome Biol. 2015;16:30.
4. Schulz MH, Zerbino DR, Vingron M, Birney E. Oases: robust de novo RNA-seq assembly across the dynamic range of expression levels. Bioinformatics. 2012;28:1086–92.
5. Grabherr MG, Haas BJ, Yassour M, Levin JZ, Thompson DA, Amit I, Adiconis X, Fan L, Raychowdhury R, Zeng Q, Chen Z, Mauceli E, Hacohen N, Gnirke A, Rhind N, Di Palma F, Birren BW, Nusbaum C, Lindblad-Toh K, Friedman N, Regev A. Full-length transcriptome assembly from RNA-Seq data without a reference genome. Nat Biotechnol. 2011;29:644–52.
6. Edgar RC. Search and clustering orders of magnitude faster than BLAST. Bioinformatics. 2010;26(19):2460–1.
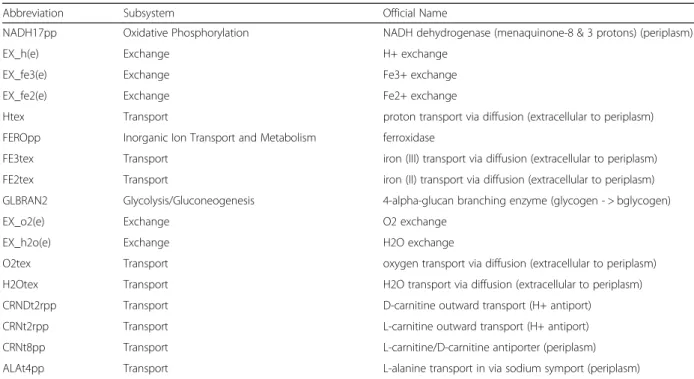
Table 4 List of all bacterial metabolic reactions identified in low methane yield animals (Continued)
Abbreviation Subsystem Official Name
NADH17pp Oxidative Phosphorylation NADH dehydrogenase (menaquinone-8 & 3 protons) (periplasm)
EX_h(e) Exchange H+ exchange
EX_fe3(e) Exchange Fe3+ exchange
EX_fe2(e) Exchange Fe2+ exchange
Htex Transport proton transport via diffusion (extracellular to periplasm) FEROpp Inorganic Ion Transport and Metabolism ferroxidase
FE3tex Transport iron (III) transport via diffusion (extracellular to periplasm) FE2tex Transport iron (II) transport via diffusion (extracellular to periplasm) GLBRAN2 Glycolysis/Gluconeogenesis 4-alpha-glucan branching enzyme (glycogen - > bglycogen)
EX_o2(e) Exchange O2 exchange
EX_h2o(e) Exchange H2O exchange
O2tex Transport oxygen transport via diffusion (extracellular to periplasm) H2Otex Transport H2O transport via diffusion (extracellular to periplasm) CRNDt2rpp Transport D-carnitine outward transport (H+ antiport)
CRNt2rpp Transport L-carnitine outward transport (H+ antiport) CRNt8pp Transport L-carnitine/D-carnitine antiporter (periplasm) ALAt4pp Transport L-alanine transport in via sodium symport (periplasm)
7. Huang W, Li L, Myers JR, Marth GT. ART: a next-generation sequencing read simulator. Bioinformatics. 2012;28(Suppl 4):593–4.
8. Wu TD, Watanabe CK. GMAP: a genomic mapping and alignment program for mRNA and EST sequences. Bioinformatics. 2005;21(9):1859–75. 9. Kamke J, Kittelmann S, Soni P, Li Y, Tavendale M, Ganesh S, Janssen PH, Shi
W, Froula J, Rubin EM, Attwood GT. Rumen metagenome and
metatranscriptome analyses of low methane yield sheep reveals a Sharpea-enriched microbiome characterised bylactic acid formation and utilisation. Microbiome. 2016;4(Suppl 1):56.
10. Sequence Read Achive. 2010.http://www.ncbi.nlm.nih.gov/sra. Accessed 5 Jan 2017.
11. Kanehisa M, Furumichi M, Tanabe M, Sato Y, Morishima K. KEGG: new perspectives on genomes, pathways, diseases and drugs. Nucleic Acids Res. 2017;45(Suppl D1):D353–61.
12. Conway M, Angione C, Liò P. Iterative multi level calibration of metabolic networks. Curr Bioinforma. 2016;11(Suppl 1):93–105.
13. Hinsu AT, Parmar NR, Nathani NM, Pandit RJ, Patel AB, Patel AK, Joshi CG. Functional gene profiling through metaRNAseq approach reveals diet-dependent variation in rumen microbiota of buffalo (Bubalus bubalis). Anaerobe. 2017;44:106–16.