Dipartimento di Statistica, Informatica, Applicazioni ‘G. Parenti’, Universit`a di Firenze, Firenze, Italia.
Alessandro Zeli
ISTAT, Servizio Studi econometrici e previsioni economiche, Roma, Italia.
1. Introduction
Labor productivity is commonly considered one of the engines of firms’ perfor-mance and competitiveness and ultimately a key aspect of a country’s growth; for this reason, it has been widely analyzed across time, sectors and countries but the way to increase it and stimulate firms’ performance is still an open question in the economic literature. Countries specificities and characteristics as well as firms internationalization modes, among other reasons, may create a fertile context for labor productivity growth (Kleinknecht and Mohnen, 2002). However, there are some countries that structurally differ from the others: in Italy, for instance, labor productivity has shown a strong and long slowdown and the Italian firms started lacking behind in international markets competition much before the recent crisis hit the global economy. The decrease of labor productivity in the country goes back to industrial policies lack in the long run, as well as structural weakness of the economic system (small firms size, low technology sectors predominance, etc.). However, several studies on sectors identify the presence of niches at a sector level that have, on the contrary, good levels of productivity and performance (“made in Italy” sectors or tourism, for example).
This paper analyzes the heterogeneous performance of Italian firms labor pro-ductivity over the recent years (before the crisis) and investigates how some firms’ characteristics may have affected the negative trend of the Italian firms labor pro-ductivity (1998-2007). The pre-global crisis period we consider in this paper was a good moment for the Italian economy; we decided to focus on this to describe
the reasons behind the last, lost opportunity for the Italian economy to stimulate firms’ competiveness and country’s growth. We compare manufacturing and ser-vices, with a specific focus on some Italian service sectors (restaurants and hotels, trade distributors, trade shops and legal and accountants). To this aim, we use an original panel recently developed by the Italian National Institute of Statistics at a micro level (firm level) and estimate a non linear production functions in a longitu-dinal quantile regression approach. We test how a set of firms’ characteristics may influence the poor performance of Italian firms labor productivity growth in the period considered, comparing manufacturing and service sectors. We then present results at a sector level for some sectors that are highly represented in the Italian economy, to stress their similarities and differences. The original database and the quantile regression approach allow us to highlight that labor productivity is very heterogeneous across the sectors and time and that the relationships between labor productivity and firms’ characteristics (like innovation, investments, inter-nationalization mode) do not uniformly hold across quantiles. We disentangle the effect of a set of variables on different levels of labor productivity, showing that, what is relevant for highly productive firms may not work for low productive firms and that the same holds for manufacturing versus service sectors. Results on the whole sample show that innovativeness and human capital have a strong impact on fostering low productive firms labor productivity. In general, we find evidence of a strong positive relationship between labor productivity growth and firms in-ternationalization, investments in intangible assets and innovation. Results at a sector level report a more heterogeneous situation and in particular show how the internationalization is less relevant in some service sectors, while investments in both physical capital and R&D are still important, especially for highly productive firms.
The paper is structured as follows. In Section 2 we briefly discuss the literature on labor productivity, in Section 3 we present the original database by the Italian National Institute of Statistics, in Section 4 we summarize the statistical features of the model. Section 5 discusses results on the whole sample and selected sectors and Section 6 concludes.
2. The literature on labor productivity: an overview
Productivity is generally defined as the measure of output from a production process, per unit of input. Despite this simple definition, the debate about inputs and outputs and how to combine them, i.e. the debate on different measures of productivity, has grown dramatically in recent years. Of course, different types of input measures give rise to different productivity measures. For example, labor productivity measures involve dividing total output by some measure that reflects the amount of labor used during the production process. The total number of work hours is a possible input, although several studies use the total number of workers employed but the relative index changes accordingly. Concerning on the measure of output, value added as well as revenues or sales are often used (Mayer et al., 2014). OECD (2001) and Coelli et al. (1998) report four different approaches that can be used to derive productivity measures: the growth accounting approach,
observed at that level (see, for instance, labor productivity or firms performance heterogeneity whitin sectors). Several country-specific cases focused on the way recessions, changes in labor legislation, decentralization of wage bargaining and increase in labor relations flexibility have affected countries labor productivity growth in recent years. In this line, a growing strand of the empirical literature discusses whether these factors have helped or hurt wage growth and employment growth (Hall et al., 2009) but doesn’t offer a unique interpretation to the main question.
Concerning Italy, a large number of empirical papers agree on the existence of a prolonged and deep slowdown in labor productivity that started much before the recent crisis hit the country (Grassini and Marliani, 2009; Ferrante and Freo, 2012; Milana and Zeli, 2004; Onida, 2002). However, there’s no agreement on the reasons behind this phenomenon, only a tough debate on the fact that the Italian specialization in low-tech, traditional sectors with low levels of investments in research and development activities (R&D) and intangible capital somehow may have favored the downturn trend in the labor productivity and economic growth of the country. On the contrary, R&D activities, especially in high-tech sectors, large firms’ size, along with investment in equipment, seem to enhance the likelihood of having both process and product innovations2. Both these kinds of innovation have
a positive impact on firm’s productivity, especially process innovation (Griffith et al., 2004). Indeed, R&D and innovation influence indirectly productivity via change in employment, growth of productivity and labor skills required by firms. For instance, Evangelista and Savona (2003) used a sample of around 1,000 Italian firms for services industries; they show that the impact of innovation and R&D on employment in services is difficult to highlight because there are both positive and negative effects due to the demand of innovative services increase or less labor intensive processes required. They also focus on specific sectors performance to detect industry production displaces due to innovation. Evangelista and Savona (2003) find a general negative effect of innovation activities for services and skill-specific effects (only for high skilled employment they find positive effects while the general effects are negative).
Another very interesting strand of literature suggests that internationalization of firms plays a role in increasing the labor productivity and firms’ performance in
2
On this see for instance Griliches (1998), Pianta and Vaona (2007) and Frantzen (2003).
a country (Griffith et al., 2004; Arnold and Hussinger, 2005; Fryges and Wagner, 2008; Hansen, 2010). In particular, this literature highlights how firms involved in international activities through export or foreign direct investments are “dif-ferent” from purely domestic firms in several respect (productivity, wages, skill intensity, see for all Mayer and Ottaviano (2008)). Following this perspective, there are relatively few firms ‘fit’ to compete in international markets and these firms are more productive, pay higher wages, employ more skilled workers, invest more in R&D. Melitz (2003), for instance, shows that there is a clear ranking between firms with different involvement in international markets: exporters are more productive than domestic firms, foreign investors more productive than ex-porters. In this line of research, a deep analysis on EU countries manufacturing firm level data (Altomonte et al., 2013) stressed the role played by interrelations among different modes of internationalization, innovation and firms productivity. In particular, modes of internationalization are used to test the impact on in-novation and productivity. The paper shows that the mix of R&D and imports is one of main channels to stimulate investments in technology and to produce more competitive products. The analysis shows a direct relationship among size, internationalization and innovation, where internationalization is the leading char-acteristics to stimulate productivity, among the three. The relationship between internationalization degree and innovation degree is shown at firm level but it holds also at country/sector level and for Italy the relationships is positive and significant (Altomonte et al., 2013). Also in this case, economic sectors represent an important factor in analyzing the internationalization/innovation patterns3. Finally, concerning directly Italian performance, several authors focus and agree on the behavior of Italian productivity during the recent years: they find mixed evidence and show that it is widely jeopardized across sectors, levels of technol-ogy and internationalization mode (Castellani and Giovannetti, 2010; Zeli and Mariani, 2009; Dosi et al., 2010).
3. The ISTAT Panel
During the last decade, the interest of statisticians and applied economists has moved from macro to micro data, focusing on firms level data and a flourishing number of longitudinal databases at a firm level has been developed by several institutions (see, for instance, AIDA and AMADEUS by Bureau Van Dijk or the Survey on Entrepreneurship by Eurostat). In the last few years, also the Italian National Institute of Statistics (ISTAT) has promoted large efforts to build affordable longitudinal data on the Italian business activity. Longitudinal data may be treated in different ways. One of the most common approach is to consider longitudinal data as a repeated cross section by ignoring the information about
3The authors state that “larger and more productive firms exhibit both higher inter-nationalization intensity and higher innovation intensity. In the cross-section, we also find that in more innovative country sector pairs (which we call ‘milieus’) there are more internationalized firms and in more internationalized ‘milieus’ firms are more likely to innovate” (Altomonte et al., 2013, pp.3).
some point in time in the past (in this case, 1998), then the units of analysis are added year by year. The catch-up panel is a particularly attractive design when we manage to isolate a source of baseline archival data which is especially rich in information (Frees, 2004).
The panel is mainly based on cross-sectional surveys’ microdata (firm-level) with the integration of administrative sources to ensure the matching of units over time and cover possible non-respondents. The cross-section enterprises’ surveys that characterize the panel show a widespread overlap time by time and represent a relevant longitudinal component. Four different sources are included. The first source is the Istat Business Register of Italian firms, the second is the so-called SCI survey, focusing on all firms with more than 100 employees, the third one is the so-called PMI survey that includes firms with 20-100 employees and the last one is the annual report of incorporated firms collected by the Central Balance-Sheet Data Office of Italy. To avoid the risk of attrition and selection bias, the time span has been kept quite short.
The above mentioned surveys collect information regarding employment, labor costs, investments, and regional location (ISTAT, 2007). The total population of Italian enterprises with at least 20 employees counted around 70,000 units in 1998 and more than 82,000 units in 2007 (Table 1). The enterprises with at least 20 employees represent only 2 per cent of the total population, but they represent a share of 40 per cent in terms of employment and 56 per cent in terms of value added.
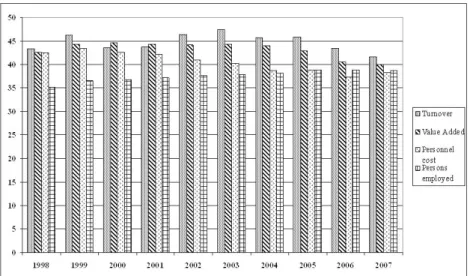
In Figure 1 we report the distribution of panel firms by economic activity. Table 2 shows the number of firms and workers in the panel database compared to the total population. Note that the firms selection criteria brought to a final panel size which includes the 79,4% of the starting firms and to the 83,1% of the workers. The attrition of the persistence criterion was very small (from 81,9 to 79,4) of the starting database firms and from 83,5% to the 83,1% of the starting database employees.
In Table 3 we present the number of firms included in the panel by reference years. Considering the whole period it means that over 13,500 firms were analysed: around 11,500 firms were included in the panel and around 17,000 were considered because of the events transformation management.
In order to analyze the representativity of the panel with respect to the tar-get population we compared the distribution of some economic variables in the database and in the target population (Biffignandi and Zeli, 2010). These analyses
TABLE 1
Number of firms, workers and value added in Italy by size class – Year 1998-2007. Size class Firms Workers Value added Firms Workers Value added
(millions (percentage values) of euro) 1998 1998 1 - 19 3,835,354 8,439,142 212,948 98.2 60 43 20 or more 69,858 5,636,859 282,503 1.8 40 57 Total 3,905,212 14,076,001 495,450 100 100 100 2007 2007 1 - 19 4,319,252 10,017,916 318,327 98.1 58.8 44.1 20 or more 82,575 7,016,536 403,624 1.9 41.2 55.9 Total 4,401,827 17,034,452 721,951 100 100 100
Source: Italian SBS data warehouse
TABLE 2
Panel 1998-2007 firms number and workers.
Criterion Firms Workers % of the population
number number Firms Workers
Starting (Sci-Pmi respondents) 17,097 3,902,001 24.2 67
of which: respondents 12,316 2,520,398
recovered (100 persons 4,781 1,383,679 employed and over)
Continuity (Sci-Pmi and BIL) 13,994 3,256,794 19.8 55.9
Persistence 13,573 3,243,549 19.2 55.7
TABLE 3
Number of panel firms by year
Year
1998 1999 2000 2001 2002 2003 2004 2005 2006 2007
Firms included in panel
13,573 13,232 12,992 12,422 11,621 10,891 10,549 10,364 9,839 9,456
Firms not included in panel*
1,677 1,601 1,496 1,624 1,704 1,657 1,731 1,812 1,785 1,718
Total 15,250 14,833 14,488 14,046 13,325 12,548 12,280 12,176 11,624 11,174
Figure 1 – Distribution of panel firms by economic activity – Year 1998.
use rank correlation, Fligner-Policello test and representativity indicators and do not show statistical difference. The good panel representativity may be shown also by means of the coverage ratio (Figure 2) calculated on the basis of the subset of firms existing in all years (balanced panel)4.
Figure 2 – Coverage rates of the balanced panel for Turnover, Value Added, Personnel Cost and employees – Panel data.
4. The Model: A Quantile Regression Approach
The prediction from most regression models is a point estimate of the conditional mean of a response, given a set of predictors. However, the conditional mean mea-sures only the “center” of the conditional distribution of the response. A more complete summary of the conditional distribution is provided by its quantiles. Re-cent advances allow the development of regression models for predicting a given quantile of the conditional distribution, both parametrically and nonparametri-cally. The general approach is the quantile regression, but the methodology (of conditional quantile estimation) applies to any statistical model (Koenker, 2005; Koenker and Hallock, 2001). In linear regression, the regression coefficient rep-resents the change in the response variable given by a one unit change in the predictor variable associated with that coefficient. The quantile regression pa-rameter estimates the change in a specified quantile of the response variable pro-duced by a one unit change in the regressor. This allows discussing how some percentiles of the dependent variable may be more affected by certain predictors than other percentiles. This is reflected in the change of the regression coefficient’ magnitude. Standard errors and confidence intervals for the quantile regression coefficient estimates can be obtained with asymptotic and bootstrapping meth-ods. Both methods provide robust results (Koenker and Hallock, 2001), with the bootstrap method preferred as more practical (Hao and Naiman, 2007).
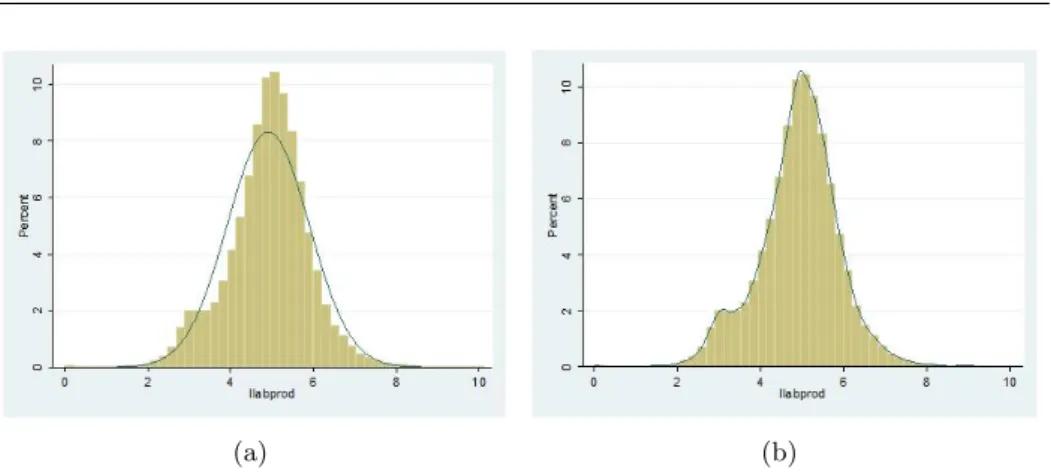
In this paper, we follow Canay (2011), suggesting that the estimation of lin-earized longitudinal models by quantile regression may be preferable to the usual regression methods for a number of reasons. First of all, we know that the stan-dard least-squares assumption of normally distributed errors does not hold for our database because productivity has not a Gaussian distribution (see Figure 3 below5).
Whilst the optimal properties of standard regression estimators are not robust to little departures from normality, quantile regression estimates are robust to outliers and heavy-tailed distributions. The quantile regression estimator βθ is invariant to outliers of the dependent variable that tend to infinity (Buchinsky, 1994). While OLS regressions focus on the mean, quantile regressions are able to describe the entire conditional distribution of the dependent variable. In the context of this study, high/low labor productivity firms over time are of interest and we wouldn’t dismiss them as outliers; on the contrary, we think it would be very interesting to study them in some detail. final This can be done by calculat-ing coefficient estimates at various quantiles of the labor productivity conditional distribution over time. Finally, a quantile regression approach avoids the restric-tive assumption that the error terms are identically distributed at all points of the conditional distribution. Relaxing this assumption allows us to acknowledge firms’ heterogeneity and consider the possibility that estimated slope parameters
5Labor productivity is calculated as sales per worker, in this paper, since we aim at capturing both a productivity and performance effect that may magnifies the heterogene-ity in Italian firms. In the economic literature this measure of productivheterogene-ity is widely used also in a comparative perspective across sectors (see for instance OECD, 2005; Crespi and Zuniga, 2012; Mayer et al., 2014).
(a) (b)
Figure 3 – Histogram and Normal Density Plot (Panel a) and Kernel Density Plot (Panel b) of Labor Productivity (in logs).
vary at different quantiles of the conditional distribution.
In a longitudinal context, GLS estimates have low efficiency in case of highly skewed data because these models use the mean as the measure of centrality. But what is more important in a practical situation is that it is more difficult to in-terpret what the mean measures when the data is skewed. In contrast to this, the quantiles, besides having higher efficiency than the mean for skewed data (Koenker and Bassett, 1978), always has an easy interpretation. Since labor productivity turns out to be a clearly skewed phenomenon and we do not know the distribu-tion of the underlying populadistribu-tion the quantile approach seems to be preferable, especially in a longitudinal context. The longitudinal quantile regression model, generalizing Koenker and Bassett (1978) seminal paper, can be written as
yit= x ′ itβθ+ uθit with Quantθ(yit|xit) = x ′ itβθ
where y is the dependent variable, x is a vector of regressors, β is the vector of parameters to be estimated, and u is a vector of residuals. Quantθ(yit|xit) denotes the θ-th conditional quantile of y given x. The θ-th regression quantile, 0 < θ < 1, solves the following problem:
min β 1 n ∑ i,t: yit>x ′ itβ θ|yit− x ′ itβ| + ∑ i,t: yit<x ′ itβ (1− θ)|yit− x ′ itβ| = minβ 1 n n ∑ i=1 ρθuθit
Where ρθ(·), which is known as the ‘check function’, is defined as
ρθ(uθit) = {
θuθit if uθit≥ 0 (1− θ)uθit if uθit< 0
which is then solved by linear programming methods. As θ increases from 0 to 1, we can trace the entire conditional distribution of y, conditional on x (Buchinsky, 1998). More on quantile regression techniques can be found in the surveys by Buchinsky (1998) and Koenker and Hallock (2001) while a set of sufficient con-ditions that identify a panel quantile regression model with fixed effects can be found in Canay (2011).
As outlined above, we consider four wide firms’ factors influencing productivity: investment, labor skills, innovation and internationalization. Given the complexity of interaction of these factors on labor productivity and among them and in order to avoid as possible endogeneity problems many variables are lagged (one period). As most of the literature assume, we estimate the following non linear Cobb-Douglas production function in a reduced form (in logs):
log(labprodit) = α + β1log(kit−1) + β2(ratio wtobit−1) + β3(ratio wtobit−1)2+ +β4log(inv rdit−1) + β5log(patentsit−1) + β6log(imp euit)+ +β7log(imp extraeuit) + β8log(exp euit) + β9log(exp extraeuit)+ +δt+ γs+ ϵit
Where labprod is the proxy for labor productivity (sales per worker for each firm i at time t), k is the level of physical capital invested per worker by firm i at time t− 1, ratio wtob is a proxy for the human capital investment of firm i at time t− 1 (the ratio of white to blue collars). Then we add two proxies for investments in intangible capital: inv rd are the expenditures in research and development activities of firm i at time t− 1 and patents that are the number of patents registered by firm i at time t− 1. We also include a set of predetermined variables that control for the internationalization mode of firm i at time t: imp eu and exp eu are the share of sales imported and exported (respectively) from/to European countries while imp extraeu and exp extraeu are the share of sales imported and exported (respectively) from/to countries outside Europe. This is a rough measure of long versus short distance trade relevance for Italian firms. We also control for common macroeconomic shocks by including year and sector dummies (δtand γs).
5. The Results
5.1. Descriptive Statistics
Table 4 reports descriptive statistics for selected variables in manufacturing and services6. The pre-global crisis period considered was a good moment for the
Ital-ian economy; we decided to focus on this to describe, if possible, the ItalItal-ian “last, lost opportunity”, in terms of productivity. During the period considered (1998-2007), indeed, the Italian economy has experienced a stagnation in the average labor productivity a slight increase in investments in physical capital, as well as
6
We report descriptive statistics for the whole period (1998-2007). Statistics on each year are available upon request.
what happened later. Focusing on our data, the innovativeness proxy (patents registered per year) seems to be quite homogeneous across manufacturing and service sectors7.
5.2. Results in a comparative perspective: Services versus Manufacturing In this section, we run, first, a panel model (GLS, fixed effects) on manufacturing and service sectors in a comparative perspective, where the dependent variable (log of labor productivity) is regressed on a set of covariates, including a non linear term for human capital (proxied by the ratio of white to blue collars). Second, we highlight the bias in GLS estimates by running the same model (including the non linear effect of human capital) using quantile regressions for panel data (Canay, 2011).
In Table 5, we report the results from panel regressions with fixed effects (time and sectors) both in linear and non linear specifications (for the human capital component) for manufacturing versus service sectors.
Results show that physical and human capital are particularly relevant in man-ufacturing. The human capital in manufacturing has a non linear effect, showing a peak (maximum): on average the labor productivity grows until the ratio of white collars reaches 75% of blue collars, then as the ratio blue to white collar keeps increasing the returns on the labor productivity turns out to be negative. Invest-ments in R&D internationalization and patents are also extremely important in manufacturing8. This first round of results point out some general characteristics
of Italian firms and suggest a clear way to stimulate the Italian labor produc-tivity. Focusing on sectors analyses, it’s clear that these models are not able to
7
From additional results on internationalized firms not reported here for space reasons, we see a slightly higher average level of innovativeness and expenditure in R&D (results on this sub-groups are available upon request).
8
We run also several models on subsets, in particular on exporting versus non exporting firms. We noticed that, while the effect of physical capital invested is lower than for manufacturing firms as a whole, the role of human capital and investment in R&D as well as innovativeness increases. We decided not to include these and other results for space reasons and also because exporting varies very much between manufacturing and services, so their comparison would have been not clear. These results, however, are available from authors upon request.
TABLE 4
Descriptive Statistics for Manufacturing and Services (1998-2007)
Manufacturing
Variable Obs Mean Std. Dev.
Productivity labprod 30120 132.95 2.18
Capital k 29417 2298.47 6.82
Ratio white to blue collars ratio wtob 29772 2.96 7.68
Patents patents 9994 25.28 6.82
Import extra EU imp extraeu 15495 167.34 16.95
Import EU imp eu 20435 492.75 17.64
Export extra EU exp extraeu 20838 962.95 13.6
Export EU exp eu 22637 1326.1 12.06
Services
Variable Obs Mean Std. Dev.
Productivity labprod 21924 48.42 3.86
Capital k 21175 706.27 9.49
Ratio white to blue collars ratio wtob 18377 2.11 8.76
Patents patents 4532 22.42 12.94
Import extra EU imp extraeu 4531 190.57 20.29
Import EU imp eu 7052 165.67 19.89
Export extra EU exp extraeu 5275 395.44 10.91
Export EU exp eu 6004 459.44 16.12
Note: labprod: labor productivity, k: physical capital, ratio wtob: ratio white to blue collars, patents: number of patents registered, imp extraeu: import from extra EU countries, exp extraeu: export to extra EU countries, exp eu: export to EU countries.
and 7 use a longitudinal quantile regression approach to disentangle the role of the same firms’ characteristics on different quantiles and comparing manufacturing and services.
The results show that physical and human capital investments are extremely important, especially for lower productive firms. The same can be said for invest-ment in R&D and patents: their influence on labor productivity is crucial for low productive firms and they should invest on it to improve their role in the market. According to a vast literature on this (Mayer and Ottaviano, 2008; Velucchi and Viviani, 2011), our results suggest to invest in human capital (non linear effect, as already stressed in the general GLS results) and innovation to foster labor produc-tivity. Also the degree of internationalization plays a role and stimulate especially low productive firms (Powell and Wagner, 2014).
As expected, results from Table 7, show that service firms show a different picture. While investments in both physical and human capital are relevant (more for highly productive firms), the number of patents registered is less important (maybe because innovation in services is declined in a different way).
We can note that the employment mix (white collar to blue collar ratio) is significant both in the linear and non linear component. For linear component we obtain, unlike manufacturing, a negative parameter while non linear presents a positive one. It implies that for services the increasing of labor skill takes more time to have a positive impact on productivity, given also the relative small coefficient of the non linear component. Also, the rising of productivity may vary a lot after the achievement of the breakeven point, given the positive sign of second derivative. However, notice that the magnitude of this parameter is similar across quantiles.
The degree of internationalization for export/import from long distance is not relevant while for import by EU countries, like in the general model, the model estimation yields significant and positive parameter across quantiles, although it is more important for more productive firms. Since there is a positive correlation between firms size and labor productivity, the larger the firms size the higher the propensity to import.
5.3. A focus on selected service sectors
This section focuses on specific service sectors that best represent the Italian econ-omy. We are aware that the model proposed is more suitable to describe the labor
TABLE 5
Different Specifications’ GLS Estimates: Manufacturing (M1), Services (S1), Manufacturing non linear (M2), Services non linear (S2).
Linear Specification Non linear Specification
M1 S1 M2 S2
VARIABLES Llabprod Llabprod Llabprod Llabprod
Investments (logs, lagged) 0.021*** -0.053 0.013*** 0.03
(0.01) (0.02) (0.02) (0.04)
Ratio white to blue collars 0.036*** -0.012 0.01*** 0.009**
(lagged) (0.01) (0.03) (0.005) (0.005)
Ratio white to blue collars, -0.003** -6.45e-07
squared (lagged) (0.00003) (0.0005)
Investments in R&D 0.005 0.035 0.04 0.03
(logs, lagged) (0.005) (0.003) (0.002) (0.01)
Number of patents registered 0.02*** 0.006 0.02*** 0.003
(logs, lagged) (0.005) (0.02) (0.006) (0.02)
Propensity to import from 0.01** 0.01 0.03** 0.02
extra-EU areas (logs, lagged) (0.005) (0.027) (0.006) (0.01) Propensity to import from 0.04*** 0.06*** 0.04*** 0.07*** EU areas (logs, lagged) (0.007) (0.03) (0.006) (0.02)
Propensity to export to 0.01*** 0.008 0.03*** 0.007
extra-EU areas (logs, lagged) (0.0001) (0.05) (0.004) (0.01)
Propensity to export to 0.04*** 0.01 0.03*** 0.02
EU areas (logs, lagged) (0.005) (0.07) (0.007) (0.01)
Constant 3.9*** 4.7*** 3.7*** 4.7***
(0.07) (0.31) (0.1) (0.3)
Fixed Effect YES YES YES YES
Note: Standard errors in parentheses *** p < 0.01, ** p < 0.05, * p < 0.1
Quantile Regression Results for Manufacturing
(1) (2) (3) (4) (5) (6) (7)
VARIABLES Llabprod Llabprod Llabprod Llabprod Llabprod Llabprod Llabprod
Quantiles 0.01 0.05 0.25 0.5 0.75 0.9 0.95
Investments (logs, 0.07*** 0.063*** 0.052*** 0.035 0.022 0.009 0.028***
lagged) (0.01) (0.02) (0.01) (0.01) (0.02) (0.02) (0.02)
Ratio white to blue 0.0501** 0.0302** 0.021*** 0.022*** 0.028*** 0.12*** 0.2***
collars (lagged) (0.04) (0.02) (0.008) (0.009) (0.008) (0.01) (0.01)
Ratio white to blue -0.001 -0.001 -0.001*** -0.0009*** -0.0004*** -0.002*** -0.002*** collars, squared (lagged) (0.0004) (0.0002) (0.0002) (0.0002) (0.0001) (0.0001) (0.0001) Investments in R&D 0.033** 0.022** 0.012*** 0.005 0.0124 0.0253* 0.0277 (logs, lagged) (0.067) (0.018) (0.006) (0.007) (0.006) (0.01) (0.02) Number of patents 0.0289** 0.0321** 0.031*** 0.028*** 0.025*** 0.038*** 0.0300* registered (logs, lagged) (0.07) (0.02) (0.007) (0.008) (0.009) (0.01) (0.02) Propensity to import 0.03 -0.02 0.0078 0.014* 0.005 -0.002 -0.005
from extra-EU areas (logs, lagged)
(0.04) (0.01) (0.006) (0.007) (0.009) (0.01) (0.02)
Propensity to import 0.06* 0.05** 0.04*** 0.08*** 0.11*** 0.09*** 0.09**
from EU areas (logs, lagged) (0.05) (0.03) (0.007) (0.02) (0.01) (0.02) (0.03) Propensity to export 0.22** 0.087*** 0.042*** 0.0456*** 0.031** 0.028* 0.0057* to extra-EU areas (logs, lagged) (0.05) (0.02) (0.003) (0.02) (0.01) (0.02) (0.06) Propensity to export 0.18*** 0.083*** 0.024*** 0.0013 0.002 0.002 0.024 to EU areas (logs, lagged) (0.04) (0.02) (0.008) (0.01) (0.01) (0.02) (0.03) Constant 1.56* 2.55*** 3.59*** 4.67*** 4.87*** 4.44*** 4.73*** (0.81) (0.27) (0.08) (0.15) (0.13) (0.17) (0.25)
Note: Quantile regressions identify the coefficients for firms at the z-th quantile of the productivity distribution. All regressions are panel regressions, SEs in brackets. Robust SEs were applied allowing for correlation within industries over time. SEs for quantile regressions are derived via bootstrap techniques for 1000 replications. Standard errors in parentheses. Significance levels: *** p¡0.01, ** p¡0.05, * p¡0.1
TABLE 7
Quantile Regression Results for Services
(1) (2) (3) (4) (5) (6) (7)
VARIABLES Llabprod Llabprod Llabprod Llabprod Llabprod Llabprod Llabprod
Quantiles 0.01 0.05 0.25 0.5 0.75 0.9 0.95
Investments (logs, 0.07*** 0.13 0.34*** 0.32*** 0.19*** 0.21** 0.67
lagged) (0.003) (0.13) (0.04) (0.04) (0.05) (0.09) (0.46)
Ratio white to blue -0.014*** -0.001** -0.002** -0.003** -0.003** -0.002** -0.051** collars (lagged) (0.0004) (0.0006) (0.0002) (0.0004) (0.0002) (0.0002) (0.0013) Ratio white to blue 2.56e-05*** 3.34e-05* 4.89e-05** 3.77e-05** 2.56e-05** 1.75e-05** 1.32e-05** collars, squared
(lagged)
(8.50e-07) (1.60e-05) (8.60e-06) (5.56e-06) (5.73e-06) (7.98e-06) (3.77e-06)
Investments in R&D 0.18*** 0.09 0.093*** 0.05** 0.03 0.21*** 0.23 (logs, lagged) (0.002) (0.12) (0.03) (0.02) (0.06) (0.06) (0.1) Number of patents -0.0021 -0.034 0.04 0.025 0.05*** 0.06** 0.09 registered (logs, lagged) (0.0024) (0.05) (0.03) (0.03) (0.03) (0.03) (0.15) Propensity to import -0.05*** -0.0207 0.03 0.04* 0.03 -0.003 0.002
from extra-EU areas (logs, lagged)
(0.001) (0.04) (0.02) (0.02) (0.06) (0.04) (0.16)
Propensity to import 0.06*** 0.05 0.07*** 0.18*** 0.17*** 0.16*** 0.13
from EU areas (logs, lagged) (0.001) (0.07) (0.02) (0.02) (0.03) (0.05) (0.22) Propensity to export 0.03*** -0.02 -0.03 0.02 0.004 0.03 -0.04 to extra-EU areas (logs, lagged) (0.002) (0.09) (0.03) (0.03) (0.04) (0.05) (0.2) Propensity to export 0.106*** 0.195** 0.043 -0.02 -0.039 -0.04 -0.0004 to EU areas (logs, lagged) (0.002) (0.09) (0.03) (0.03) (0.03) (0.05) (0.15) Constant 3.63*** 4.43*** 4.36*** 5.82*** 6.27*** 6.13*** 4.98*** (0.02) (0.81) (0.33) (0.34) (0.36) (0.45) (2.09)
Note: Quantile regressions identify the coefficients for firms at the z-th quantile of the productivity distribution. All regressions are panel regressions, SEs in brackets. Robust SEs were applied allowing for correlation within industries over time. SEs for quantile regressions are derived via bootstrap techniques for 1000 replications. Standard errors in parentheses. Significance levels: *** p¡0.01, ** p¡0.05, * p¡0.1
would like to analyze in-depth the trade sectors focusing on Trade distribution and Retail trade separately, looking for the relationships between international-ization and productivity detected with the general model. Hotels and Restaurants sector is interesting, instead, since they show a strong exposure to trade while for Legal and account is important to verify the determinants of productivity in a traditional managed service.
The results are straightforward and show how the model only partially capture their dynamics, since for almost all these sectors, internationalization proxies are not significant while investments both in physical capital and R&D are very impor-tant. For highly productive restaurants & hotels (likely 3-star Michelin and highly rated hotels) also patents registered are strongly significant: we may interpret this as a proxy of the quality offered (for examples, wineries/restaurants/luxury hotels and spa often register patents on new methods of production or new services of-fered). This is a specificity of these sectors, since the same proxy was not relevant in the whole service sample. We notice that some degree of internationalization exists for trade distributors and shops, showing a positive impact of both import and export from EU/extra EU countries. For trade distributors, for instance, import from EU is much more relevant for low productivity firms than for high productivity ones, suggesting that they rely much more on imported goods than high productivity companies.
Trade distribution show, as hypothesized above, a significant and positive re-lationship between imports from EU countries and productivity. It can be in-terpreted as an increasing degree of integration of large-scale retail trade with European retail trade10. It is important to notice the significant parameters for linear effect of employment mix across the quantiles (although relatively quite low) and the significant parameters of investment in R&D more relevant for more productive firms. It may be interpreted as strategic acquisition of brand and trademark to commercialize them on the internal market. We notice that some degree of internationalization exists, also, for trade distributors and shops,
show-9
Financial and insurance companies are not included in the panel, so we could not analyze their labour productivity. A focus on these sectors is left for future research.
10
In particular, the Italian large-scale retail trade was acquired in last few years by European counterparts and the European suppliers (through Trade distribution) are involved more and more massively on Italian markets. This is leading to increasing imports from EU countries and incrementing productivity via greater volume of sales.
TABLE 8
Quantile Regression Results for Restaurants&Hotels
(1) (2) (3) (4) (5) (6) (7)
VARIABLES Llabprod Llabprod Llabprod Llabprod Llabprod Llabprod Llabprod
Quantiles 0.01 0.05 0.25 0.5 0.75 0.9 0.95
Investments (logs, 0.245*** 0.169*** 0.0953*** 0.0849*** 0.0928*** 0.0818*** 0.0838***
lagged) (0.0607) (0.032) (0.011) (0.0126) (0.0203) (0.0169) (0.0216)
Ratio white to blue -0.027 -0.013 0.172 0.226 0.0942 0.0644 0.0398
collars (lagged) (0.515) (0.197) (0.128) (0.11) (0.0987) (0.114) (0.267)
Ratio white to blue 0.0023 0.0007 -0.0071 -0.0096 -0.0043 -0.0036 -0.0029
collars, squared (lagged) (0.0856) (0.008) (0.0349) (0.0326) (0.00472) (0.0293) (0.0248) Investments in R&D 0.0438** 0.0178** 0.0229*** 0.0137** 0.0181** 0.0091** 0.0349** (logs, lagged) (0.0816) (0.0305) (0.00835) (0.00586) (0.0133) (0.0118) (0.0174) Number of patents -0.103 -0.103 0.0038 0.032 0.0330** 0.0348*** 0.0503** registered (logs, lagged) (0.0713) (0.0765) (0.0166) (0.0228) (0.0249) (0.0216) (0.0243) Propensity to import 0.443** 0.0844 0.0346 0.0025 0.0196 -0.0278 -0.0403
from extra-EU areas (logs, lagged)
(0.205) (0.194) (0.0621) (0.0404) (0.0349) (0.0418) (0.0625)
Propensity to import -0.268** -0.0286 0.0024 0.0048 -0.0002 0.0125 0.0082
from EU areas (logs, lagged) (0.161) (0.0799) (0.0196) (0.0203) (0.015) (0.0289) (0.0429) Propensity to export -0.116 -0.0178 0.0049 0.0179 0.0348 0.0023 -0.009 to extra-EU areas (logs, lagged) (0.0764) (0.08) (0.0286) (0.022) (0.0283) (0.0259) (0.0225) Propensity to export 0.0985* -0.0171 -0.0117 -0.0223* -0.0270* -0.0246** -0.0265* to EU areas (logs, lagged) (0.0543) (0.0456) (0.0156) (0.0134) (0.0143) (0.0099) (0.0148) Constant 0.738 2.154*** 2.989*** 3.339*** 3.570*** 3.965*** 4.032*** (0.479) (0.285) (0.1) (0.0949) (0.137) (0.108) (0.158) Observations 762 762 762 762 762 762 762
Note: Quantile regressions identify the coefficients for firms at the z-th quantile of the productivity distribution. All regressions are panel regressions, SEs in brackets. Robust SEs were applied allowing for correlation within industries over time. SEs for quantile regressions are derived via bootstrap techniques for 1000 replications. Standard errors in parentheses. Significance levels: *** p¡0.01, ** p¡0.05, * p¡0.1
ing a positive impact of import from EU/extra EU countries both for low and high productive level firms. For the Trade shops, this confirms the importance of in-vestment and employment mix in increasing productivity. We notice that there is also a strong influence of investment in R&D for higher productive firms, probably due to the brand and trademark acquisitions that create a sort of monopolistic power for narrow market niches (when they exist). Legal and account sectors show a larger investment in R&D and propensity to import from EU countries for more productive quantiles and this shows a large influence of this variables on labor productivity for this sector.
6. Conclusions
This paper deals with the heterogeneous performance of Italian firms labor pro-ductivity and investigates how firms characteristics affect the dynamics of the Italian firms labor productivity in recent years (1998-2007). The pre-global crisis period considered was a good moment for the Italian economy: we focus on this to
Quantile Regression Results for Trade Distributors
(1) (2) (3) (4) (5) (6) (7)
VARIABLES Llabprod Llabprod Llabprod Llabprod Llabprod Llabprod Llabprod
Quantiles 0.01 0.05 0.25 0.5 0.75 0.9 0.95
Investments (logs, 0.0896*** 0.0896*** 0.140*** 0.172*** 0.252*** 0.297*** 0.332***
lagged) (0.0248) (0.0252) (0.0138) (0.0224) (0.0294) (0.0293) (0.026)
Ratio white to blue 0.00575*** 0.00575*** 0.000707*** 0.00395*** 0.00822*** 0.00934*** 0.0122*** collars (lagged) (0.0742) (0.0949) (0.0499) (0.0359) (0.0475) (0.0309) (0.0915) Ratio white to blue 1.30e-05 1.30e-05 -4.43e-08 -7.81e-06 -1.80e-05 -2.42e-05 -3.12e-05 collars, squared
(lagged)
(5.25e-05) (5.05e-05) (2.33e-05) (1.75e-05) (2.64e-05) (0.000168) (5.24e-05)
Investments in R&D 0.0234 0.0234 0.0219*** 0.0286*** 0.0380** 0.113*** 0.149*** (logs, lagged) (0.0305) (0.034) (0.00812) (0.00929) (0.0199) (0.0278) (0.0362) Number of patents -0.00133 -0.00133 0.0190* 0.0189* -0.000628 -0.0245 -0.0253 registered (logs, lagged) (0.0265) (0.0247) (0.0111) (0.0104) (0.0299) (0.0308) (0.0308) Propensity to import -0.0243* -0.0243 -0.00901 -0.000469 -0.00198 0.0530*** 0.0454*** from extra-EU areas
(logs, lagged)
(0.0133) (0.0182) (0.00792) (0.00532) (0.0134) (0.0193) (0.0123)
Propensity to import 0.109*** 0.109*** 0.0270*** 0.0240*** 0.0225** 0.0153** 0.0155** from EU areas (logs,
lagged) (0.0117) (0.0157) (0.00953) (0.00619) (0.0105) (0.0123) (0.0129) Propensity to export 0.000626 0.000626 0.0106 -0.00294 0.00466** 0.0354** 0.0207** to extra-EU areas (logs, lagged) (0.0145) (0.0169) (0.00904) (0.00852) (0.0126) (0.0186) (0.0151) Propensity to export -0.00329 -0.00329 -0.00519 0.00187 0.00795** 0.013** 0.0029** to EU areas (logs, lagged) (0.0156) (0.00984) (0.0074) (0.00849) (0.00804) (0.0202) (0.0115) Constant 3.678*** 3.678*** 4.222*** 4.311*** 4.147*** 4.280*** 4.253*** (0.129) (0.184) (0.116) (0.134 (0.18) (0.174 (0.18) Observations 1583 1583 1583 1583 1583 1583 1583
Note: Quantile regressions identify the coefficients for firms at the z-th quantile of the productivity distribution. All regressions are panel regressions, SEs in brackets. Robust SEs were applied allowing for correlation within industries over time. SEs for quantile regressions are derived via bootstrap techniques for 1000 replications. Standard errors in parentheses. Significance levels: *** p¡0.01, ** p¡0.05, * p¡0.1
TABLE 10
Quantile Regression Results for Trade Shops
(1) (2) (3) (4) (5) (6) (7) VARIABLES Llabprod Llabprod Llabprod Llabprod Llabprod Llabprod Llabprod
Quantiles 0.01 0.05 0.25 0.5 0.75 0.9 0.95
Investments (logs, 0.190*** 0.116*** 0.0656*** 0.0400** 0.00313*** 0.0604*** 0.0223*** lagged) (0.0383) (0.0143) (0.0134) (0.0183) (0.0194) (0.0186) (0.0215) Ratio white to blue 0.000449*** 0.00212*** 0.000509** 0.000588** 0.00105** 0.00092*** 0.00216*** collars (lagged) (0.0432) (0.0381) (0.0781) (0.052) (0.0783) (0.0535) (0.0542) Ratio white to blue 7.83e-07 2.05e-06 5.10e-07 4.31e-07 6.92e-07 3.87e-07 1.26e-06 collars, squared
(lagged)
(7.27e-06) (2.23e-05) (1.07e-06) (7.03e-07) (7.12e-07) (1.73e-06) (6.65e-06) Investments in R&D -0.0531 -0.0137 0.00888 0.0135 0.0309*** 0.0528** 0.0722*** (logs, lagged) (0.0351) (0.0215) (0.0103) (0.019) (0.00887) (0.023) (0.0232) Number of patents 0.0284 0.0315 0.0148 0.0297* 0.0522* 0.168* 0.230* registered (logs, lagged) (0.0264) (0.0118) (0.0103) (0.0148) (0.0216) (0.0726) (0.0309) Propensity to import 0.0188* 0.0232** -0.0107 0.0013 0.0163 0.0800*** 0.0325** from extra-EU areas
(logs, lagged)
(0.0588) (0.0102) (0.0118) (0.04) (0.0146) (0.0241) (0.024) Propensity to import 0.0189 0.0363*** 0.00567 0.00485 0.00511 0.0556*** -0.0149 from EU areas (logs,
lagged) (0.0334) (0.00913) (0.00618) (0.00726) (0.00826) (0.0101) (0.0208) Propensity to export 0.0256 0.0147 0.0129 0.00696 0.0116 0.0281* 0.0287 to extra-EU areas (logs, lagged) (0.0396) (0.0166) (0.01) (0.0259) (0.0113) (0.017) (0.019) Propensity to export -0.00139 -0.0124 -0.0191 0.000352 0.0260* -0.00626 0.0315 to EU areas (logs, lagged) (0.044) (0.0131) (0.0121) (0.0359) (0.0151) (0.0198) (0.026) Constant 2.748*** 3.606*** 4.421*** 4.846*** 5.369*** 6.150*** 5.914*** (0.295) (0.155) (0.0999) (0.234) (0.103) (0.142) (0.251) Observations 946 946 946 946 946 946 946 Note: Quantile regressions identify the coefficients for firms at the z-th quantile of the productivity distribution. All regressions are panel regressions, SEs in brackets. Robust SEs were applied allowing for correlation within industries over time. SEs for quantile regressions are derived via bootstrap techniques for 1000 replications. Standard errors in parentheses. Significance levels: *** p¡0.01, ** p¡0.05, * p¡0.1
Quantile Regression Results for Legal&Accountants
(1) (2) (3) (4) (5) (6) (7)
VARIABLES Llabprod Llabprod Llabprod Llabprod Llabprod Llabprod Llabprod
Quantiles 0.01 0.05 0.25 0.5 0.75 0.9 0.95
Investments (logs, 0.287*** 0.190*** 0.127*** 0.140*** 0.151*** 0.167*** 0.171***
lagged) (0.0944) (0.0296) (0.0113) (0.0116) (0.0138) (0.0231) (0.0165)
Ratio white to blue 0.016 0.0102 0.00874 0.0124 0.0178 0.0224 0.0113
collars (lagged) (0.0138) (0.00433) (0.00698) (0.00915) (0.00875) (0.011) (0.0124) Ratio white to blue -2.14e-05 -1.41e-05 -1.31e-05 -1.94e-05 -2.87e-05 -3.66e-05 -2.02e-05 collars, squared
(lagged)
(2.62e-05) (8.21e-06) (0.000106) (9.50e-05) (0.000111) (0.000127) (0.000126)
Investments in R&D -0.0256 -0.00314 0.0332*** 0.0845*** 0.0885*** 0.136*** 0.234*** (logs, lagged) (0.0926) (0.029) (0.0114) (0.0136) (0.0148) (0.0313) (0.0393) Number of patents -0.0336 -0.00272 -0.0276 0.0421 0.0496 0.126* 0.16 registered (logs, lagged) (0.147) (0.0461) (0.0216) (0.0406) (0.0347) (0.0732) (0.111) Propensity to import 0.138 0.00752 0.0623* 0.0339 0.0603 -0.0152 -0.0353
from extra-EU areas (logs, lagged)
(0.173) (0.0543) (0.0344) (0.0281) (0.0481) (0.036) (0.0686)
Propensity to import -0.061 0.038 0.150*** 0.144*** 0.147*** 0.151*** 0.114*** from EU areas (logs,
lagged) (0.142) (0.0445) (0.0269) (0.0387) (0.0308) (0.0303) (0.0326) Propensity to export 0.108 0.0803* 0.00158 0.00688 0.00886 0.00725 -0.0113 to extra-EU areas (logs, lagged) (0.145) (0.0454) (0.0265) (0.0321) (0.0332) (0.0371) (0.0486) Propensity to export -0.0954 -0.0131 0.0361 0.0759*** 0.0809* 0.100*** 0.0830* to EU areas (logs, lagged) (0.122) (0.0383) (0.0459) (0.019) (0.0429) (0.0272) (0.0491) Constant -0.0226 1.182*** 2.051*** 2.184*** 2.532*** 2.763*** 2.832*** (0.514) (0.161) (0.0411) (0.0698) (0.0545) (0.117) (0.082) Observations 1363 1363 1363 1363 1363 1363 1363
Note: Quantile regressions identify the coefficients for firms at the z-th quantile of the productivity distribution. All regressions are panel regressions, SEs in brackets. Robust SEs were applied allowing for correlation within industries over time. SEs for quantile regressions are derived via bootstrap techniques for 1000 replications. Standard errors in parentheses. Significance levels: *** p¡0.01, ** p¡0.05, * p¡0.1
describe the reasons behind the lost in competiveness and country’s growth. We use an original panel recently developed by the ISTAT at a micro level (firm level) including information from their balance sheets and internationalization activity. In particular, we use a non linear production function and a longitudinal quantile regression approach to test how a set of firms’ characteristics influences the Ital-ian firms labor productivity growth in the period considered. We run models on manufacturing and service sectors in a comparative perspective, with a focus on four service sectors, widely represented in the Italian economy.
We find that labor productivity is very heterogeneous across the economy and that the relationships between labor productivity and firms’ characteristics are not constant across quantiles. We disentangle the effect of a set of variables on different levels of labor productivity; we show that what is relevant for highly productive firms may not work for low productive firms. Using the longitudinal quantile regression approach we show that the mean regression estimates obtained via GLS do not fully capture the complex dynamics and heterogeneity of the Italian firms’ labor productivity. Innovativeness and human capital, in particular, have a larger impact on fostering labor productivity of low productive firms. Also, the internationalization is more important in fostering the labor productivity of lower productive firms, suggesting that low productive firms should expand their role in international markets to increase their productivity and that the expected effects are larger than for highly productive firms.
The analyses on specific services industries highlight the important role played by physical investment and R&D in increasing productivity, moreover some partic-ular features emerge for trade sectors. For these sectors there is a strong influence of employment skill mix on productivity, especially higher for higher quantiles. Other two important factors influencing productivity are captured (for Trade sec-tors) by investments in R&D and imports from EU countries. The first is probably due to brand commercialization while the second to an enlargement of the pur-chasing and selling markets to EU countries booster by euro introduction.
The paper results may also suggest some actions in terms of policy implications. It is clear, for instance, the importance of education and training in order to match the labor market requirements and the challenge of internationalization, moreover fiscal incentives should be subordinate to the realization of physical investments aimed at improving products and productive processes.
REFERENCES
C. Altomonte, T. Aquilante, G. B´ek´es, G. I. Ottaviano (2013). Inter-nationalization and innovation of firms: evidence and policy. Economic Policy, 28, no. 76, pp. 663–700.
J. M. Arnold, K. Hussinger (2005). Export Behavior and Firm Productivity in German Manufacturing: A Firm-Level Analysis. Review of World Economics, 141, no. 2, pp. 219–243.
S. Biffignandi, A. Zeli (2010). Integrating databases over time: what about representativeness in panel data? presented at Third International Workshop on
I. A. Canay (2011). A simple approach to quantile regression for panel data. The Econometrics Journal, 14, no. 3, pp. 368–386.
D. Castellani, G. Giovannetti (2010). Productivity and the international firm: dissecting heterogeneity. Journal of Economic Policy Reform, 13, no. 1, pp. 25–42.
T. Coelli, D. S. Prasada Rao, G. E. Battese (1998). An Introduction to Efficiency and Productivity Analysis. Kluwer Academic Publishers, Boston. G. Crespi, P. Zuniga (2012). Innovation and Productivity: Evidence from Six
Latin American Countries. World Development, 40, no. 2, pp. 273–290. G. Dosi, M. Grazzi, C. Tomasi, A. Zeli (2010). Turbulence underneath the
big calm? Exploring the micro-evidence behind the flat trend of manufacturing productivity in Italy. LEM Papers Series 2010/03, Laboratory of Economics and Management (LEM), Sant’Anna School of Advanced Studies, Pisa, Italy. R. Evangelista, M. Savona (2003). Innovation, employment and skills in
ser-vices. Firm and sectoral evidence. Structural Change and Economic Dynamics, 14, no. 4, pp. 449–474.
M. R. Ferrante, M. Freo (2012). The Total Factor Productivity Gap between Internationalised and Domestic Firms: Net Premium or Heterogeneity Effect? The World Economy, 35, no. 9, pp. 1186–1214.
D. Frantzen (2003). The Causality between R&D and Productivity in Manufac-turing: An international disaggregate panel data study. International Review of Applied Economics, 17, no. 2, pp. 125–146.
E. W. Frees (2004). Longitudinal and Panel Data: analysis and application in the social sciences. Cambridge University Press, Cambridge, UK.
H. Fryges, J. Wagner (2008). Exports and Productivity Growth: First Evidence from a Continuous Treatment Approach. Review of World Economics, 144, no. 4, pp. 695–722.
L. Grassini, G. Marliani (2009). Italian labour productivity changes : An analysis of firm survey data 1998-2004. In A. Viviani (ed.), Firms and system competitiveness in Italy, Firenze University Press, Firenze, pp. 39–56.
R. Griffith, S. Redding, J. van Reenen (2004). Mapping the Two Faces of R&D: Productivity Growth in a Panel of OECD Industries. The Review of Economics and Statistics, 86, no. 4, pp. 883–895.
Z. Griliches (1998). R&D and Productivity: The Econometric Evidence. Chicago University Press, Chicago.
B. Hall, F. Lotti, J. Mairesse (2009). Innovation and productivity in SMEs: empirical evidence for Italy. Small Business Economics, 33, no. 1, pp. 13–33. T. Hansen (2010). Exports and Productivity: An Empirical Analysis of
Ger-man and Austrian Firm-Level PerforGer-mance. Discussion papers in economics, University of Munich, Department of Economics.
L. Hao, D. Q. Naiman (2007). Quantile Regression. Sage Publications, Thousand Oaks.
ISTAT (2007). Conti economici delle imprese – Anno 2003. Collana Informazioni no. 8, ISTAT, Roma.
R. Koenker (2005). Quantile Regression. Cambridge University Press, New York.
R. Koenker, G. Bassett (1978). Regression Quantiles. Econometrica, 46, no. 1, pp. 33–50.
R. Koenker, K. F. Hallock (2001). Quantile Regression. Journal of Economic Perspectives, 15, no. 4, pp. 143–156.
T. Mayer, M. J. Melitz, G. I. P. Ottaviano (2014). Market Size, Competi-tion, and the Product Mix of Exporters. American Economic Review, 104, no. 2, pp. 495–536.
T. Mayer, G. Ottaviano (2008). The Happy Few: The Internationalisation of European Firms. Intereconomics: Review of European Economic Policy, 43, no. 3, pp. 135–148.
M. J. Melitz (2003). The Impact of Trade on Intra-Industry Reallocations and Aggregate Industry Productivity. Econometrica, 71, no. 6, pp. 1695–1725. C. Milana, A. Zeli (2004). Productivity slowdown and role of ICT in Italy: a
firm-level analysis. In The Economic Impact of ICT. Measurement, Evidence and Implications, OECD, Paris, chap. 12, pp. 261–277.
R. Nardecchia, R. Sanzo, A. Zeli (2010). La costruzione di un panel retro-spettivo di microdati per le imprese italiane con 20 addetti e oltre dal 1998 al 2004. Documenti no. 7, ISTAT, Roma.
OECD (2001). Measuring Productivity: OECD Manual – Measurement of Aggre-gate and Industry-Level Productivity Growth. OECD, Paris.
M. Velucchi, A. Viviani (2011). Determinants of the Italian labor productivity: a quantile regression approach. Statistica, 71, no. 2, pp. 213–238.
A. Zeli, P. Mariani (2009). Productivity and profitability analysis of large Italian companies: 1998-2002. International Review of Economics, 56, no. 2, pp. 175– 188.
Appendix A
The panel contains data from 1998 to 2007. The features of the panel are com-patible with the requirements of economic information: complete, consistent and comparable over time (Kessler and Greenberg, 1981). On this basis, the panel has drawn all links between answering firms in 1998 survey with 2007 survey respon-dents. Detailed criteria are defined in order to take business transformation into account. Balance-sheet data are integrated for the missing data but new firms, entering the market after 1998, are not included.
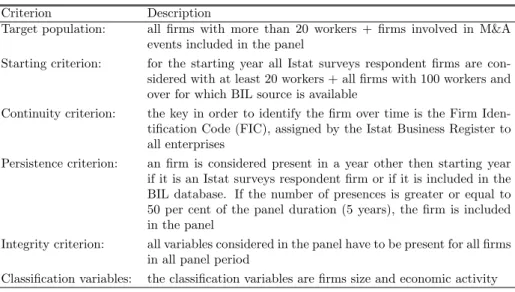
The panel is build according the rules presented in Table 12.
Some steps are carried out in order to match the above mentioned criteria. In particular, we performed the following analyses:
a) selection of a sub-universe of firms with at least 20 workers respondent to SCI-PMI surveys in the starting year (1998) with the addition of all firms with at least 100 workers even if non respondents;
b) integration with the BIL source of firms selected at point a); c) application of continuity criterion to firms selected at point b); d) application of persistence criterion to firms selected at point c).
Firms respondent in 1998 or firms present in BIL for at least 5 years (period 1998-2007) are included. Since M&A and non responses occurred in one or more waves may affect the representativeness of the panel and may increase panel attrition, a complex strategy of integration was carried out. All demographic events involving enterprises were considered and the longitudinal links between firms were pieced together.
All the relevant variables are measured in monetary values at current prices. Output volumes have been obtained by deflation using the indexes of producer
TABLE 12 Panel Building Criteria
Criterion Description
Target population: all firms with more than 20 workers + firms involved in M&A events included in the panel
Starting criterion: for the starting year all Istat surveys respondent firms are con-sidered with at least 20 workers + all firms with 100 workers and over for which BIL source is available
Continuity criterion: the key in order to identify the firm over time is the Firm Iden-tification Code (FIC), assigned by the Istat Business Register to all enterprises
Persistence criterion: an firm is considered present in a year other then starting year if it is an Istat surveys respondent firm or if it is included in the BIL database. If the number of presences is greater or equal to 50 per cent of the panel duration (5 years), the firm is included in the panel
Integrity criterion: all variables considered in the panel have to be present for all firms in all panel period
Classification variables: the classification variables are firms size and economic activity
prices at industry level. Capital values have been deflated by means of the price index for investment goods, whereas the variables related labour cost have been deflated by means of wage and salary indexes for each NACE category. The resulting volumes of outputs and inputs are expressed in monetary values in euro at constant prices prevailing during the year 2000.
The panel is linked with Trade, Innovation and R&D databases in order to make available exports, innovation and R&D variables. So, under this point of view, the panel is an “integrated” database too. Each firm is originally associated with an industry defined by the NACE rev.1.1 (ATECO 2002) classification, ac-cording to its main economic activity. The resulting database includes 25 sectors representing almost the whole entire national production, excluding the agricul-tural, financial and some other activities.
ACKNOWLEDGEMENTS
We would like to thank the editor of the journal and two anonymous referees that strongly improved the paper with their comments; we are also particularly indebted to Chiara Bocci for her invaluable help.
SUMMARY
Italian Manufacturing and Service Firms Labor Productivity: a Longitudinal Quantile Regression Analysis
Labor productivity is very complex to analyze across time, sectors and countries. In particular, in Italy, labor productivity has shown a prolonged slowdown but sector anal-yses highlight the presence of specific niches that have good levels of productivity and performance. This paper investigates how firms’ characteristics might have affected the
that heterogeneity is more intense at a sector level and we derive some common features that may be useful in terms of policy implications.
Keywords: intangible capital; internationalization; labor productivity; longitudinal quan-tile regression