POLITECNICO DI MILANO
Dipartimento di Elettronica, Informazione e Bioingegneria
Tesi di Laurea Magistrale in Ingegneria Biomedica
A novel computational workflow for the
biomechanical analysis of aortic
re-coarctation endovascular treatment
Relatore: Prof. Emiliano Votta
Correlatore: Dott. Alessandro Caimi
Autore: Matteo Pasquali
Matricola: 875864
i
Table of contents
Abstract ... iv
Clinical background ... iv
State of the art ... v
Materials & Methods ... vi
Results & Discussion ... ix
Conclusions ... xii
References ... xiii
Sommario ... xv
Contesto clinico ... xv
Stato dell’arte ... xvi
Materiali e metodi ... xvii
Risultati e discussione ... xx
Conclusioni ... xxiii
Bibliografia ... xxiv
1. Clinical background ... 1
1.1 The aorta ... 1
1.1.1 Anatomy of the aorta ... 1
1.1.2 Physiology of the aorta ... 3
1.1.3 Pulse wave velocity and aortic stiffness... 3
1.2 Coarctation of the aorta (CoA) ... 5
1.2.1 CoA classification ... 5
1.2.2 Pathophysiology of CoA... 6
1.2.3 Diagnosis of CoA ... 9
1.2.4 Treatment of CoA ... 10
1.2.5 The Cheatham-Platinum (CP) stent and the Balloon-in-Balloon (BIB) catheter ... 12
1.2.6 Short- and long-term outcomes after CoA treatment ... 14
2. State of the art & Aim of the thesis... 18
ii 2.2 Finite element simulations of CP stent expansion inside the right ventricular
outflow tract ... 20
2.3 Aim of the thesis ... 25
3. Materials & Methods ... 27
3.1 Workflow to simulate stent implantation inside the patient-specific FE model of a coarcted aorta ... 27
3.2 Geometries, meshes and mechanical properties ... 31
3.2.1 CP stent ... 31
3.2.2 BIB delivery system ... 33
3.2.3 Patient’s aorta ... 34
3.3 Pre-stress computation ... 38
3.4 The remeshing technique ... 40
3.4.1 The need for remeshing ... 40
3.4.2 Inadequacy of the remeshing techniques offered by Abaqus ... 42
3.4.3 The criterion to decide when remeshing is needed ... 43
3.4.4 The mesh-to-mesh mapping algorithm ... 43
3.5 Details about the simulations of stent’s expansion ... 45
3.5.1 Contacts ... 45
3.5.2 Loads ... 45
3.5.3 Boundary conditions ... 47
3.6 Postprocessing of results ... 49
3.6.1 Stent’s geometrical parameters ... 49
3.6.2 Stent’s stress ... 50
3.6.3 Contact perimeter between stent and aorta ... 53
3.6.4 Vessel’s stress ... 53
3.7 Cardiac cycle simulations ... 54
4. Results & Discussion ... 58
4.1 Benefit of the remeshing procedure ... 58
4.2 Stent’s results ... 61
4.2.1 Comparison between the stent’s discretization with solid and with beam elements. 61 4.2.2 Stent’s geometrical parameters ... 64
4.2.3 Stent’s stress ... 65
iii
4.3 Vessel’s results... 67
4.3.1 Vessel’s stress after stent’s recoil ... 67
4.3.2 Vessel’s stress over the cardiac cycle ... 71
5. Conclusions ... 78
5.1 Conclusions ... 78
5.2 Limitations and future work... 80
Appendix... 86
Computation of the maximum longitudinal stress at the cross-section of a circular beam element ... 86
iv
Abstract
Clinical background
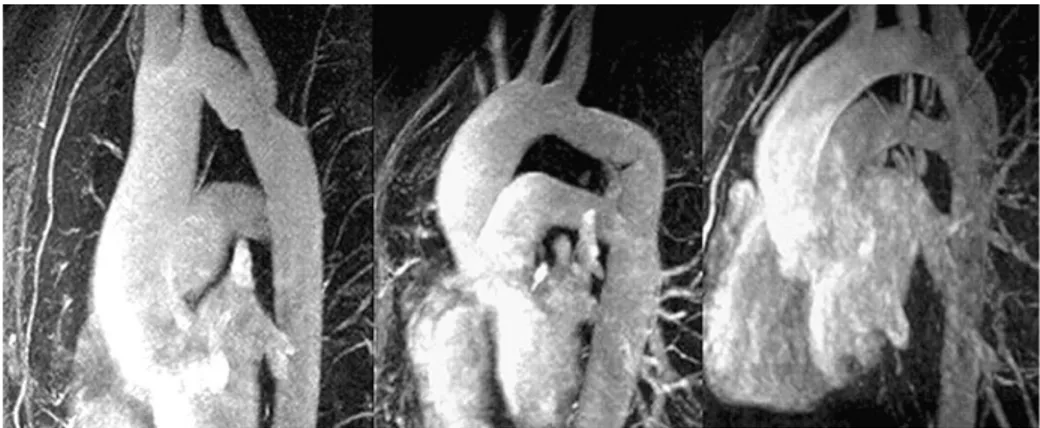
Coarctation of the aorta (CoA) is a localized stenosis in the proximal descending thoracic aorta and it is the 6th most common form of congenital heart defect [1]. In the long-term, it may lead to ventricular hypertrophy and to systemic hypertension in the upper body, which increase the risk of congestive heart failure and cerebral aneurysms, respectively [2]. CoA may be treated either via surgical repair (e.g., by excision of the coarcted segment) or via implantation of a stent to re-establish a vessel diameter at the CoA site comparable to the diameter just proximal and distal to the narrowing (Figure 1) [2]. The former treatment is usually preferred for newborns and children, while the latter is the choice of election for adult re-coarctation (i.e., restenosis after successful surgical intervention) [2].
Figure 1 Schematic drawings of the CoA site before (left) and after (right) the endovascular treatment.
Both treatments have excellent results in relieving the pressure gradient caused by CoA in the short term [3]. In the long term, however, there is a high recurrence of hypertension [4]. Among the alleged causes there are an abnormal aortic arch shape that persist even after the repair and increased central aortic stiffness [4]. The latter is induced by the fibrotic scar at the anastomotic site in case of surgery and by the high stiffness of the metal stent in case of endovascular treatment. It seems to imply the presence of an early reflection site for the
v pressure wave that leads to a great superimposition of the incident and reflected pressure waves and thus to central hypertension, even though the obstruction has been relieved [4].
State of the art
To the best of the author’s knowledge, in the scientific literature there are only two papers describing finite element (FE) simulations of stent implantation inside coarcted aortas. The first one is a work by Cosentino et al. [5], who however considered a case study that is quite uncommon in the clinical practice: a CoA patient who, 10 years after the implantation of a stent with a 14 mm diameter, showed recurrent obstruction and a small aneurysm in the proximal portion of the stent. The second one is a work by Burkhardt et al. [6], who effectively simulated the implantation of a balloon-expandable stent inside a CoA, even though with various limitations: the final diameter of the stent at the most severe stenotic site was only 11.6 mm, while it should at least be comparable to the aortic diameter upstream and/or downstream from the CoA according to clinical indications; no stent recoil after expansion was simulated because of uncertainties about aortic tissue material properties; blood’s pressure was not taken into account throughout the whole simulation.
The lack of works about the virtual implantation of stents inside CoAs is mainly due to the focus of researchers being mostly on comparing the fluid dynamics before and after CoA repair. However, all the computational fluid dynamics (CFD) studies in literature share the drawback of being based on 3D geometries extracted from post-operative images, thus hindering the possibility to have a completely predictive approach. This could be possible only if FE simulations of CoA expansion by virtual stent implantation were previously run starting from pre-operative images and yielded reliable predictions of the post-stenting configuration of the stent and of the vessel.
That’s the aim of the current thesis work, i.e., developing a workflow to simulate the implantation of stents inside patient-specific FE models of coarcted aortas built from pre-operative images. Such a workflow, if leading to a reliable deformed configuration of the stent (and thus of the vessel) after the deflation of the balloon, would help clinicians to take informed decisions about the correct stent size and placement for every single patient and could be used by researchers for a deeper understanding of the causes of possible short- and long-term complications after CoA stenting. On this last point, some FE simulations were
vi run using literature pressure waveforms [7] for the inner surface of the aorta; the aim was to assess the consequences of stent’s placement on the aortic wall stress over the cardiac cycle.
Materials & Methods
One of the most used stents for the endovascular repair of native or recurrent CoA is the Cheatham-Platinum (CP) stent, a platinum/iridium stent produced by NuMED (Hopkinton, New York) [7]. It is implanted by means of the BIB (Balloon-in-Balloon) delivery system, which consists of an inner and an outer balloons [8]. Therefore, in order to simulate the stent implantation with a reasonable realism compared with the actual clinical procedure, it was necessary to build FE models of the CP stent, the two balloons and the anatomy. The various aspects of the simulated phenomena were modeled consistently with the use of the commercial FE explicit solver Abaqus/Explicit (Simulia, Dassault Systemes, USA).
The CP stent was discretized with beam elements in order to have short computational times as in the Master thesis work by Eva [10] and its material was described through a Von Mises plasticity model as in the work by Caimi et al. [11].
The FE models of the inner and outer balloons were taken from the work by Caimi et al. [11], who meshed them with membrane elements with uniform 150 µm thickness. The polymeric material of the balloons was modelled as linear, elastic and isotropic.
Two patient-specific aortic geometries were obtained through segmentation of pre-operative CT scans. In order to limit computational costs, the aortic wall was discretized into linear triangular shell elements with a uniform 2.35 mm thickness [12]. An isotropic linear elastic model was used to describe the mechanical response of aortic wall tissue.
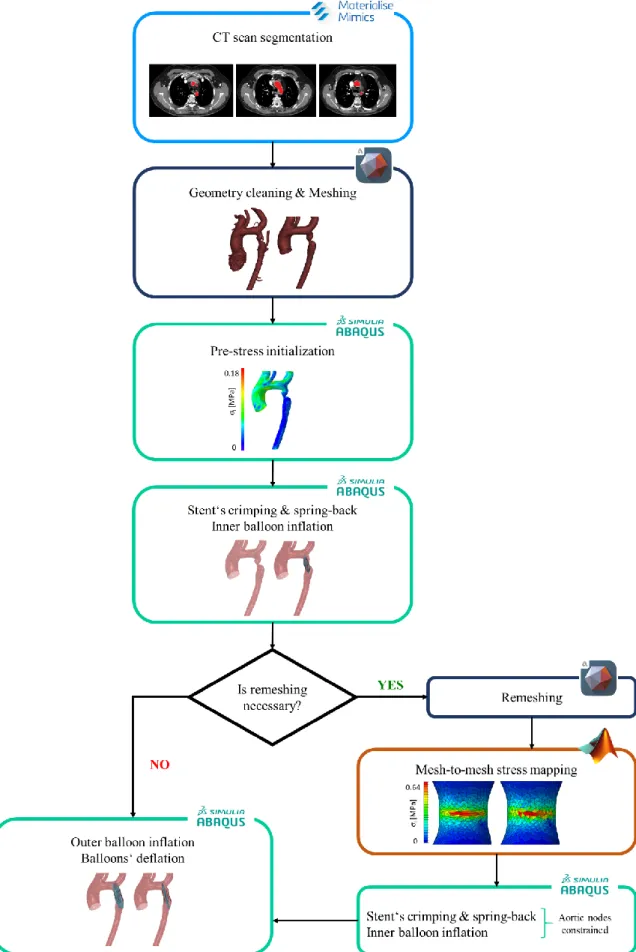
The implantation of a CP stent inside the patient-specific aortic model was simulated through the following steps (Figure 2):
1. segmentation of pre-operative CT scans to get the patient-specific geometry. 2. cleaning of the aortic geometry (i.e., deletion of the collateral vessels) and remeshing
of the triangulated surface that resulted from the segmentation.
3. computation of pre-stresses in the aortic wall that are present in vivo due to the end-diastolic blood pressure acting during image acquisition; these pre-stresses are found through the iterative process by Votta et al. [13] and are then assigned as initial conditions in the subsequent stent deployment simulations.
vii
Figure 2 Workflow to simulate the implantation of endovascular stents inside patient-specific FE models of
viii 4. FE simulation of:
− the crimping of the CP stent from its configuration at the end of the production process, assumed as stress-free, to the crimped configuration in which it is sold already mounted on the BIB catheter (inner diameter of 4 mm).
− the inflation of the inner balloon, while modeling its contact with the stent and with the pressurized aortic wall, by imposing a uniform inner pressure linearly increasing from 0 to 4 atm over 200 ms [11].
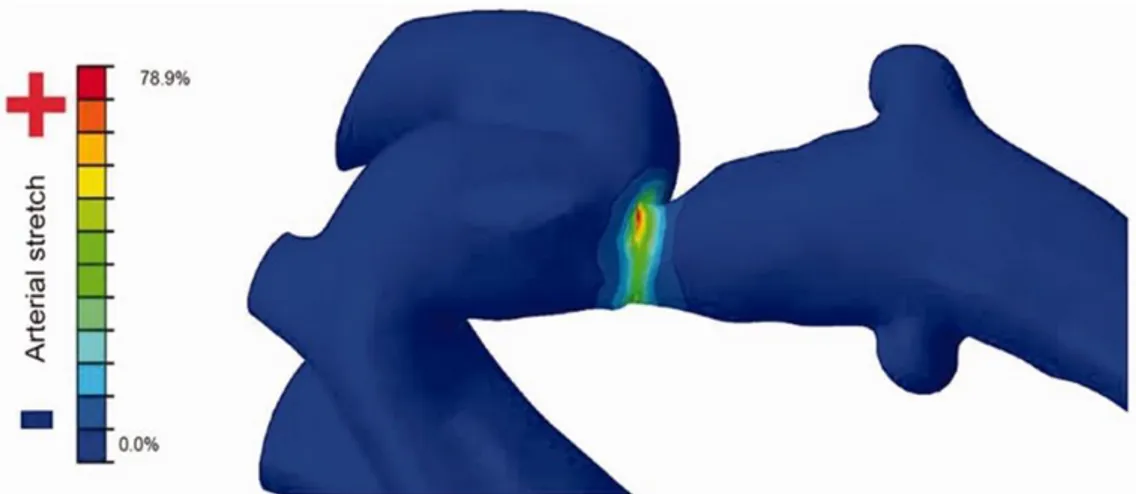
5. if needed, remeshing of the aortic geometry obtained through the inflation of the inner balloon. In this process, a custom script is run to map the stress distribution computed during the simulation from the original mesh to the new one and to set such stresses as initial condition in the remeshed geometry. The remeshing procedure was designed to cope with the simulated expansion of extremely severe CoAs, which requires a large dilation of the vessel and induces the circumferential stretching of the shell elements at the CoA. Such element distortion typically leads to an unstable behavior of the FE model or to artifacts in the aortic wall stress distribution, i.e., to unrealistic high local stresses, and hence to unrealistic elastic recoil of the vessel following balloon deflation.
6. FE simulation of:
− the inflation of the outer balloon up to a pressure that must be found in a patient-specific way according to the final target diameter, i.e., the diameter upstream and/or downstream from the CoA site measured on pre-operative images.
− the deflation of the inner and outer balloons so to allow for stent elastic recoil. During this step the diastolic pressure acting downstream from the coarctation is set almost equal to the one upstream so to account for the reduction of the ascending-to-descending aorta pressure drop that occurs when the narrowing at the CoA site is relieved; instead, during the previous steps, a pressure difference determined according to clinical studies [3] is applied between the two zones. If step 5, i.e., aortic wall remeshing, is deemed unnecessary, the process from step 4 to step 6 implies a single multi-step simulation. Elsewise, two simulations are implemented: the first one corresponds to step 4; the second one uses as input the results of step 5 and simulates step 6, after simulating again the stent crimping and the inflation of the inner balloon (step 4) within the fully constrained aortic model resulting from step 5.
ix The workflow was tested on two re-coarcted adult patients that have been implanted with a CP stent deployed through a BIB delivery system at IRCCS Policlinico San Donato (San Donato Milanese, MI, Italy). In order to verify the feasibility of the workflow, both patients were simulated with and without the remesh step, using as stent target diameter the one measured on operative fluoroscopies. The stent’s recoil computed by Abaqus was compared vs. measurements taken on operative fluoroscopies acquired after balloons’ deflation to understand whether remeshing was useful or unnecessary.
Moreover, in order to assess the consequences of the treatment on aortic wall stresses during the cardiac cycle, the structural response of the aortic wall to an intraluminal pressure waveform from the literature [7] was computed both for the pre- and post-stenting configurations. The pressure values applied upstream and downstream from the CoA site were set consistently for the CoA pressure drop in the pre-stenting configuration and for its relieving in the post-stenting configuration.
Results & Discussion
By comparing the diameter computed from Abaqus at the stent’s central cross-section after recoil with the one measured on peri-operative fluoroscopies, it was found that in patient # 1 the remeshing procedure was not particularly necessary, while in patient # 2 it was crucial to achieve an acceptable agreement with clinical evidences. This result was consistent with the expectations based on the patients’ anatomy: patient # 1 had an initial diameter at the obstruction level between 9.7 mm and 10.5 mm and was expanded up to 15.5 mm; patient # 2 had a lower initial diameter (min: 3.4 mm, max: 6.2 mm) and was expanded up to a higher diameter (17 mm) (Figure 3.A).
On this basis, mean diameters extracted from the simulations without (for patient # 1) or with (for patient # 2) the mesh replacement step at the most proximal, central and most distal stent’s cross-section after recoil were compared vs. the corresponding diameters measured on peri-operative fluoroscopies (Figure 3.B). Computed vs. measured diameter differences had a median value of 1.35 mm considering all the cross-sections along the stent’s length; in particular, the difference was comparable to twice the fluoroscopic image resolution (i.e., 0.4 mm) at the level of the most severe obstruction.
x
Figure 3 A) Pre-operative aortic geometries of the two patients analyzed in the current thesis work at the
coarctation level. B) Comparison between diameters measured on peri-operative fluoroscopies and mean diameters extracted from the simulations in the post-recoil configuration.
For what concerns the vessel’s wall stress over the cardiac cycle, a statistical comparison between the maximum principal stresses in the pre- and post-stenting configurations was performed for five sectors of the aortic intrados (proximal ascending aorta, distal ascending aorta, proximal aortic arch, distal aortic arch, isthmus). The latter was chosen as region of interest because aortic baroceptors are usually located there. Baroceptors, as hinted by Kenny et al. [14], may introduce some homeostatic mechanisms to maintain normal levels of blood pressure after CoA repair (thus preventing the risk of late-hypertension to which patients treated for CoA seem at risk): since baroceptors are sensitive to the stretch of the aortic wall induced by local blood pressure and since in the current thesis work stresses are directly proportional to strains due to the assumption of linear elasticity, analyzing the maximum principal stress on the aortic intrados was considered an adequate option.
xi The stress change seemed to be related to the severity of the CoA obstruction. In patient # 1, who had a far less severe coarctation as compared to patient # 2, at some time points through the cardiac cycle some sectors did not display significant stress differences between the pre- and post-stenting configurations. Instead in patient # 2 there were always significant differences and the increase in the stress median was more evident for all sectors than in patient # 1 (Figure 4). The isthmus region seemed to be an exception to this trend: it always
experienced a stress increase regardless of the obstruction’s severity (Figure 4, green curve). That’s probably because the isthmus is the sector most proximal to the stent among the ones considered and hence it is the region that is most strained during stent’s expansion, thus accumulating high stresses that in part remain even after balloons’ deflation.
Figure 4 Plots of the median of the maximum principal stress over the cardiac cycle in the pre-operative (left)
xii
Conclusions
In the current thesis work a workflow was designed to simulate the implantation of stents inside patient-specific FE models of coarcted aortas built from pre-operative images. The key points of the designed workflow are the short computational times (~ 60 h when all the steps of the workflow are carried out) and a remeshing procedure that allows for removing mesh distortion while preserving the information of the wall stress distribution. In this way the remeshing procedure allowed for simulating even the most critical case of CoA. Even though the workflow was tested only on two patients and the complete validation of numerical results was not feasible through a single 2D fluoroscopic projection, the FE strategy proved to be consistent with clinical evidences and able to reproduce with reasonable accuracy the deformed configuration of the stent (and thus of the vessel) after the deflation of the balloons.
Furthermore, during the cardiac cycle simulations, it was found that the endovascular CoA treatment either doesn’t modify or increases the stress experienced by the aortic intrados during the cardiac cycle, provided that blood pressure remains the same upstream from the CoA. That’s likely because the stenting does not affect in a significant way the shape of the aortic arch. It might be tempting to interpret these results as a confirmation of those clinical studies indicating late-hypertension as one of the major long-term complications after both surgical and endovascular CoA repair [4]. However, since in structural simulations pressure is applied as a load and not computed by the FEM solver, a more comprehensive approach should be exploited to achieve a deeper insight into the clinical problem.
For example, an interesting and more accurate work that can be done starting from the 3D implant site geometries obtained in Abaqus is a fluid-structure interaction (FSI) simulation of the cardiac cycles. In the presence of an adequate mechanical model of the aortic tissue that accounts for the deformability of the vessel wall and of patient-specific inflow and outflow boundary conditions (i.e., a patient-specific flow waveform at the sinotubular junction obtained from 4D-flow data and patient-specific RCR models at the outlets of the three supra-aortic branches and of the descending aorta), an FSI simulation will likely predict eventual changes in the pressure-regime caused by the stent implantation. That’s because it will take into account also pressure wave propagation phenomena that are ignored by FE or CFD simulations, thus allowing to test the hypothesis that the rigid stent would act as an
xiii early reflection site for the pressure wave and so would expose the stented patient to the risk of developing late-hypertension in the long term.
References
[1] D. van der Linde, E. Konings, M. Slager, M. Witsenburg, W. Helbing, J. Takkenberg and J. Roos-Hesselink, “Birth Prevalence of Congenital Heart Diseases Worlwide: A Systematic Review and Meta-Analysis,” Journal of the American College of Cardiology, vol. 58, no. 21, pp. 2241-47, Nov 2011. [2] A. Karaosmanoglu, R. Khawaja, M. Onur and M. Kalra, “CT and MRI of aortic coarctation: pre- and
postsurgical findings,” AJR Am J Roentgenol, vol. 204, no. 3, pp. 224-33, Mar 2015.
[3] J. Meadows, M. Minahan, D. McElhinney, K. McEnaney and R. Ringel, “Intermediate Outcomes in the Prospective, Multicenter Coarctation of the Aorta Stent Trial (COAST),” Circulation, vol. 131, no. 19, pp. 1656-64, May 2015.
[4] J. Martins, J. Zachariah, E. Selamet Tierney, U. Truong, S. Morris, S. Kutty, S. de Ferranti, J. Rhodes, M. Antonio, M. Guarino, B. Thomas, D. Oliveira, K. Gauvreau, N. Jalles, T. Geva, M. Carmo and A. Prakash, “Rationale and design of Long-term Outcomes and Vascular Evaluation after Successful Coarctation of the Aorta Treatment study,” Ann Pediatr Cardiol, vol. 11, no. 3, pp. 282-296, Sep-Dec 2018.
[5] D. Cosentino, C. Capelli, G. Derrick, S. Khambadkone, V. Muthurangu, A. Taylor and S. Schievano, “Patient-specific computational models to support interventional procedures: a case study of complex aortic re-coarctation,” EuroIntervention, vol. 11, no. 6, pp. 669-72, Oct 2015.
[6] B. Burkhardt, N. Byrne, M. Velasco Forte, F. Iannaccone, B. De, G. Morgan and T. Hussain, “Evaluation of a modified Cheatham-Platinum stent for the treatment of aortic coarctation by finite element modelling,” JRSM Cardiovasc Dis, Apr 2018.
[7] C. Conti, E. Votta, A. Della Corte, L. Del Viscovo, C. Bancone, M. Cotrufo and A. Redaelli, “Dynamic finite element analysis of the aortic root from MRI-derived parameters,” Med Eng Phys, vol. 32, no. 2, pp. 212-21, Mar 2010.
[8] NuMED, [Online]. Available: http://www.numedforchildren.com/barestent-ce.htm. [9] NuMED, [Online]. Available: http://www.numedforchildren.com/bibsp-ce.htm.
[10] A. Eva, “Ottimizzazione di un modello a elementi finiti per la simulazione della procedura di pre-stenting in fase prechirurgica,” Politecnico di Milano, 2017.
[11] A. Caimi, F. Sturla, F. Pluchinotta, L. Giugno, F. Secchi, E. Votta, M. Carminati and A. Redaelli, “Prediction of stenting related adverse events through patient-specific finite element modelling,” J
Biomech, vol. 79, pp. 135-146, Oct 2018.
[12] A. Malayeri, S. Natori, H. Bahrami, A. Bertoni, R. Kronmal, J. Lima and D. Bluemke, “Relation of aortic wall thickness and distensibility to cardiovascular risk factors (from the Multi-Ethnic Study of Atherosclerosis [MESA]).,” Am J Cardiol, vol. 102, no. 4, pp. 491-6, Aug 2008.
xiv
[13] E. Votta, M. Presicce, A. Della Corte, S. Dellegrottaglie, C. Bancone, F. Sturla and A. Redaelli, “A novel approach to the quantification of aortic root in vivo structural mechanics,” Int J Numer Method Biomed
Eng, vol. 33, no. 9, Oct 2016.
[14] D. Kenny, J. Polson, R. Martin, M. Caputo, D. Wilson, J. Cockcroft, J. Paton and A. Wolf, “Relationship of aortic pulse wave velocity and baroreceptor reflex sensitivity to blood pressure control in patients with repaired coarctation of the aorta,” Am Heart J, vol. 162, no. 2, pp. 398-404, Aug 2011.
xv
Sommario
Contesto clinico
La coartazione dell’aorta (CoA) è una stenosi localizzata nell’aorta discendente toracica ed è la 6° forma più diffusa di difetto cardiaco congenito [1]. Nel lungo termine può portare a ipertrofia ventricolare e ipertensione sistemica nella parte superiore del corpo, che aumentano rispettivamente il rischio di insufficienza cardiaca e di aneurismi cerebrali [2]. La CoA può essere trattata tramite intervento chirurgico (e.g., asportazione del segmento coartato) o tramite impianto di uno stent per ristabilire a livello della CoA un diametro vascolare comparabile a quelli prossimale e distale alla stenosi (Figura 1) [2]. Il primo trattamento è solitamente impiegato in neonati e bambini, mentre il secondo è la scelta di elezione per ricoartazioni adulte (i.e., ristenosi successive a interventi chirurgici riusciti) [2].
Figura 1 Rappresentazione schematica della CoA prima (sinistra) e dopo (destra) il trattamento endovascolare.
Entrambi i trattamenti hanno risultati ottimi nell’alleviare nel breve termine il gradiente pressorio causato dalla CoA [3]. Nel lungo termine, tuttavia, vi è un’alta recidiva di ipertensione [4]. Tra le cause proposte vi sono una forma anomala dell’arco aortico che persiste anche dopo l’intervento e un’aumentata rigidità aortica [4]. Quest’ultima sarebbe dovuta, nel caso chirurgico, alla cicatrice fibrotica che si forma a livello dell’anastomosi e, nel caso del trattamento endovascolare, all’alta rigidezza dello stent metallico. In entrambi i
xvi casi si determinerebbe un sito di riflessione dell’onda pressoria che porterebbe a un’elevata sovrapposizione dell’onda riflessa con quella incidente e quindi a ipertensione aortica, sebbene l’ostacolo al flusso rappresentato dalla CoA sia stato rimosso [4].
Stato dell’arte
Per quanto noto all’autore, nella letteratura scientifica sono presenti solo due articoli su simulazioni agli elementi finiti (FE) di impianto di stent in coartazioni. Il primo è un lavoro di Cosentino et al. [5], i quali tuttavia hanno considerato un caso abbastanza inconsueto nella pratica clinica: un paziente affetto da CoA nel quale, 10 anni dopo l’impianto di uno stent da 14 mm di diametro, era stata trovata evidenza di recidiva e di formazione di un aneurisma in corrispondenza della porzione prossimale dello stent. Il secondo studio è di Burkhardt et al. [6], i quali hanno effettivamente simulato l’impianto di uno stent espandibile con palloncino all’interno di una CoA, ma con alcune limitazioni: il diametro finale raggiunto dallo stent alla sezione col minore diametro pre-operatorio era solo 11.6 mm, mentre le indicazioni cliniche suggeriscono che esso dovrebbe essere almeno comparabile a quello a monte e/o a valle della CoA; non è stato simulato il recoil dello stent a causa di incertezze sulle proprietà meccaniche del vaso; non è stato tenuto conto della pressione sanguigna. La mancanza di studi sull’impianto virtuale di stent in coartazioni è dovuta al fatto che l’interesse dei ricercatori si è rivolto prevalentemente a paragonare la fluidodinamica prima e dopo il trattamento della CoA. Tuttavia gli studi di fluidodinamica computazionale (CFD) in letteratura hanno lo svantaggio di basarsi su geometrie 3D estratte da immagini post-operatorie, il che inficia la possibilità di un approccio completamente predittivo. Ciò si avrebbe solo se fosse possibile effettuare simulazioni FE di dilatazione della CoA mediante stent in geometrie ottenute da immagini pre-operatorie e se tali simulazioni conducessero a un’affidabile predizione della configurazione post-stenting del sito di impianto.
In tale contesto si inserisce la presente tesi, con lo scopo appunto di sviluppare un workflow per simulare l’impianto di stent in modelli FE paziente-specifici di coartazioni ottenuti da immagini pre-operatorie. Un tale workflow, se risultasse in una verosimile configurazione post-stenting del sito di impianto, aiuterebbe i clinici a prendere decisioni informate sulla corretta taglia e sul corretto posizionamento dello stent e potrebbe essere sfruttato dai ricercatori per giungere a una più approfondita comprensione delle cause di possibili
xvii complicanze a breve e lungo termine in seguito al trattamento endovascolare di CoA. A tal proposito, sono state eseguite delle simulazioni FE utilizzando delle curve pressorie ricavate da letteratura [7] per la superficie interna dell’aorta con lo scopo di valutare le conseguenze dell’impianto di uno stent sugli sforzi in parete durante il ciclo cardiaco.
Materiali e metodi
Uno degli stent più usati per il trattamento endovascolare di CoA native o ricorrenti è il Cheatham-Platinum (CP) stent, uno stent di platino/iridio prodotto da NuMED (Hopkinton, New York) [8]. Viene impiantato tramite il sistema BIB (Balloon-in-Balloon), che comprende un palloncino interno e uno esterno [9]. Pertanto, al fine di simulare l’impianto dello stent in maniera realistica, è stato necessario elaborare dei modelli FE del CP stent, dei due palloncini e dell’anatomia. I vari aspetti dei fenomeni simulati sono stati modellati con il solutore FE commerciale esplicito Abaqus/Explicit (Simulia, Dassault Systemes, USA). Il CP stent è stato discretizzato con elementi beam per avere tempi computazionali ristretti come nella tesi di Eva [10] e il suo comportamento meccanico è stato descritto tramite un modello plastico di Von Mises come nello studio di Caimi et al. [11].
I modelli FE dei palloncini interno ed esterno sono quelli del lavoro di Caimi et al. [11], che hanno utilizzato degli elementi membrane con spessore uniforme di 150 µm. Il materiale polimerico dei palloncini è stato modellato come lineare, elastico e isotropo.
Due geometrie aortiche paziente-specifiche sono state ottenute dalla segmentazione di immagini CT pre-operatorie. Al fine di limitare i costi computazionali, la parete aortica è stata discretizzata con elementi shell triangolari con spessore uniforme di 2.35 mm [12]. Per descriverne le proprietà meccaniche è stato adottato un modello isotropo lineare elastico. La simulazione dell’impianto del CP stent ha previsto i seguenti step (Figura 2):
1. segmentazione delle CT pre-operatorie per ottenere la geometria paziente-specifica. 2. rifinitura della geometria pre-operatoria (i.e., eliminazione dei circoli collaterali) e
remeshing della superficie triangolata che risulta dalla segmentazione.
3. calcolo dei pre-stress che in vivo interessano la parete aortica a causa della pressione diastolica che su di essa agisce durante l’acquisizione delle immagini; essi vengono calcolati mediante la procedura iterativa di Votta et al. [13] e sono poi assegnati come condizioni iniziali nelle successive simulazioni di espansione dello stent.
xviii
Figura 2 Workflow per simulare l’impianto di stent endovascolari all’interno di modelli FE paziente-specifici
xix 4. simulazione FE di:
– crimpaggio del CP stent dalla configurazione al termine del processo di produzione, che viene assunta come priva di sforzo, alla configurazione crimpata in cui viene venduto già montato sul catetere BIB (diametro interno di 4 mm). – gonfiaggio del palloncino interno tramite una rampa di pressione da 0 a 4 atm in
200 ms [11]. In tale step sono attivi i contatti tra palloncino, stent e anatomia. 5. se necessario, remeshing della geometria aortica ottenuta al termine dello step 4. La
distribuzione di sforzi calcolata dalla simulazione viene mappata mediante uno script appositamente implementato dalla mesh originale a una nuova mesh e gli sforzi trovati vengono assegnati agli elementi di tale nuova mesh come condizioni iniziali. Questa procedura di remeshing è stata elaborata per poter simulare i casi di CoA molto severi, i quali, richiedendo una rilevante dilatazione, comportano una notevole deformazione in direzione prevalentemente circonferenziale degli elementi shell alla CoA. Tale distorsione degli elementi conduce tipicamente a un comportamento instabile del modello FE o ad artefatti nella distribuzione degli sforzi in parete, ossia a sforzi locali inverosimilmente elevati che comportano quindi un recoil elastico del vaso irrealisticamente elevato a seguito dello sgonfiaggio del palloncino esterno. 6. simulazione FE di:
– gonfiaggio del palloncino esterno fino a un valore di pressione da determinare su base paziente-specifica a seconda del diametro finale desiderato, ossia del diametro a monte e/o valle della CoA misurato sulle immagini pre-operatorie. – sgonfiaggio di entrambi i palloncini per consentire il recoil elastico dello stent.
Durante questo step a valle della CoA è stata imposta una pressione diastolica pressoché uguale a quella a monte per considerare la riduzione del gradiente pressorio tra aorta ascendente e discendente causata dalla dilatazione del vaso a livello della CoA; al contrario, negli step precedenti, è stata imposta una pressione a valle inferiore a quella a monte in maniera tale da tenere conto dei valori di gradiente pressorio determinato dalla CoA riportati in studi clinici [3].
Se lo step 5, i.e., il remeshing della parete aortica, è ritenuto necessario, la procedura dallo step 4 allo step 6 implica una singola simulazione a più step. Altrimenti, due simulazioni devono essere eseguite: la prima corrisponde allo step 4; la seconda utilizza come input il risultato dello step 5 e prevede la simulazione dello step 6 dopo che il crimpaggio dello stent
xx e il gonfiaggio del palloncino interno (step 4) sono stati nuovamente simulati all’interno del modello aortico risultante dallo step 5 coi nodi completamente bloccati.
Il workflow è stato testato su due pazienti adulti affetti da ricoartazione ai quali è stato impiantato un CP stent tramite sistema BIB all’IRCCS Policlinico San Donato (San Donato Milanese, MI, Italy). Al fine di verificare l’efficacia del workflow, entrambi i pazienti sono stati simulati con e senza lo step di remesh, utilizzando come diametro target quello misurato sulle fluoroscopie operatorie. Il recoil dello stent calcolato da Abaqus è stato poi confrontato con misure ottenute su fluoroscopie operatorie acquisite dopo lo sgonfiaggio dei palloncini con lo scopo di capire se il remeshing fosse stato utile o non necessario.
Inoltre, al fine di valutare le conseguenze dell’impianto sullo sforzo in parete durante il ciclo cardiaco, la risposta strutturale della parete arteriosa a una curva di pressione intraluminale da letteratura [13] è stata calcolata sia per la configurazione pre- che per quella post-stenting. I valori di pressione applicati a monte e a valle della CoA sono stati settati nella configurazione pre-stenting, in maniera tale da tenere conto della caduta di pressione causata dalla CoA e, nella configurazione post-stenting, in modo da considerare la riduzione di essa.
Risultati e discussione
Confrontando i diametri calcolati da Abaqus a livello della sezione centrale dello stent dopo il recoil con quelli misurati sulle fluoroscopie operatorie, è emerso che nel paziente # 1 la procedura di remeshing non è stata particolarmente necessaria, mentre nel paziente # 2 è stata cruciale al fine di ottenere un’accettabile concordanza con l’evidenza clinica. Tale risultato è in accordo con le aspettative basate sull’anatomia dei due pazienti: il paziente # 1 aveva un diametro iniziale a livello della CoA compreso tra 9.7 mm e 10.5 mm ed è stato espanso fino a 15.5 mm; invece il paziente # 2 aveva un diametro iniziale minore (min: 3.4 mm, max: 6.2 mm) ed è stato espanso fino a un diametro maggiore (17 mm) (Figura 3.A). Premesso ciò, i diametri medi estratti dalle simulazioni senza (per il paziente # 1) o con (per il paziente # 2) remeshing alle sezioni più prossimale, centrale e più distale dello stent sono stati comparati ai corrispondenti diametri misurati sulle fluoroscopie operatorie (Figura 3.B). La differenza tra i diametri calcolati e quelli misurati ha una mediana di 1.35 mm considerate tutte le sezioni; in particolare, la differenza è paragonabile al doppio della risoluzione delle fluoroscopie (i.e., 0.4 mm) a livello della sezione col minore diametro pre-operatorio.
xxi
Figura 3 A) Geometrie aortiche pre-operatorie a livello della CoA dei due pazienti considerati nella presente
tesi. B) Confronto tra i diametri misurati sulle fluoroscopie operatorie e i diametri medi estratti dalle simulazioni nella configurazione post-recoil.
Per quanto riguarda lo sforzo in parete durante il ciclo cardiaco, è stato fatto un confronto statistico tra gli sforzi massimi principali nelle configurazioni pre- e post-stenting in cinque settori dell’intradosso aortico (aorta ascendente prossimale, aorta ascendente distale, arco aortico prossimale, arco aortico distale, istmo). L’intradosso è stato scelto come regione di interesse perché è dove si concentrano i barocettori. Questi ultimi, come suggerito da Kenny et al. [14], potrebbero mettere in atto dei meccanismi omeostatici per mantenere la pressione sanguigna a livelli normali dopo il trattamento della CoA (prevenendo in tal modo il rischio di ipertensione cui paiono soggetti nel lungo termine i pazienti operati di CoA [4]): dal momento che i barocettori sono sensibili allo stiramento della parete arteriosa indotto dalla pressione sanguigna locale e dal momento che nella presente tesi sforzi e deformazioni sono direttamente proporzionali per via dell’ipotesi di elasticità lineare, analizzare gli sforzi massimi principali sull’intradosso aortico è stata ritenuta un’opzione adeguata.
xxii Le modifiche trovate nello sforzo in parete tra le configurazioni pre- e post-stenting paiono essere legate alla severità della CoA. Nel paziente # 1, che aveva una coartazione assai meno severa rispetto al paziente # 2, alcuni settori ad alcuni istanti del ciclo cardiaco non hanno mostrato differenze significative tra le due configurazioni. Invece nel paziente # 2 sono sempre state trovate differenze significative e l’incremento nella mediana dello sforzo era più evidente che nel paziente # 1 per tutti i settori (Figura 4). La regione dell’istmo è sembrata
costituire un’eccezione a questa tendenza: ha infatti sempre subito un aumento di sforzo indipendentemente dalla severità della stenosi (Figura 4, curva verde). Ciò probabilmente perché l’istmo è il settore più prossimale allo stent tra quelli considerati e quindi è la regione che maggiormente si deforma durante l’espansione del dispositivo, accumulando quindi sforzi elevati che in parte persistono anche dopo lo sgonfiaggio dei palloncini.
Figura 4 Andamenti temporali durante il ciclo cardiaco delle mediane degli sforzi massimi principali nelle
xxiii
Conclusioni
Nella presente tesi è stato implementato un workflow per simulare l’impianto di stent in modelli FE paziente-specifici di aorte coartate ottenuti da immagini pre-operatorie. Punti-chiave del workflow elaborato sono i tempi computazionali ridotti (~ 60 h se tutti gli step della procedura vengono eseguiti) e una procedura di remeshing che consente di rimuovere distorsioni della mesh preservando al contempo l’informazione sullo sforzo in parete. In tal modo la procedura di remeshing ha consentito di simulare anche un caso critico di CoA quale era il paziente # 2. Anche se il workflow è stato testato su due soli pazienti e una validazione completa dei risultati numerici non è stata possibile utilizzando una singola proiezione fluoroscopica 2D, la strategia FE implementata si è rivelata concorde con le evidenze cliniche e in grado di riprodurre con ragionevole accuratezza la configurazione deformata dello stent (e quindi del vaso) dopo lo sgonfiaggio dei palloncini.
Inoltre, durante le simulazioni dei cicli cardiaci, è stato osservato che il trattamento endovascolare della CoA o non modifica o aumenta lo sforzo cui è soggetta la parete aortica durante il ciclo, purchè la pressione sanguigna rimanga la stessa a monte della CoA. Ciò ragionevolmente perché l’impianto dello stent non altera la forma dell’arco aortico in maniera significativa. Sarebbe allettante interpretare questi risultati come una conferma di quegli studi clinici che indicano l’ipertensione come una delle maggiori complicanze a lungo termine sia del trattamento chirurgico che di quello endovascolare della CoA [4]. Tuttavia, dal momento che nelle simulazioni strutturali la pressione viene imposta e non calcolata dal solutore FEM, si dovrebbe ricorrere a un approccio più articolato per giungere a una maggiore comprensione del problema clinico.
Per esempio, un interessante e più accurato studio che potrebbe essere condotto in futuro a partire dalle geometrie 3D del sito di impianto calcolate da Abaqus è una simulazione di interazione fluido-struttura (FSI) dei cicli cardiaci. In presenza di un adeguato modello meccanico del tessuto aortico che tenga conto della deformabilità della parete e di condizioni al contorno paziente-specifiche all’inlet e agli outlets del modello (i.e., una curva di flusso paziente-specifica alla giunzione sinotubulare ottenuta da dati 4D-flow e delle reti RCR paziente-specifiche agli outlets dei tre vasi sovraortici e dell’aorta discendente), una simulazione FSI dovrebbe teoricamente predire eventuali cambiamenti nel regime pressorio causati dall’impianto dello stent. Questo perché terrebbe in considerazione anche fenomeni di propagazione dell’onda di pressione che sono ignorati dalle simulazioni FE o CFD,
xxiv consentendo pertanto di testare l’ipotesi che lo stent, con la sua elevata rigidezza, agirebbe da sito di riflessione dell’onda pressoria esponendo pertanto il paziente al rischio di sviluppare ipertensione nel lungo termine.
Bibliografia
[1] D. van der Linde, E. Konings, M. Slager, M. Witsenburg, W. Helbing, J. Takkenberg and J. Roos-Hesselink, “Birth Prevalence of Congenital Heart Diseases Worlwide: A Systematic Review and Meta-Analysis,” Journal of the American College of Cardiology, vol. 58, no. 21, pp. 2241-47, Nov 2011. [2] A. Karaosmanoglu, R. Khawaja, M. Onur and M. Kalra, “CT and MRI of aortic coarctation: pre- and
postsurgical findings,” AJR Am J Roentgenol, vol. 204, no. 3, pp. 224-33, Mar 2015.
[3] J. Meadows, M. Minahan, D. McElhinney, K. McEnaney and R. Ringel, “Intermediate Outcomes in the Prospective, Multicenter Coarctation of the Aorta Stent Trial (COAST),” Circulation, vol. 131, no. 19, pp. 1656-64, May 2015.
[4] J. Martins, J. Zachariah, E. Selamet Tierney, U. Truong, S. Morris, S. Kutty, S. de Ferranti, J. Rhodes, M. Antonio, M. Guarino, B. Thomas, D. Oliveira, K. Gauvreau, N. Jalles, T. Geva, M. Carmo and A. Prakash, “Rationale and design of Long-term Outcomes and Vascular Evaluation after Successful Coarctation of the Aorta Treatment study,” Ann Pediatr Cardiol, vol. 11, no. 3, pp. 282-296, Sep-Dec 2018.
[5] D. Cosentino, C. Capelli, G. Derrick, S. Khambadkone, V. Muthurangu, A. Taylor and S. Schievano, “Patient-specific computational models to support interventional procedures: a case study of complex aortic re-coarctation,” EuroIntervention, vol. 11, no. 6, pp. 669-72, Oct 2015.
[6] B. Burkhardt, N. Byrne, M. Velasco Forte, F. Iannaccone, B. De, G. Morgan and T. Hussain, “Evaluation of a modified Cheatham-Platinum stent for the treatment of aortic coarctation by finite element modelling,” JRSM Cardiovasc Dis, Apr 2018.
[7] C. Conti, E. Votta, A. Della Corte, L. Del Viscovo, C. Bancone, M. Cotrufo and A. Redaelli, “Dynamic finite element analysis of the aortic root from MRI-derived parameters,” Med Eng Phys, vol. 32, no. 2, pp. 212-21, Mar 2010.
[8] NuMED, [Online]. Available: http://www.numedforchildren.com/barestent-ce.htm. [9] NuMED, [Online]. Available: http://www.numedforchildren.com/bibsp-ce.htm.
[10] A. Eva, “Ottimizzazione di un modello a elementi finiti per la simulazione della procedura di pre-stenting in fase prechirurgica,” Politecnico di Milano, 2017.
[11] A. Caimi, F. Sturla, F. Pluchinotta, L. Giugno, F. Secchi, E. Votta, M. Carminati and A. Redaelli, “Prediction of stenting related adverse events through patient-specific finite element modelling,” J
xxv
[12] A. Malayeri, S. Natori, H. Bahrami, A. Bertoni, R. Kronmal, J. Lima and D. Bluemke, “Relation of aortic wall thickness and distensibility to cardiovascular risk factors (from the Multi-Ethnic Study of Atherosclerosis [MESA]).,” Am J Cardiol, vol. 102, no. 4, pp. 491-6, Aug 2008.
[13] E. Votta, M. Presicce, A. Della Corte, S. Dellegrottaglie, C. Bancone, F. Sturla and A. Redaelli, “A novel approach to the quantification of aortic root in vivo structural mechanics,” Int J Numer Method Biomed
Eng, vol. 33, no. 9, Oct 2016.
[14] D. Kenny, J. Polson, R. Martin, M. Caputo, D. Wilson, J. Cockcroft, J. Paton and A. Wolf, “Relationship of aortic pulse wave velocity and baroreceptor reflex sensitivity to blood pressure control in patients with repaired coarctation of the aorta,” Am Heart J, vol. 162, no. 2, pp. 398-404, Aug 2011.
1
1. Clinical background
1.1 The aorta
The aorta is the largest artery in the human body. It originates from the left ventricle of the heart (the muscular organ that pumps oxygenated blood to all parts of the body through the blood vessels of the systemic circulation), to which it is connected through the aortic valve, and extends down to the abdomen.
1.1.1 Anatomy of the aorta
The aortic wall is composed of three layers: the intima, the media, and the adventitia. The intima is a monolayer of endothelial cells in contact with blood; the media is the thickest layer and is composed of concentric layers of elastin, smooth muscle cells, and collagen; the adventitia is the external layer and it contains the vasa vasorum that supply blood to the aortic wall cells [1].
The aorta is classically divided into two major anatomic segments, the thoracic and abdominal aorta. The thoracic aorta is formed by several distinct anatomic regions: the aortic root, the ascending aorta and the descending aorta. The aortic root is defined as the segment between the aortic annulus (the ventriculo-arterial crown-like attachment that defines the shape of the aortic valve) and the sinotubular junction (the ridge at the top of the aortic sinuses, where the aorta becomes a tubular structure). The ascending aorta starts at the sinotubular junction and ends at the take-off of the most proximal of the three supra-aortic vessels, which are the arteries that bring blood to the upper part of the body. The aortic arch represents the curved portion of the aorta between the ascending and the descending aorta and gives rise to the three supra-aortic branches. From proximal to distal, these three branches are the brachiocephalic trunk (also called “innominate artery”), the left common carotid artery, and the left subclavian artery. The brachiocephalic trunk supplies the right side of the head and neck as well as the right arm and chest wall, while the other two together supply the left side of the same regions. Finally, the descending aorta starts downstream the
2 origin of the subclavian artery and can be divided into a thoracic and an abdominal part at the diaphragm level (Figure 1.1) [1].
Figure 1.1 Anatomic regions of the aorta. Adapted from [1].
The normal size of aortic segments is principally related to body surface area (BSA) and age [2]. It can be measured by various imaging techniques, such as echocardiography. Normal ranges for the sizes of the various aortic segments are shown inTable 1.1.
Aortic segment Normal adult size range [mm] Dimensions indexed to BSA [mm/m2]
Aortic annulus Sinuses of Valsalva Sinotubular junction Ascending thoracic aorta Aortic arch
Descending thoracic aorta
20 – 31 29 – 45 22 – 36 22 – 36 22 – 36 20 – 22 13 ± 1 19 ± 1 15 ± 1 15 ± 2 – –
3 1.1.2 Physiology of the aorta
The main physiological role of the aorta is to transfer oxygenated blood from the left heart into the body. In addition to the conduit function, the aorta also accomplishes a buffering function, known as Windkessel effect [3]. It damps the fluctuation in blood pressure (pulse pressure) over the cardiac cycle and helps in maintaining organ perfusion during diastole when cardiac ejection stops. This is due to its visco-elastic behavior given by the elastic fibers that partially form the aortic wall. During systole the left ventricle contracts to push blood into the aorta and thus the aorta distends storing about 50% of the left ventricular stroke volume [3]. This elastic stretching gives the potential energy that will help maintain blood pressure during diastole: during this time the aorta recoils and so forwards the blood volume stored during systole to the peripheral circulation, thus creating a nearly continuous peripheral blood flow despite the pulsatile action of the heart.
1.1.3 Pulse wave velocity and aortic stiffness
Aortic pulse wave velocity (PWV) is the velocity at which the blood pressure pulse propagates through the aorta. It can be calculated from non-invasive measurements such as the transit time (Δt, [s]) of the systolic flow curves obtained from magnetic resonance imaging (MRI) between two measuring sites (e.g. the ascending and descending aorta) and the distance between the centroids of the two cross-sections (Δd, [m]) [4]:
𝑃𝑊𝑉 =∆𝑑
∆𝑡
The PWV is used clinically as a measure of arterial stiffness because it can be related through the Moens-Korteweg equation to the elastic modulus of the arterial wall (under the assumption of linear elastic mechanical properties) [4]:
𝑃𝑊𝑉 = √𝐸ℎ 2𝑅𝜌
E is the elastic modulus of the vessel wall, h is the wall thickness (assumed constant), R is
the wall radius (assumed constant under the hypothesis of small deformation) and ρ is the blood’s density (assumed to be constant, i.e., blood is assumed incompressible).
The Mons-Korteweg equation shows that having a high PWV means having particularly stiff arteries. This can lead to hypertension owing to the mechanism that is going to be explained. The pressure wave generated by the beating heart (forward or incident wave) is propagated
4 to arteries through the body. Changes in aortic stiffness (which increases from the proximal to the distal aorta), together with changes in aortic diameter (which progressively decreases with distance from the heart) and arterial branching, creates impedance mismatches causing partial reflections of forward progressing incident pressure waves and so giving rise to reflected waves travelling back to the central aorta. Thus, the measured pressure wave is the sum of incident and reflected pressure waves. The stiffer is a certain aortic segment (and so the higher is the PWV in it) and the closer it is to the principal reflection sites of the systemic circulation (i.e., the abdominal aorta bifurcation), the higher could be the overlap between forward and reflected pressure waves [5].
For example, in elderly and in patients affected by certain pathologies, the central aorta becomes stiffer leading to a loss of the physiological impedance mismatch between central and peripheral arteries (normally the latter are stiffer than the former) and to an increase in PWV. Thus, reflected waves arrive at central aorta in early systole (and not in diastole, as it normally happens) and are completely overlapped to the incident pressure wave, leading to an increase in systolic blood pressure and ultimately to hypertension (Figure 1.2).
Figure 1.2 Impedance mismatch and wave pressure reflection in normotensive (NT) and hypertensive (HT)
5
1.2 Coarctation of the aorta (CoA)
Given the key role that aorta plays in the cardiovascular system, pathologies affecting the aorta can be of uttermost importance. This is even more true considering that nowadays cardiovascular diseases are the leading cause of death in the Western world [7]. Among these are congenital heart defects (CHDs). Coarctation of the aorta (CoA) is the sixth most common form of CHD, with a birth prevalence of 0.34 per 1,000 live births [7] and an higher frequency in males than in females (59 versus 41%) [7]. It is a localized stenosis in the proximal descending thoracic aorta and it is often present in association with hypoplasia of the aortic arch and bicuspid aortic valve (up to 75% of patients with CoA) [8, 9].
The etiology of CoA is still poorly understood. Among the alleged embryologic causes there are abnormal migration patterns of the developing aortic arch, reduced blood flow through the aorta due to intracardiac anomalies and extension of the ductal tissue (rich in smooth muscle cells) inside the aortic wall (rich in elastic extra-cellular matrix) [10].
1.2.1 CoA classification
There are three main types of CoA (Figure 1.3), named according to the location of the coarctation ridge with respect to the insertion of the ductus arteriosus [10]:
• PREDUCTAL COARCTATION: the narrowing is proximal to the ductus arteriosus, which is a blood vessel in the developing fetus that connects the main pulmonary artery to the proximal descending aorta. In the fetus it allows venous blood from the right ventricle to circumvent the non-functioning lungs; it normally closes in the first few days of life becoming the ligamentum arteriosus. From a histological standpoint, this kind of coarctation is in continuation with the smooth muscular tissue of the arterial duct [11].
• JUXTADUCTAL COARCTATION: the narrowing occurs at the insertion of the ductus arteriosus. This is quite a rare case.
• POSTDUCTAL COARCTATION: the narrowing is distal to the insertion of the ductus arteriosus. In this case microscopy reveals localized intimal hyperplasia and depletion and disarray of the medial elastic fibers [11].
6
Figure 1.3 Schematic drawing of alternative locations of CoA.
1.2.2 Pathophysiology of CoA
Preductal aortic coarctation is typical of infancy [10]. When the duct is still open, blood flow to the aorta that is distal to the narrowing is still possible. However, when the duct closes after the first few days of life, a severe and life-threatening hypoperfusion of the lower body occurs due to reduced flow through the descending thoracic aorta. Without intervention, infants may not survive past the neonatal period because, as the duct closes, the left ventricle (main pumping chamber in the heart) is required to pump against the very high pressure drop given by the coarctation and so it fails because of excessive afterload (Figure 1.4).
Figure 1.4 Hemodynamic of aortic coarctation before (left panel) and after (right panel) duct closure. Adapted
7 Instead postductal coarctation usually presents after the neonatal period [10]. The very high hydraulic resistance given by the coarctation makes it difficult for the blood to get beyond the narrowed area and so a collateral flow starts to develop gradually in order to carry blood to the descending thoracic aorta and thus avoid hypoperfusion of the lower body. Collateral vessels involved in aortic coarctation include internal thoracic arteries, intercostal arteries, and subscapular arteries [10]; all these vessels originate from the left subclavian artery and drain into the descending aorta downstream the coarctation (Figure 1.5).
Figure 1.5 Diagrammatic representation of the common routes of collateral circulation that develop in
association with postductal coarctation of the aorta. Adapted from [12].
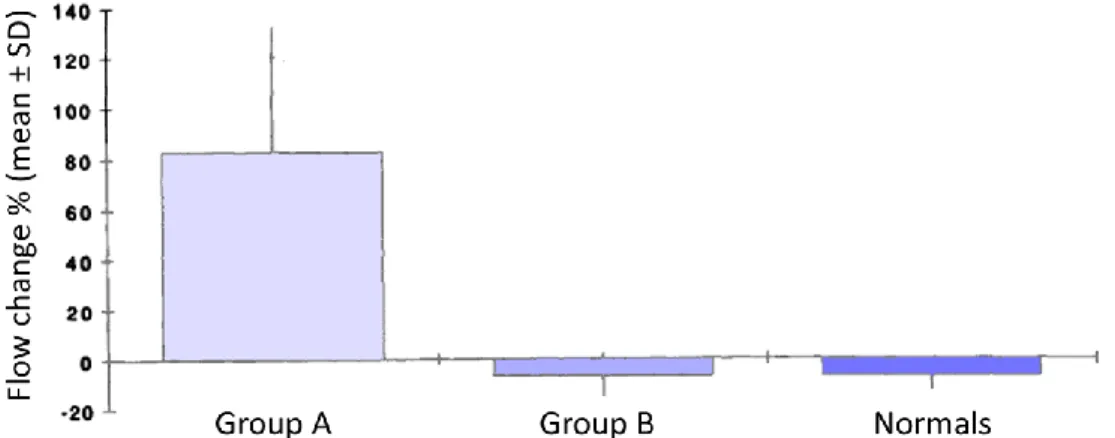
The extent of the collateral blood flow has been found to vary between patients according to the severity of the coarctation stenosis. A study of the Department of Radiology, University of California, San Francisco [13] found that the flow in the distal descending thoracic aorta was similar to the flow in the proximal descending thoracic aorta in healthy people and patients with mild coarctation (meaning that there was not so much collateral blood flow in patients with mild coarctation), while there was a significant flow change between the two regions in patients with severe coarctation (i.e., those patients that had a pressure gradient of > 20 mmHg across the coarctation as measured by Doppler echocardiography or a pressure gradient of > 25 mmHg between the right arm and the right leg as measured by cuff
8 sphygmomanometer). Patients affected by severe CoA showed an increase of 83 ± 50% in flow from upstream to downstream the coarctation due to the presence of collateral vessels (Figure 1.6). Values were obtained by means of velocity encoded cine magnetic resonance imaging (VENC-cMR) on two slices located downstream the take-off of the left subclavian artery and above the diaphragm.
Figure 1.6 Flow changes from the proximal to the distal aorta for patients with moderate to severe coarctation
(Group A), patients with mild coarctation (Group B) and healthy people (Normals). Although there is no significant difference between group B and the normal volunteers, the flow change in group A is significantly different compared with the other two (P < 01). Adapted from [13].
Even though the collateral flow might ensure quite enough perfusion to the lower body, patients with postductal coarctation usually still display other pathological signs upon diagnosis. First of all, the resistance to blood flow related to the restriction of aorta at the coarctation level and also to the low diameters of collateral vessels forces the heart to work harder to keep up with the peripheral demand; this leads to:
• systemic hypertension in the upper part of the body, which is perfused by the three supra-aortic vessels that are upstream from the coarctation. That’s why typical symptoms of CoA are a systolic arm-to-leg blood pressure gradient ≥ 20 mmHg by cuff sphygmomanometer and a diminished femoral arterial pulse [10].
• ventricular hypertrophy: the walls of the ventricle thicken to cope with the increased wall stresses given by systemic hypertension.
Increased pressure upstream from the coarctation leads to higher cerebral pressure and blood flow, which are associated with a higher risk of aneurysms. A clinical study at the Bristol Heart Institute [14] showed that 10.3% of 117 patients affected by CoA had an intracranial aneurysm (IA), while in the general population the prevalence of IAs is around 2.3%. In conclusion, patients with postductal coarctation typically present later in adult life with
9 hypertension, intracranial hemorrhage secondary to intracranial aneurysms, left ventricular hypertrophy, and subsequently congestive heart failure [10].
1.2.3 Diagnosis of CoA
Since infants with preductal coarctation becomes symptomatic upon ductus closure in the first few days of life, diagnosing CoA is usually related to postductal coarctation. Various techniques are available, from the more traditional sphygmomanometer to assess the systolic arm-to-leg pressure gradient to the more recent and sophisticated imaging modalities (e.g. magnetic resonance, Doppler echocardiography, etc.), which can give information not only about the morphology of the aorta but also blood velocity data that can be useful to compute the pressure drop at the coarctation site [10, 15].
The gold standard to assess the pressure drop across the coarctation segment is cardiac catheterization [10]. It consists in the insertion of a catheter equipped with pressure transducers in the aorta to measure blood pressure locally in the vessel of interest. It can also be paired with catheter-based angiography for morphologic evaluation of the aorta. Even if quite accurate, cardiac catheterization is nowadays mainly limited to treatment rather than diagnosis because it is very invasive and not free from potential complications such as infection and bleeding at catheter insertion site, damage to blood vessels and heart attack caused by catheter-induced blood coagulation [10].
A less invasive method to diagnose CoA is Doppler echocardiography, which is usually used as first screening in case of suspected CoA. It uses high frequency sound waves to create an anatomical image, while the use of Doppler technology allows for determining the speed and direction of blood flow by utilizing the Doppler effect. The pressure difference across the CoA can be later estimated from the peak velocity magnitude acquired along the direction of the ultrasound beam through a simplified Bernoulli equation [16]. Drawbacks of this technique are the poor imaging window in some patients, the long distance between the probe and the CoA region, the dependency on operator’s ability, the difficult evaluation of the extent of the collateral circulation and the strong mathematical assumptions that are necessary to apply the simplified Bernoulli equation (i.e., neglection of transient effects and viscous losses) [10].
A higher anatomic detail of the aorta and the collateral vessels can be obtained through computed tomography (CT), the non-invasive imaging modality with the highest resolution
10 at current date. CT main drawbacks are the use of ionizing radiations and the absence of information about blood’s velocity or pressure drops [16].
Nowadays the most promising non-invasive imaging technique to diagnose CoA seems to be magnetic resonance imaging (MRI), which has the advantage to be ionizing radiation-free. In addition to anatomic imaging (from which assessment of the areal reduction given by the stenosis can be made), information about blood velocity (and, by successive mathematical elaboration, about the difference in blood pressure between two aortic cross-sections [17]) can be acquired with phase-contrast imaging [10, 15]: time-resolved velocity-encoded 3D phase contrast MRI (commonly known as “4D-flow MRI”) will likely become the imaging technique of choice for CoA diagnosis [18].
1.2.4 Treatment of CoA
It has been found that, if left untreated, up to 90% of patients with CoA will die before 50 years of age as a result of acute or chronic heart failure, bacterial endocarditis, aortic rupture, intracranial hemorrhage, hypertension, or valvar heart disease [11]. That’s why the American College of Cardiology and American Heart Association guidelines for adults with congenital heart disease recommend intervention in the following cases [19]:
1. peak-to-peak coarctation gradient ≥ 20 mm Hg.
2. peak-to-peak coarctation gradient < 20 mm Hg, but presence of anatomic imaging evidence of significant coarctation with radiological evidence of significant collateral flow.
CoA may be treated either via surgical repair or via endovascular stent placement. In the case of native CoA, newborns and young children are typically treated surgically (due to the impossibility of metal stents to accommodate the child’s growth), while in adults the appropriate treatment remains somewhat controversial [20]. In the case of recurrent CoA (restenosis after successful surgical intervention likely caused by an excessive and ultimately obstructive healing [11]; it can occur in up to 10% of older children or adults [20]), catheter-based intervention (balloon or stent) is generally preferred [20].
The most common surgical repair techniques are the resection of the coarcted segment followed by end-to-end anastomosis and the subclavian flap arterioplasty (i.e., the use of the subclavian artery to produce a flap to enlarge the constricted part of the aorta) (Figure 1.7). Main problems of the open surgical repair are the high restenosis rate and the short lifespan
11 after surgery (between 35 and 50 years) due to significant morbidity from aneurysm formation, hypertension and stroke [21].
Figure 1.7 Surgical repair techniques for CoA. Upper panel: resection of coarcted segment followed by
end-to-end anastomosis. Lower panel: subclavian flap arterioplasty. Adapted from [22].
A valid alternative today seems to be the endovascular treatment, whose aim is to decrease the gradient across the coarctation site in a minimally invasive fashion, thus reducing the recovery time and the costs with respect to the surgical approach. This is done by re-establishing an acceptable vessel diameter at the CoA site through a stent that is implanted in the aorta at the coarctation site by means of a catheter-guided expandable balloon: the stent dilates the aorta and opposes the recoil of the vessel thus preventing recoarctation. However, there is still no agreement for the optimal balloon size that has to be used to expand the endovascular stent: balloon diameters have been based either on the ascending aorta diameter, the transverse arch diameter, the isthmus diameter (the isthmus is the part of the aorta just distal to the origin of the left subclavian artery at the site of the ductus arteriosus), the descending aorta diameter just distal to the coarctation or at the level of the diaphragm, or some combination of the previous diameters [11].
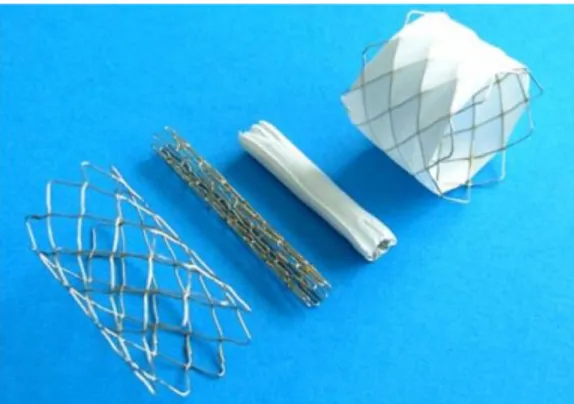
12 1.2.5 The Cheatham-Platinum (CP) stent and the Balloon-in-Balloon (BIB) catheter One of the most used stents for the endovascular repair of native or recurrent CoA is the Cheatham-Platinum (CP) stent, a platinum/iridium stent produced by NuMED (Hopkinton, New York). It is composed of a platinum/iridium wire arranged in a “zig” pattern, laser welded at each joint and then over brazed with gold [23]. The 8-zig configuration allows free-expansion from 12 mm to 24 mm starting from an initial inner diameter of 4 mm [23]. There are several available lengths (from 16 to 45 mm in the unexpanded configuration) and clinicians are recommended to choose the optimal length that allows the stent for extending slightly proximal and distal to the stricture once expanded. Therefore, clinicians are provided by NuMED with foreshortening charts in which the final length of the stent is reported as function of the initial length and the inflated diameter. The CP stent is available also in a version covered in its entire length with an expandable sleeve of ePTFE (Figure 1.8), whose aim is to prevent hemorrhage in case of aortic wall injury (i.e., a vessel tear during stent’s expansion, reported between 1.0% and 4.1% of bare-metal stent implantations [20]).
Figure 1.8 Various versions of the CP stent in unexpanded and expanded configurations. From left to right:
expanded bare CP stent, unexpanded bare CP stent, unexpanded covered CP stent, expanded covered CP stent. Adapted from [24].
Both the bare and the covered CP stents come in unmounted and pre-mounted configurations. The pre-mounted configuration is the CP Stent mounted on a BIB Catheter (Numbed, Hopkinton, New York); it has the advantage to save the physician the time required to manually crimp the stent on the catheter (an action that has to be performed in case of unmounted stents) and so it also avoids the risk of bending or twisting the stent by mistake, a risk that is always present during manual crimping procedures [23].
The BIB (Balloon-in-Balloon) Catheter is a triaxial stent placement catheter that NuMED recommends using together with the CP stent. Two lumens are used to inflate the balloons
13 while one lumen is for tracking over a guidewire (Figure 1.9). The inner balloon is half the outer balloon in diameter and it is1 cm shorter; the outer-balloon is available in sizes from 12 mm to 24 mm (these values refer to the outer-balloon diameter at its maximum free expansion, i.e., at rated burst pressure, RBP): it’s up to clinicians to decide the balloon’s size according to the final diameter desired at the CoA level. The purpose of the double balloon catheter is to apply an incremental inflation and so obtain a more uniform opening of the stent along its length. The inner balloon provides initial expansion of the stent and it acts as a tool to hold the stent in place while the outer balloon is inflated. The outer balloon is then inflated securing the stent against the vessel wall (Figure 1.10) [25].
Figure 1.9 Expanded CP stent on a BIB catheter. Inner and outer balloons are highlighted in different colors.
Figure 1.10 Schematic drawings of the implantation of a covered CP stent by means of a BIB catheter. From
top left to bottom right: pre-operative situation; positioning of the CP stent; inflation of the inner balloon;


![Table 1.3 Vascular measurements and indices in CoA patients and controls. Adapted from [31]](https://thumb-eu.123doks.com/thumbv2/123dokorg/7500236.104449/42.893.129.790.878.1091/table-vascular-measurements-indices-coa-patients-controls-adapted.webp)