p o l i t e c n i c o d i m i l a n o Facoltà di Ingegneria
Scuola di Ingegneria Industriale e dell’Informazione Dipartimento di Elettronica, Informazione e Bioingegneria
Master of Science in
Computer Science and Engineering
Anomaly Detection System for Automotive
CAN using LSTM Autoencoders
Supervisor:
p r o f. stefano zanero
Assistant Supervisor: s t e f a n o l o n g a r i
Master Graduation Thesis by: d a n i e l h u m b e r t o n ova va l c á r c e l Student Id n. 814247
C O N T E N T S
Abstract xi
1 i n t r o d u c t i o n 1
1.1 Motivations 2
1.1.1 Vehicles as targets for cyber attacks 2
1.1.2 Countermeasures 3
1.2 Proposed Approach 4
1.3 Contributions 6
1.4 Structure of the work 7
2 t h e c o n t r o l l e r a r e a n e t w o r k 9
2.1 Introduction 9
2.2 Overview of CAN in automotive 9
2.2.1 CAN packets 11
2.2.2 OBD 13
2.3 Preliminary analysis of CAN traffic 14
2.3.1 Data collection 14
2.3.2 Dataset 14
2.3.3 Data Characteristics 15
2.4 Finding structure in CAN data 20
2.4.1 Field Identification Algorithm 21
3 t h r e at m o d e l & related work 25
3.1 Introduction 25
3.2 Threat Model 25
3.2.1 Overview of vulnerabilities 25
3.2.2 Attacks on the CAN bus 27
3.2.3 Modeling attacks 29
3.2.4 Defining the threat model 30
3.2.5 Summary of the anomalies 31
3.3 State of the art and related works on detection systems
for CAN 32
3.3.1 Patterns used for detection 32
3.3.2 Specification-based detection. 34
3.3.3 Frequency/time-based detection. 34
3.3.4 Signal characteristics-based detection. 36
3.3.5 Data anomaly detection. 37
3.3.6 Data sequence anomaly detection. 37
3.4 Recurrent Neural Networks 39
3.4.1 Long Short-Term Memory 40
3.4.2 Autoencoders 41
3.5 RNNs in multivariate time-series anomaly detection 43
3.5.1 Prediction-based detection 43
3.5.2 Reconstruction-based detection 44
4.1 Introduction 45
4.2 Approach Overview 45
4.3 Performance scores 47
4.3.1 ROC and AUC 48
4.4 Prediction-based detection 48
4.4.1 Model Architecture 49
4.4.2 Output Processing and anomaly signal 53
4.5 Autoencoders-based detection 54
4.5.1 Model Architecture 56
4.5.2 Training 59
4.5.3 Anomaly signal processing 62
4.6 Detectors evaluation 64 5 e va l uat i o n 67 5.1 Introduction 67 5.2 Experimental setup 67 5.3 Experimental data 68 5.3.1 Data Preprocessing 69 5.4 Model training 70 5.5 Post-processing 70 5.5.1 Predictor post-processing 70 5.5.2 Autoencoder post-processing 71
5.6 Anomaly tests results 72
5.6.1 Defining the test sequences 72
5.6.2 Simulating anomalies 72
5.7 Anomaly results 73
5.8 Anomaly Scenario 1: General sequence anomalies 73
5.8.1 Interleave 73
5.8.2 Discontinuity 74
5.8.3 Reverse 75
5.8.4 Caveats 76
5.9 Anomaly Scenario 2: Targeting fields 76
5.9.1 Overall results 76
5.9.2 Influence of the anomaly function 79
5.9.3 Influence of field variability 80
5.9.4 Influence of duration 80
5.10 Observations on poorly performing contexts 81
5.11 Summary 83
6 c o n c l u s i o n s a n d f u t u r e w o r k 85
6.1 Process review 85
6.1.1 CAN data 85
6.1.2 Predictor replication 86
6.1.3 Implementation of the autoencoder-based
de-tector 86
6.1.4 Detection performance 87
6.2 Contributions 88
b i b l i o g r a p h y 91
a i d e n t i f i e d f i e l d s 99
b d ata f i e l d a n o m a ly d e t e c t i o n r e s u lt s 103
b.1 AUC results 103
L I S T O F F I G U R E S
Figure 2.1 Example of a Controller Area Network (CAN)
network with two nodes connected using
CAN-High (CAN-H) and CAN-Low (CAN-L). 10
Figure 2.2 Control architecture of a Volvo XC90, network
segmentation is present to separate different
components. Taken from [27]. 11
Figure 2.3 CAN Data Frame. 12
Figure 2.4 Example of individual recordings of CAN
traf-fic data of an Alfa Giulia Veloce vehicle. 14
Figure 2.5 Data Length Code (DLC) usage in our CAN
recordings dataset. 15
Figure 2.6 Packet counts by Identifier (ID), from a sample
of the CAN dataset. 17
Figure 2.7 Estimated frequencies for all IDs in the CAN
dataset. The x-axis represents the different IDs,
and the y-axis the estimated frequency. 18
Figure 2.8 Symbol creation rate for four CAN IDs. 20
Figure 2.9 Bit average values for a single CAN IDs. 21
Figure 3.1 On-Board Diagnostics (OBD) Bluetooth
Don-gle by Continental used to transmit telematics
data (available at:https://www.continental-automotive.
com/en-gl/Trucks-Buses/Interior-Cabin/Tachographs, -Telematics-Services/Tolling-Telematic-Solutions/
Telematics/OBD-BT-Dongle) 28
Figure 3.2 Categories of anomaly detection systems for
CAN. 33
Figure 3.3 Unfolding a Recurrent Neural Network (RNN).
Figure taken from [20]. 39
Figure 3.4 Structure of a LSTM in a network. 41
Figure 3.5 LSTM calculation flow, not including bias terms.
Taken from [1] 42
Figure 3.6 General structure of an autoencoder. An input
xis represented as a space h through function
f(x), and then it is reconstructed to output r
using function g(h). 42
Figure 3.7 Simplified architecture of a stacked recurrent
neural network predictor with LSTM units. 44
Figure 4.1 Example of a Receiver Operating
Characteris-tic (ROC) curve showing Area Under the Curve
Figure 4.2 Overview of a predictor-based CAN anomaly
detection system. 50
Figure 4.3 Structure of the prediction-based anomaly
de-tector for CAN proposed by Taylor et al. 51
Figure 4.4 Overview of the autoencoder-based ADS. 55
Figure 4.5 Overview of the Encoder-Decoder model
pro-posed by Malhotra et al., taken from [38] 57
Figure 4.6 Training loss with a validation dataset for a
random ID using Malhotra’s encoder-decoder model. The model overfits because of the lack
of regularization. 58
Figure 4.7 Reconstruction error during training for the deep
autoencoder model. 58
Figure 4.8 General architecture of the autoencoder. The
dashed lines indicate that the decoder input is set to the previous reconstructions only dur-ing traindur-ing. Otherwise use a 0-vector. P corre-sponds to the number of sequences used only
during training. 60
Figure 4.9 Autoencoder model 61
Figure 4.10 Anomaly score distribution for test sequences
with normal data. 64
Figure 4.11 Anomaly score distribution for test sequences
with an interleave anomaly. 64
Figure 4.12 Anomaly score distribution for test sequences
with a replay attack targeting a high variability
field. 65
Figure 5.1 Average AUC per ID for all data field
anoma-lies. 77
Figure 5.2 AUC results for ID 1FB. The x-axis indicates
the parameters for each test as specified in
Sec-tion5.6.2 78
Figure 5.3 Overall detection AUC, grouped by anomaly
function and variability. The first letter stands for the target field variability (Low, Medium, and High), and it is followed by the anomaly
function. 81
Figure 5.4 Overall detection AUC, grouped by variability
and duration. The first letter stands for the tar-get field variability (Low, Medium, and High), and it is followed by the anomaly duration in
seconds. 82
Figure B.1 AUC results for ID 0DE. 106
Figure B.2 AUC results for ID 0EE. 107
Figure B.3 AUC results for ID 0FB. 108
Figure B.5 AUC results for ID 0FE. 110
Figure B.6 AUC results for ID 0FF. 111
Figure B.7 AUC results for ID 1F7. 112
Figure B.8 AUC results for ID 1FB. 113
Figure B.9 AUC results for ID 11C. 114
Figure B.10 AUC results for ID 100. 115
Figure B.11 AUC results for ID 104. 116
Figure B.12 AUC results for ID 116. 117
L I S T O F TA B L E S
Table 2.1 Number of bits used for each ID as set in its
DLC field, and how many of those bits are
non-constant in our dataset. 16
Table 2.2 Classification of IDs according to their estimated
frequency (in seconds) for our dataset. 19
Table 2.3 Classification of IDs according to their unique
symbol count in the CAN dataset. 19
Table 2.4 Resulting field division from the field
identi-fication algorithm by Markovitz and Wool. It consists of a list of disjoint fields for a single
CAN ID. 23
Table 4.1 Definitions of the results in a binary
classifica-tion task. 47
Table 4.2 Definitions of true positive and false positive
rate, performance metrics for classification tasks. 47
Table 5.1 Symbol score and combination results for
ev-ery ID.. 71
Table 5.2 Interleave anomaly AUC for all IDS. 74
Table 5.3 Discontinuity anomaly AUC for all IDS. 74
Table 5.4 Reverse anomaly AUC for all IDS. 75
Table 5.5 Average AUC results for all data field
anoma-lies across all IDs 76
Table 5.6 AUC difference between detectors for all data
field anomalies. A negative value indicates the
predictor performs better. 77
Table 5.7 Overall AUC of the detectors grouped by anomaly
function. 79
Table 5.8 Overall data field AUC anomaly results divided
by field variability. 80
Table 5.9 Overall detector AUC anomaly grouped by
Table 5.10 AUC results grouped by anomaly duration and target field category. Blank cells indicate that a relevant field does not exist. P stands for the predictor results, and AE. stands for the
au-toencoder results. 82
Table A.1 List of identified fields for ID 0FF 99
Table A.2 List of identified fields for ID 0DE 99
Table A.3 List of identified fields for ID 1FB 100
Table A.4 List of identified fields for ID 1FB 100
Table A.5 List of identified fields for ID 100 100
Table A.6 List of identified fields for ID 0EE 100
Table A.7 List of identified fields for ID 0FE 101
Table A.8 List of identified fields for ID 101 101
Table A.9 List of identified fields for ID 0FB 101
Table A.10 List of identified fields for ID 104 102
Table A.11 List of identified fields for ID 116 102
Table A.12 List of identified fields for ID 11C 102
Table A.13 List of identified fields for ID 0FC 102
Table B.1 AUC results grouped by variability (low and
medium) and anomaly function. Blank cells
A B S T R A C T
Automotive security has gained significant traction in the last decade thanks to the development of new connectivity features that have brought the vehicle from an isolated environment to an externally facing domain. A vehicle has several embedded Electronic Control Units (ECUs), these are sensors and actuators used from simple tasks to safety-critical systems. Controller Area Network (CAN) is the de-facto protocol to communicate these ECUs, it has proven to be ef-ficient, however, it presents several drawbacks in this new intercon-nected scenario. Researchers have presented vulnerabilities on ECUs, infotainment systems, and telematics units that can be exploited to gain access to the CAN bus. With access to the bus, an attacker can interfere with the normal flow of information, effectively altering the state of the car and putting the safety of drivers and others at risk.
To detect these attacks, security experts and researchers have pro-posed several countermeasures, including the use of Intrusion Detec-tion Systems (IDSs) which make for a great part of the published research. Given the pervasiveness of CAN and the infeasibility of changing the protocol, IDSs provide a tool to analyze CAN traffic that does not interfere with the regular operation of the bus.
In this work, propose a data sequence anomaly detection approach that uses Long Short-Term Memory (LSTM) autoencoders. These mod-els learn to reconstruct sequences using exclusively normal CAN traf-fic data. Our system uses the difference between reconstructions and real sequences to create a distribution of reconstruction errors, which describe legitimate traffic behavior. Using a set of simulated attacks, we demonstrate that sequence anomalies effectively alter this distri-bution and can be used for detection. We demonstrate that LSTM autoencoders are on average more effective at detecting anomalies on CAN data than the current state-of-the-art LSTM predictor-based de-tector; we run our anomaly tests on both detectors using a real-world dataset and the same experimental framework.
S O M M A R I O
L’ambito della sicurezza informatica in campo automobilistico ha rice-vuto una crescente attenzione dagli esperti e ricercatori nell’ultimo decennio. Ciò è dovuto agli sviluppi di nuove interfacce di comuni-cazione che hanno portato il veicolo dall’essere un ambiente isolato ad un dominio che si interfaccia con reti esterne. Ogni veicolo ha diversi sistemi embedded chiamati unità di controllo elettronico (o ECU). Queste centraline sono composte da sensori e attuatori che controllano diverse funzionalità, da quelle semplici come il controllo dei climatizzatori, a quelle critiche per la sicurezza come i sistemi anti bloccaggio dei freni. Diversi sistemi richiedono i dati forniti da più ECU, che pertanto devono essere collegate tra di loro. Il protocollo standard che collega tra di loro queste ECU all’interno del veicolo è chiamato Controller Area Network (CAN). CAN ha dimostrato di es-sere un protocollo efficiente che permette la comunicazione in tempo reale, tuttavia non è stato progettato tenendo conto dei requisiti di sicurezza informatica, non essendo prevedibile all’epoca l’inclusione, nel veicolo, di interfacce con sistemi esterni.
Le vulnerabilità delle ECU sono state illustrate da diversi lavori di ricerca. È stato per esempio dimostrato che i sistemi infotainment o le unità di telematica possono essere utilizzate per ottenere accesso alla rete CAN. Ottenuto l’accesso, un attaccante può alterare il normale funzionamento delle ECU all’interno del veicolo, e quindi mettere a rischio la sicurezza delle persone attorno al veicolo.
Diversi metodi sono stati proposti per rilevare i potenziali attac-chi. Tra questi, l’uso di Intrusion Detection System (IDS) è quello sostenuto dalla maggior parte dei ricercatori ed esperti di sicurezza. Una delle principali problematiche dell’uso di IDS in campo automo-bilistico è che questi sistemi devono essere progettati per individuare attacchi, ma non è possibile ottenere esempi documentati di attac-chi avvenuti realmente, si possono solo generare attacattac-chi in labora-torio. Questa limitazione forza l’utilizzo di Anomaly Detection Sys-tem (ADS), che funzionano creando un modello di riferimento che rappresenta il comportamento normale del sistema, in modo che qual-siasi deviazione da questo modello possa essere considerata come una anomalia.
Nello stato dell’arte si trovano degli ADS per sistemi automotive che monitorano la frequenza dei messaggi, le caratteristiche fisiche dei segnali delle ECU, oltre che le sequenze di dati CAN. Analizzare sequenze di dati ci permette di rilevare anomalie che possono passare inosservate con altri metodi. Molti ADS di questo tipo usano metodi di machine learning per creare i modelli di riferimento, tra i quali ci sono le recurrent neural networks con Long Short-Term Memory
(LSTM). Tra questi metodi si trovano gli autoencoders, una tecnica di apprendimento non supervisionato che permette di generare una rappresentazione compatta di sequenze di input. Questo tipo di reti neurali ci permette di creare un modello del meccanismo generatore dei dati, che impara a ricostruire le sequenze.
In questa tesi proponiamo un metodo di anomaly detection in se-quenze di dati CAN usando LSTM autoencoders. Questi vengono allenati usando traffico CAN di un veicolo reale, senza bisogno di es-empi di attacchi. Il nostro sistema usa la differenza tra le ricostruzioni e le sequenze reali per generare una distribuzione degli errori di ri-costruzione, che descrive le caratteristiche del traffico in condizioni non-anomale.
Paragonando la distribuzione degli errori in condizioni normali con le distribuzioni ottenute con sequenze anomale simulate, dimos-triamo che le seconde sono significativamente diverse rispetto alle prime. Questa differenza ci fornisce la base su cui creare un mecca-nismo che distingua sequenze anomale. Dimostriamo mediante es-perimenti con dati CAN di un veicolo reale, condotti con gli stessi parametri sperimentali, che gli LSTM autoencoders sono in media più efficaci nel rilevamento di anomalie dei modelli di predizione su reti LSTM, che sono l’attuale stato dell’arte.
1
I N T R O D U C T I O N
The automotive industry has seen gigantic growth in the last thirty years due to the rapid development of new hardware and software components that are embedded to improve efficiency, reliability, and more user-experience oriented features; this phenomenon was driven by many factors including environmental and safety regulations, but also out of market necessity. Before this change vehicles were mainly mechanic, they included a small amount of networked electronic com-ponents used to display data on the dashboard and to execute simple tasks. Nowadays, we can find up to a hundred connected Electronic Control Units (ECUs) in a modern vehicle. These embedded systems control most of the vehicle’s functionalities from simple tasks such as opening or closing the windows, to safety critical components like the engine control units, anti-lock braking systems, airbag deploy-ment, accessing diagnostics data, etc. Many of the vehicle systems de-pend on signals produced by other ECUs and, consequently, units are required to communicate in an efficient manner due to the safety re-quirements implied by the automotive system. To interconnect these units, in 1986 Robert Bosch Gmbh presented the CAN bus
specifica-tion [6], a simple but efficient solution to the problem of
interconnect-ing ECUs that meets the requirements for real-time communication and low deployment costs. CAN is considered as the de-facto
stan-dard in automotive internal networks even to this day [4] and is also
commonly found in other industrial applications.
Although the introduction of new features strongly improves safety and driving experience, they have also expanded the attack surfaces exploitable by potential malicious agents. In order to mitigate these new threats we must tackle a dual-faced problem: on one we have to manage systems that were not designed with cybersecurity in mind, on the other side these cannot be easily replaced or updated given their pervasive use and the complexity of the automotive supply-chain; each manufacturer buys components from several providers which also depend on other suppliers and so on, therefore patch-ing or substitutpatch-ing specific components can be an impractical or pro-hibitively expensive task.
This new scenario, consisting of new potential threats and systems that are difficult to adapt, has caused an increased attention to auto-motive security. In the last decade, a significant amount of research work on automotive security has been published, and the attention on the topic has been steadily increasing ever since. Shortly after automotive security became an novel and interesting topic, new
re-2 i n t r o d u c t i o n
search was published demonstrating vulnerabilities and
experimen-tal attacks on controlled laboratory environments [32, 8, 24].
Inter-est from the academia and from security experts grew rapidly after researchers presented attacks carried out in real vehicles, catching
attention from the industry and media outlets as well [22, 43, 44].
Countermeasures and Intrusion Detection Systems (IDSs) proposals for vehicles immediately followed applying the vast knowledge of the computer security field to the automotive world.
Intrusion Detection System (IDS) monitor the events in a computer system or network for signs of intrusions In the context of automo-tive security, we adopt a definition of intrusion that carries the great-est risk, which refers to malicious agents that have gained access to the CAN bus. IDS can be classified depending on the methodology they follow: signature-based, specification-based, and anomaly-based
intrusion detection [35]. Signature and specification-based detection
systems assume the knowledge of known attacks and of a strict de-scription of the protocol; however, this information is not available since databases with attack data on CAN in real world scenarios are not yet available, and specifications on the signals generated by ECUs
are generally not available [60]. Because of the lack of attack
exam-ples, a specification-based IDS is no longer a suitable solution. In-stead, ADS attempt to characterize normal traffic data and deviations from this norm are considered anomalous and have been proposed
for CAN security applications [48].
In this chapter, we begin by introducing the motivations behind the need for anomaly detection on automotive networks, specifically on the CAN bus. We then introduce an overview of the countermeasures that have been proposed to make the bus more secure. Next, we out-line our proposal for the problem of anomaly detection. Finally, we briefly summarize our contributions and define the outline for this thesis.
1.1 motivations
1.1.1 Vehicles as targets for cyber attacks
The introduction of remote telematic units, Internet-connected info-tainment systems, and Bluetooth interfaces have brought to the au-tomotive market new and interesting connectivity features, but they have also brought the CAN bus to a connected domain where it is no longer an isolated network. These new externally-facing interfaces turn the vehicle into a potential target for cyber attacks. CAN was not designed with cybersecurity considerations in mind since connecting the bus to external interfaces was not considered a possibility at the time of its conception, hence the priorities at the time pushed towards following real-time system requirements and cost minimization. With
1.1 motivations 3
a lack of authentication, encryption, and access control mechanisms,
the protocol has a significant number of inherent weaknesses [32]. A
combination of new external interfaces, the drawbacks of the proto-col, and even oversight by some manufacturers, have given security researchers the tools to successfully compromise devices connected to the CAN bus, giving them control of the bus and in consequence effectively altering the state of the vehicle.
These security issues have been exploited by security researchers to prove the feasibility of attacks. The publication of the most notable
attacks presented by Checkoway et al. [8] and Miller and Valasek [43,
42, 44] demonstrated the feasibility to carry out attacks on vehicles
under real operating circumstances, this served as a concrete proof of the need for cybersecurity on vehicles. And with this, automotive cybersecurity stopped being just a theoretical possibility and turned into a real concern.
To carry out an attack, one of the most crucial steps for an attacker is successfully gaining access to the CAN bus. Once they are able to read and transmit messages they can potentially control most of the vehicle functionality including, but not limited to, controlling the steering wheel, brakes, speed, airbag deployment, Anti-Lock Brak-ing System (ABS), and even shuttBrak-ing down the car entirely. For that reason guaranteeing the correct operation of the vehicle and its com-ponents is a safety-critical task. Any malicious alteration can lead to life-threatening situations not only for the driver and their passengers, but also to surrounding vehicles, pedestrians, infrastructure, the en-vironment, and more. Additionally, the prospect of autonomous cars on the streets have created a greater demand to enhance automotive
cybersecurity [69].
1.1.2 Countermeasures
Along with the relatively new importance given to automotive cy-bersecurity, researchers and security experts have proposed new de-tection systems and countermeasures to mitigate potential attacks. These include enhancing the protocol, tools to verify specification-compliance, ECU fingerprinting, and Intrusion Detection Systems (IDSs). Some of the proposals to enhance the CAN protocol include
introduc-ing authentication [71,55]. However, altering the protocol itself is not
considered feasible as it would require significant modifications on how the existing networks operate; leading to the non-trivial task of managing firmware patches across millions of existing vehicles and across complex manufacturer supply chains. In consequence, this leads to issues with the inclusion of authentication, encryption, and similar mechanisms used in traditional computer networks, as they would require modifications of the protocol itself.
4 i n t r o d u c t i o n
IDSs instead do not require protocol alterations and they do not in-terfere with regular communication over CAN at all. They can be im-plemented on a single unit purposed exclusively for detection, and, as a result, backward compatibility would not be an issue. Additionally, costs are significantly mitigated with respect to patching firmware for dozens of ECUs per vehicle. These considerations render IDSs an appropriate and feasible security mechanism.
Initially, research on CAN-based detection systems focused on ana-lyzing the frequency of messages transmitted on the bus, this choice was supported by the fact that most CAN traffic is periodic and be-cause most attacks tend to alter the frequency at which messages appear on the bus. However, these proposals fail to detect scenarios where an attacker is able to mimic the correct frequencies and is still able to inject malicious data.
Another approach focused on attempting to create ECU
finger-prints, providing a pseudo-authentication mechanism [12,11,9];
how-ever, some proposals have been deemed inadequate in real operating circumstances, and others have been successfully bypassed by
follow-ing research work [57].
Inspired by the extensive research on time-series anomaly analy-sis, researchers have developed IDSs that use machine learning algo-rithms to detect anomalous sequences in data streams, even in auto-motive applications. In this framework, only sequences of data are analyzed, looking for suspicious contents that may signal an attack. The main goal of this approach is to find anomalies in streams of data, caused by contextual inconsistencies in sequences or by anoma-lous data points; this implies that it is indispensable to model what characterizes normal/legitimate traffic.
Understanding the meaning of CAN signals is a crucial step when evaluating what is the most appropriate approach. Knowing the data generating mechanism and its semantics is useful when defining what differentiates legitimate and suspicious messages. However, databases that specify these semantics are usually kept confidential by vehi-cle and ECU manufacturers, forcing researchers to look for alterna-tive approaches to process these signals. In consequence, develop-ing semantics-unaware systems is an unfortunate but unavoidable requirement.
1.2 proposed approach
RNNs are considered good modelers for time-series data [1]. They
have been proposed as a solution for anomaly detection problems, showing promising results even in semantics-unaware scenarios. Ad-ditionally, they are considered a natural fit when dealing with
mul-tivariate time-series (as is the case of CAN) [67]. Anomaly detectors
nor-1.2 proposed approach 5
mal behavior of a time-series, and any deviation from such model is considered anomalous. In the context of intrusion detection this can signal an attack.
One of the main advantages of RNNs is that they learn to model sequences of data rather than isolated observations. This allows us to detect anomalies from single data points outside the normal data distribution, and, most importantly, from data that is anomalous in the context of other observations. Such context is defined as sequen-tial data, just like a time-series. Classical RNN units are rarely used in practice because they struggle with learning long sequence dependen-cies, this problem is caused by an uncontrolled growth or shrinkage of its gradients . Instead, these networks normally use Long Short-Term Memory (LSTM) units, which are more complex and can learn values over arbitrary time intervals, overcoming the limitations of classic RNNs. By learning how a sequence behaves, we can also learn how to reconstruct it, that is attempting to recreate sequences based on the data seen before. This has uses in many areas, including
dimen-sionality reduction, removing noise from data [20], and even anomaly
detection.
Detection approaches that use RNNs can be divided into two cat-egories: prediction-based and reconstruction-based anomaly detection. Predictors have been used to model CAN traffic data, and have been
shown to perform well in most anomaly scenarios [67,66]. However,
this approach relies on a very strong assumption stating that CAN traffic is predictable to some extent; given the semantics-unaware con-text of our problem, this assumption has to be re-evaluated.
Alternatively, sequence reconstruction approaches have been shown to be efficient at detecting anomalies in time-series that are inherently
unpredictable [38]. Given the fact that ECUs signal semantics are
un-known to us, we deemed this approach to be a suitable choice for CAN. To our understanding, this approach has not yet been imple-mented and tested in an automotive context.
In this thesis, we present an ADS for CAN that applies a reconstruction-based approach using LSTM autoencoders. This unsupervised ap-proach learns a latent representation of CAN traffic data sequences using only normal/legitimate data. The resulting autoencoder is used to reconstruct sequences, and through this process, we compute the difference between reconstructed and real sequences. We demonstrate that in the presence of anomalies, reconstruction errors are signifi-cantly altered, thus we can utilize this error metric as a tool for de-tecting attacks. We demonstrate the effectiveness of this approach in cases where the data semantics are unknown. We compare our ap-proach with the prediction-based detector presented in previous re-search, and finally we evaluate the two detectors in the context of CAN anomaly detection.
6 i n t r o d u c t i o n
1. CAN data evaluation. We collect and analyze CAN traffic data,
and classify it based on frequency and variability. From this process, we are able to infer some structure using an algorithm proposed in the literature.
2. Simulating attacks. Since CAN traffic databases with attack
exam-ples are not available, we use simulated attack data to test our system. Such data is based on attacks presented in published work, and on threat models of previous research.
3. Predictor-based detector replication. We implement the predictor
proposed in previous research, using our own data to evaluate its performance.
4. Reconstruction models as anomaly detection mechanism. We
evalu-ate the use of autoencoders to reconstruct CAN data sequences, and propose an architecture based on our dataset.
5. Evaluation. Finally, we test the predictor and autoencoder with
the same anomalous data, evaluating and comparing their per-formance.
1.3 contributions
In this thesis, we propose a novel approach to anomaly detection of data sequences in automotive networks using LSTM autoencoders. Our autoencoder is trained to reconstruct the normal CAN traffic obtained from a real vehicle, and requires no prior availability of at-tack examples to both train the model and to fine-tune its anomaly scoring mechanism. We compare our proposal with a state-of-the-art prediction-based detector found in the literature. We show that, on average, the autoencoder outperforms the predictor under the same anomaly scenarios, demonstrating that an autoencoder can ei-ther complement the predictor in a detection system or even substi-tute it.
Our objectives for this work can be summarized as:
• Implement and evaluate the performance of the state-of-the-art LSTM predictor approach with our own data, employing the same semi-supervised approach as in the reference work.
• Assess the use of autoencoders as time-series modelers, for which we do not make any assumptions on its predictability, using a completely unsupervised approach.
• Compare both approaches using the same data for both training and anomaly testing. Evaluate their use in automotive intrusion detection.
1.4 structure of the work 7
1. The presentation a reconstruction-based approach using LSTM
autoencoders that can efficiently model normal CAN traffic.
2. The demonstration that using autoencoders in an unsupervised
detection scheme can effectively detect anomalies in CAN data under different attack scenarios.
3. Proposing the use of autoencoders as a suitable addition to
in-trusion detection systems for vehicles that can either work to-gether with predictor approaches or even substitute them.
1.4 structure of the work
This thesis is organized as follows:
In Chapter 2 we introduce the necessary background on CAN,
present a preliminary analysis of the CAN traffic data we use through-out this work, and introduce an approach to find potential structure in the data.
Chapter ?? introduces the relevant background on CAN vulnerabili-ties, an overview of the published attacks, and a review the state-of-the-art of detection systems for in-vehicle networks. We also give an overview of RNNs, LSTMs, and autoencoders. We conclude with an overview of the state-of-the-art on anomaly detection using RNNs.
Chapter 4 introduces our solution to the problem, here we describe
the threat model and define how we evaluate performance. We follow with an explanation of predictor-based detection. Then, we present an autoencoder-based detection approach. We conclude by explain-ing how these two methods are evaluated and compared.
In Chapter 5 we present the experimental setup and how we
pre-pare the data. We follow with an explanation of how we train the models and how we set up the post-processing. We continue by pre-senting the detection results, showing how detectors perform under the anomaly test scenarios.
Finally, in Chapter6we summarize our work, draw our conclusions,
2
T H E C O N T R O L L E R A R E A N E T W O R K
2.1 introduction
In this chapter we introduce the Controller Area Network (CAN), the most prevalent protocol in automotive networks, and we frame it in a cybersecurity context.
We begin by describing the protocol, including the assumptions and requirements taken into account during its design. We focus on the relevant aspects within the context of our anomaly detection prlem. We then present a preliminary analysis of CAN traffic data ob-tained from a real vehicle. This analysis is an overview of the data we use in our experiments, used to obtain insight about the behavior of the different IDs in the bus. We conclude this chapter by present-ing the field identification algorithm, used to find potential structures in CAN messages.
2.2 overview of can in automotive
CAN is a serial bus communication protocol, it defines the lowest layers of the Open Systems Interconnection (OSI) model, that is, the physical and data link layer. CAN was designed for distributed
real-time control [6], and is suitable for embedded applications and
real-time systems, providing data transfer rates up to 1Mb/s [27]. It is
widely used in industrial machinery but is most commonly known for its widespread use in vehicles internal networks. In fact, it has been used as a mandatory standard for cars manufactured in
Eu-rope since 2001, and in the United States since 2008 [60]. In
automo-tive applications, the protocol is used to connect the ECUs placed all around the vehicle. These units control several subsystems that need to exchange data to meet functional requirements while also fulfilling, among others, requirements on fault tolerance, real-time communica-tion, arbitration policies, among others.
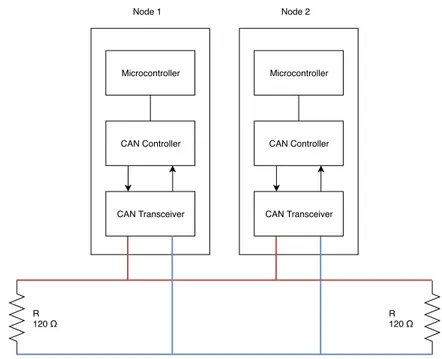
CAN runs on a fairly simple physical medium, typically consisting of two twisted-pair wires and one 120-Ohm resistance on each end of the bus for termination. The two wires are known as CAN-H and CAN-L, and they are also used as a fault tolerance mechanism. Dur-ing transmission, the bus uses differential signalDur-ing that raises the
voltage on one wire and drops it in the other [60]. Typically, buses
with two lines are exclusively used for safety-critical tasks and run at high speeds. Non-critical components typically use a simpler and cheaper single wire significantly lower speeds, e. g. air conditioning,
10 t h e c o n t r o l l e r a r e a n e t w o r k Microcontroller CAN Controller CAN Transceiver Node 1 Microcontroller CAN Controller CAN Transceiver Node 2 R 120 Ω R 120 Ω
Figure 2.1: Example of a CAN network with two nodes connected using
CAN-H and CAN-L.
door control modules. Traffic on the high-speed bus is usually char-acterized by the presence of high-frequency messages, where ECUs transmit on average every 10-20 milliseconds. Additionally, high pri-ority units tend to be very active in the network, so high-frequency messages tend to be associated with important tasks and safety-critical
modules [27], making them a higher priority when designing security
systems.
Figure2.1illustrates a simplified view of a CAN bus, where nodes
are individual ECUs with a CAN transceiver, a CAN controller, and a microcontroller.
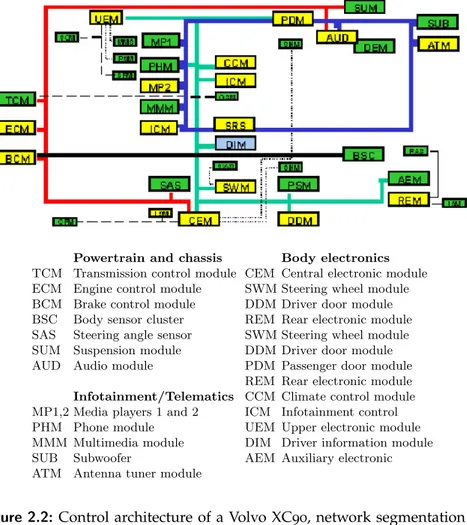
It is common to find separate buses in a vehicle, the internal net-work is usually divided into subdomains each with its own bus. This provides some network segmentation that could potentially isolate issues that occur in one of the buses. However, some components de-pend on data that is transmitted on buses from different domains; because of this, manufacturers use gateway bridges to connect
differ-ent buses [32]. For example, a Volvo XC90 has separate buses
con-necting up to 40 ECUs[27], as illustrated in Figure 2.2. In this
net-work, safety-critical control modules like the Engine Controle Mod-ule (ECM), Brake Controle ModMod-ule (BCM), and Transmission Cont-role Module (TCM) are connected to a bus running at 500 kbps. A separate network, running at 125 kbps, connects non safety-critical components like the climate control, and infotainment modules. In this vehicle, the central electronic module acts as a gateway between the two buses. Another example of network bridging can be found in
2.2 overview of can in automotive 11
12 K. H. Johansson, M. T¨orngren, L. Nielsen
Powertrain and chassis Body electronics
TCM Transmission control module CEM Central electronic module
ECM Engine control module SWM Steering wheel module
BCM Brake control module DDM Driver door module
BSC Body sensor cluster REM Rear electronic module
SAS Steering angle sensor SWM Steering wheel module
SUM Suspension module DDM Driver door module
AUD Audio module PDM Passenger door module
REM Rear electronic module Infotainment/Telematics CCM Climate control module
MP1,2 Media players 1 and 2 ICM Infotainment control
PHM Phone module UEM Upper electronic module
MMM Multimedia module DIM Driver information module
SUB Subwoofer AEM Auxiliary electronic
ATM Antenna tuner module
Fig. 7. Distributed control architecture for the Volvo XC90. Two CAN buses and some other networks connect up to about 40 ECUs. (Courtesy of Volvo Car Corpo-ration.)
are due to the fact that trucks are configured in a large number of physical variants and have longer expected life times. These characteristics impose requirements on flexibility with respect to connecting, adding, and removing equipments and trailers.
The control architecture for a Scania truck is shown in Fig. 8. It consists of three CAN buses, denoted green, yellow, and red by Scania due to their relative importance. The leftmost (vertical) CAN contains less critical ECUs such as the audio system and the climate control. The middle (vertical) CAN handles the communication for important subsystems that are not directly involved in the engine and brake management. For example, connected to this
Figure 2.2: Control architecture of a Volvo XC90, network segmentation is
present to separate different components. Taken from [27].
the 2010 Ford Escape, where the Accessory Protocol Interface Module
and the Instrument Cluster effectively bridge both [CAN] buses [43].
2.2.1 CAN packets
CAN operates as a broadcast network connecting all ECUs that com-municate on the bus, with no sender or receiver information attached. The ID, specified at the beginning of every frame, defines the mean-ing of the data bemean-ing transmitted rather than its origin. It is important to note that in the network, an ID should be exclusively sent by only one ECU, however, this is not a guaranteed and it must be taken into account when designing systems that analyze CAN packets. IDs also define the priority of messages through arbitration, which is de-termined according to the frame’s ID; with lower IDs indicating a higher priority message.
CAN provides four different kinds of frames, each with its own semantics and structure. There are the data, remote, error, and overload frames:
12 t h e c o n t r o l l e r a r e a n e t w o r k
ID
11 bits
CAN data frame
Extended ID 4 bits S O F SRR ext.ID RTR Res.
1 bit 1 bit 1 bit 2bits
DLC 4 bits 1 bit Data 0-64 bits CRC 15 bits CRC del. 1 bit A C K 1 bit ACK del. 1 bit E O F 7 bit
Figure 2.3:CAN Data Frame.
• Data frames carry data from a transmitting ECU. For example, a frame containing the steering wheel angle.
• Remote frames are used to request the transmission of a data frame, using the ID to signal which frame is needed. For exam-ple, A is the unit responsible for transmitting messages with ID
0x01, another unit B can send a remote frame with ID0x01 to
request A to send a data frame. Usually these frames are not used, as data frames are typically sent at specific time intervals. • Error frames are transmitted when a bus errors occur. For
exam-ple, when badly formed frames are transmitted.
• Overload frames signal a delay of the next data frame because the transmitting ECU is overloaded at the moment.
In the context of this thesis, we only focus on the data frame. When reading data from the bus, the CAN controller automatically handles overload and error frames, so we only record data frames. Remote frames are rarely used, so they are practically almost never seen on the bus.
As illustrated in Figure2.3, each frame is composed of the
follow-ing fields:
1. SOF, start of frame that uses a dominant bit, i.e. 0.
2. An arbitration field that can use either an 11-bit or extended
29-bit ID, depending on the protocol version in place. This field
consists of:
a) The base ID, which is 11 bits.
b) SRR, substitute remote request, typically used for extended packets.
c) IDE, Identifier extension. Set to 1 if it uses an extended ID, otherwise set to 0.
d) Extended ID, with additional 18 bits.
e) RTR, Remote transmission request. Used the message is a request frame.
3. The control field consists of 2 reserved bits followed by a DLC,
specifies how many bytes will be transmitted. Its value can vary between 0 and 8 bytes.
2.2 overview of can in automotive 13
4. Data field, the payload of the frame. It can be 8 bytes at
maxi-mum, length specified by the DLC.
5. The Cyclic Redundancy Checksum (CRC) field is used for data
integrity check. It is used by a receiver to check for possible data corruption. A CRC delimiter is set afterwards, with its bit always set to 1.
6. ACK is used as acknowledgment and is two bits long. A
trans-mitter sets these two bits as recessive bits (i.e. 1), and a receiving unit acknowledges a successful transmission by setting the first bit to a dominant bit (i.e. 0). If the ACK fails, an error frame is sent into the bus and the transmitter of the original frame must retransmit it. The ACK delimiter is always set to 1.
7. Lastly, an EOF consists of seven consecutive recessive bits,
indi-cating the end of the frame.
Additionally, data frames are separated from each other by an inter-space frame, consisting of three recessive bits. During their transmis-sion, no ECU is allowed to transmit into the bus to guarantee a mini-mal gap between frames.
t r a n s m i t t i n g pay l oa d s ov e r 8 b y t e s. In some scenarios, it
is required to transmit messages with a payload bigger than 8 bytes. The ISO-TP Protocol 15765-2 specifies the transmission of bigger pay-loads, it works by segmenting messages into multiple frames with additional meta-data, which is used to reconstruct the entire message at the receiving unit- This protocol allows a significant payload size increase summing in total 4095 bytes per packet, and is commonly
used in diagnostic tasks [18].
2.2.2 OBD
OBD is a subset of the Unified Diagnostic Services (UDS) protocol, used by manufacturers and technicians to provide services for diag-nostics, calibration, and ECU firmware management. Some diagnos-tic operations include additional security mechanisms because of the risk factors involved; a challenge-response authentication mechanism is put in place to allow any modification or access to the ECU state.
Most vehicles are equipped with an OBD port, to allow an exter-nal party to run diagnostic queries. The port is directly connected
to the CAN bus, and is usually found below the steering wheel [60].
One of the most common uses of the OBD port is to query and clear fault codes stored in some of the car modules. Routine checks are per-formed by one of the ECUs. When any subsystem encounters a fault or error, a Diagnostic Trouble Code (DTC) is stored in the Power Train Control Module (PCM), either in memory or persistent storage, and
14 t h e c o n t r o l l e r a r e a n e t w o r k
2 Data Overview
Check how many entries we have
In [2]: ## Load the data
filepath = os.sep.join(data_path + ['alfa2.csv'])
data = pd.read_csv(filepath, dtype={"Timestamp": float, "ID": str, "DLC": int, "Data": str}) data = data.iloc[:(len(data)//2)]
#Number of unique IDs
print("CAN IDs description:")
print(pd.Series(data['ID']).describe()) CAN IDs description:
count 784888
unique 76
top 0FB
freq 29725 Name: ID, dtype: object
In [3]: pd.set_option('display.max_colwidth', -1)
pd.set_option('display.float_format', lambda x: '%.5f' % x) data[['Timestamp', 'ID','Data', 'DataBin', 'DataBin_nc']].head()
Out[3]: Timestamp ID Data \
0 1549035061.89032 0FB 00121FB401000186 1 1549035061.89049 0F4 1900000000000121 2 1549035061.89073 1EF 8800000000000EDF 3 1549035061.89095 256 0000007FCC410000 4 1549035061.89120 259 000008B670000000 DataBin \ 0 0000000000010010000111111011010000000001000000000000000110000110 1 0001100100000000000000000000000000000000000000000000000100100001 2 1000100000000000000000000000000000000000000000000000111011011111 3 0000000000000000000000000111111111001100010000010000000000000000 4 0000000000000000000010001011011001110000000000000000000000000000 DataBin_nc 0 0100100011111101101000000001000110000110 1 110010000000000100100001 2 1010000111011011111 3 00000 4 1100111
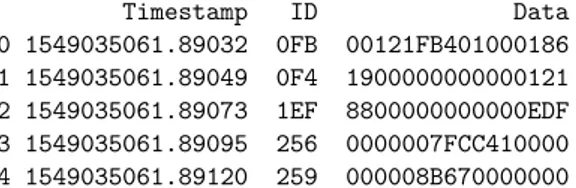
There are over 5.4 million packets in this dataset, and a total of 83 unique IDs 2
Figure 2.4: Example of individual recordings of CAN traffic data of an Alfa
Giulia Veloce vehicle.
can be displayed as a warning on the dashboard. A typical example of the use of the OBD port is clearing the “Check Engine” indicator on the dashboard. Through the port it is possible to know the reasons behind this warning and to turn the indicator off.
While it was originally meant to help technicians with their repair-ing/diagnosing tasks, the OBD port is also used by telematics after-market units connected directly to it. These units provide telematics
information to drivers and insurance companies [19].
2.3 preliminary analysis of can traffic
For this thesis, we collect logs of CAN traffic data from a real vehicle to use on our experiments. After collection, the first step is to study the data at hand. We are able to obtain some insight into our dataset, despite the lack of signal-semantic knowledge.
In this Section, we present our dataset and study its characteristics. These include obtaining the number of IDs, packet counts and their frequency, and how the available space is used. Finally, we study the symbol counts for each ID, which gives us a basic understanding of the behavior of the data contents.
2.3.1 Data collection
We gathered CAN messages from a 2017 Alfa Romeo Giulia Veloce, and use them to build our dataset. We collected the data from the OBD port, which allowed us to read CAN traffic directly from the bus. The data gathering process took place during a driving session that lasted 65 minutes. As data recording was taking place, the vehicle was driven inside the city and also on the highway.
2.3.2 Dataset
Our dataset consists of over 6 million messages. Each message has four variables which define the columns of our dataset. We describe
2.3 preliminary analysis of can traffic 15 2.0.1 DLC use
We can see that most of the packets use all the available 8 bytes of the data frame.
In [53]: ## Let's check how many bytes of the Data frame are used by checking the DLC
print(pd.Series(data['DLC']).describe(percentiles=[.01, .1, .18])) count 5,471,373.00000 mean 7.49818 std 1.18750 min 1.00000 1% 3.00000 10% 6.00000 18% 8.00000 50% 8.00000 max 8.00000
Name: DLC, dtype: float64
Now let’s check the IDs that produce the most packets:
In [4]: ser = pd.Series(data['ID'])
print('Top 20:\n',ser.value_counts().iloc[:20]) Top 20: 104 207833 0F0 207833 0DE 207832 0FF 207831 0FC 207831 100 207831 0F4 207830 0FB 207830 120 207828 0FA 207826 192 207700 0FE 207399 101 207399 0EE 207399 103 207399 107 207399 11C 207399 116 207399 1F7 103916 1F0 103916
Name: ID, dtype: int64
In [5]: fig, ax = plt.subplots(figsize=(16, 8))
p = sns.barplot(x = ser.value_counts().keys(), y = ser.value_counts().values) 3
Figure 2.5:DLC usage in our CAN recordings dataset.
• Timestamp. Numerical variable that indicates the time when the message was transmitted. It represents Unix time (also known as POSIX time, or Unix epoch time), which counts the number of seconds since midnight of January 1st, 1970.
• ID. An hexadecimal value representing the message identifier. • DLC. An integer for the data length code, it specifies the
pay-load size.
• Data. Payload for a specific message in hexadecimal representa-tion.
2.3.3 Data Characteristics
To have a better understanding of the characteristics of our dataset we perform a preliminary analysis on the CAN traffic logs we collected. Here we present our most relevant findings.
i d u s e. We identify 83 unique IDs in our dataset, each appearing
at different frequencies.
d l c u s e. By studying the distribution of DLCs, we observe that
most packets use all the available 8 bytes of the data frame. 89% of messages set their DLC to 8 bytes, around 10% to 6 bytes, and the rest make use of 1 to 3 bytes for their payload. Additionally, we confirmed that every ID uses a constant DLC throughout the dataset, so the size of the data field can be considered constant.
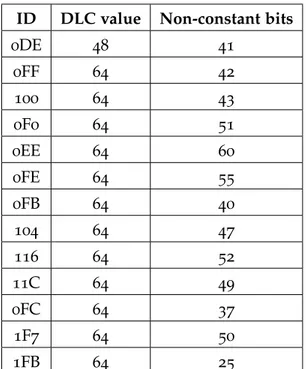
Despite the fact that most IDs use all the available payload size, several of the data buts remain constant throughout our dataset. We observe that constant bits are a common factor across IDs, albeit each
one in different distributions. In table 2.1, we show the varying
16 t h e c o n t r o l l e r a r e a n e t w o r k
ID DLC value Non-constant bits
0DE 48 41 0FF 64 42 100 64 43 0F0 64 51 0EE 64 60 0FE 64 55 0FB 64 40 104 64 47 116 64 52 11C 64 49 0FC 64 37 1F7 64 50 1FB 64 25
Table 2.1: Number of bits used for each ID as set in its DLC field, and how
many of those bits are non-constant in our dataset.
pa c k e t c o u n t s p e r i d. A handful of IDs produce most of the
packets found in the dataset. 18 IDs alone account for 56% of the
total traffic, as illustrated in Figure 2.6.
pa c k e t f r e q u e n c y. By computing the timestamp differences
be-tween messages with the same ID, we can estimate their respective transmission frequency. This allows us to determine which IDs trans-mit messages at a periodic rate, and which ones are aperiodic. 73 ID show seemingly constant frequencies, confirming the assumption that most CAN traffic is periodic. We illustrate the timestamp
2.3 preliminary analysis of can traffic 17
18 t h e c o n t r o l l e r a r e a n e t w o r k
2.3 preliminary analysis of can traffic 19
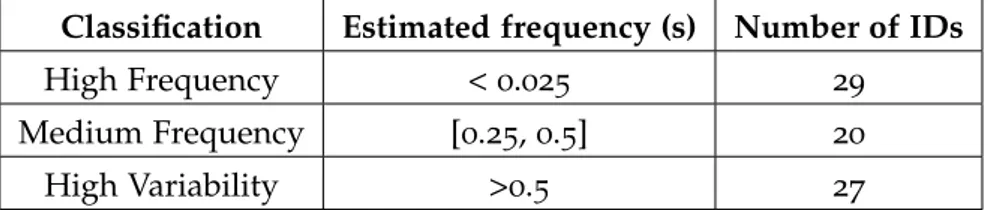
We divide periodic IDs into three categories depending on their
estimated frequency. We present this classification in Table 2.2, along
with how many IDs correspond to each category.
Classification Estimated frequency (s) Number of IDs
High Frequency < 0.025 29
Medium Frequency [0.25, 0.5] 20
High Variability >0.5 27
Table 2.2: Classification of IDs according to their estimated frequency (in
seconds) for our dataset.
s y m b o l c o u n t s For our data sequence anomaly detection
prob-lem, the most important field to consider is the data field (i.e. its payload). The field can be up to 64 bits long, allowing every ID to
pro-duce at most 264 unique data symbols. After analyzing the data, we
can observe that several IDs only use a small set of unique symbols, while others continuously create new ones. We count the number of unique symbols to define the variability of each ID, and divide them into three categories: Low, Medium, and High variability IDs. We
fol-low a similar classification as used in previous research [66].
Table2.3shows the ranges of unique symbols for each category, and
how many IDs belong to each one; we can observe that most IDs have high symbol variability. We also observed that 23 IDs only produce one unique symbol.
Classification Number of unique symbols Number of IDs
Low Variability <100 23
Medium Variability [100, 500] 7
High Variability >500 30
Table 2.3: Classification of IDs according to their unique symbol count in
the CAN dataset.
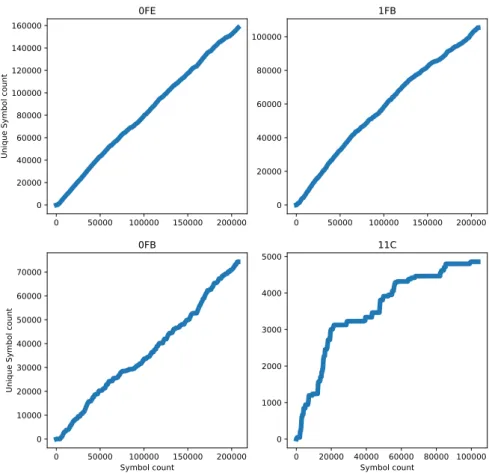
In Figure 2.8, we illustrate the symbol creation rate for four high
frequency IDs. This shows that CAN IDs continually create new sym-bols at a seemingly steady or growing rate.
For this work, we choose 12 IDs that belong to both high-frequency and high symbol variability categories, with more than 1% of their to-tal symbol count being unique. We chose these characteristics as they are most likely related to safety-critical systems, and also because they present the greatest challenge to model given their symbol cre-ation rates. The chosen IDs are:
20 t h e c o n t r o l l e r a r e a n e t w o r k 0 50000 100000 150000 200000 0 20000 40000 60000 80000 100000 120000 140000 160000
Unique Symbol count
0FE 0 50000 100000 150000 200000 0 20000 40000 60000 80000 100000 1FB 0 50000 100000 150000 200000 Symbol count 0 10000 20000 30000 40000 50000 60000 70000
Unique Symbol count
0FB 0 20000 40000 60000 80000 100000 Symbol count 0 1000 2000 3000 4000 5000 11C
Figure 2.8:Symbol creation rate for four CAN IDs.
0DE, 0EE, 0FB, 0FC, 0FE, 0FF, 1F7, 1FB, 11C, 100, 104, 116.
2.4 finding structure in can data
The data field typically has a substructure of its own. It is divided into several fields, each one with its own specific semantics. For example, a single packet could contain both data on the vehicle speed and revolutions per minute (rpm), both represented as 32-bit integers: the speed being stored on the first four bytes of the data field, and rpm in the remaining ones. Usually, not all the available bits are used, and some are set to a constant value. These bits seem to act as separators in the data frame. We can analyze the symbol variability to define
potential substructures in the messages. In Figure 2.9, we illustrate
the bit average values for a list of high-frequency CAN IDs, using over 200,000 logged CAN messages from the dataset. From this figure, we can visually identify some potential separators.
2.4 finding structure in can data 21 0FC 41B 0FF 0F0 104 100 0EE 0.0 0.2 0.4 0.6 0.8 1.0
Figure 2.9: Bit average values for a single CAN IDs.
2.4.1 Field Identification Algorithm
To identify potential structures in CAN frames, Markovitz and Wool
[41] proposed an algorithm that finds semantically meaningful
struc-ture in CANs messages when ECUs specifications are not previously known. The structure of messages consists of a concatenation of po-sitional bit fields of fixed length. By collecting CAN traffic logs, the authors attempted to classify the fields present in the data frames. This resulted in the identification of four field types with clear se-mantics: constant, multi-value, counter, and sensor. This classification depends on factors such as the length of each candidate field and its respective amount of unique bit counts.
f i e l d t y p e s Each field can be classified as:
1. Constant. Sets of bits with non-changing values.
2. Multi-Value. Fields that exhibited a set of few different unique
values. A minimum field length (denoted as TLmin) and a
maxi-mum symbol count (denoted as TVmax) are set as thresholds to
classify fields as multi-value.
3. Counter. Values that behave like a cyclic counter with minimum
and maximum values.
4. Sensor. Represent a measurement of a physical quantity, these
are continuous with some noise. In practice any field with a
symbol count greater than TVmax.
However, in the experiments Counter and Sensor were grouped into a single class. A procedure to separate these categories was left for future research.
22 t h e c o n t r o l l e r a r e a n e t w o r k
p r o c e d u r e Using sequences of CAN data as input, the algorithm
consists of the following steps:
1. Split into fields. Create a 64×64 matrix f to represent all possible
divisions. In this lower triangular matrix, columns represent the index of the fields’ left bit. Rows represent each field’s length.
For example, a candidate in f[10,4] represents a field that starts
at index 4 and has a length of 10 bits. Similarly, f[64,1]represents
a candidate field that uses the whole message.
2. Count Values. For each candidate in f, count how many unique
values k exist in the given dataset.
3. Types and Scores. Set a field type for every candidate and
com-pute a score for each one. For each candidate, types and scores are set using the following criteria:
a) Set to Constant if the number of unique values equals one. The score is set as the length of the field.
b) Set to Multi-Value if the unique values are less than TVmax,
and its length is at minimum TLmin. The score is set as the
length of the field.
c) Set to Sensor if the candidate was not set to the other types.
The score is computed as k2
sl, where k is the number of
unique values for the candidate field, and l is the length.
4. Choose fields. Iteratively traverse the candidates matrix following
this priority scheme: Constant Multi-Value Sensor. When comparing candidates of the same type, its priority is set by its score, with higher scores indicating higher priority. At each iteration, the algorithm removes all overlapping fields until no candidates remain.
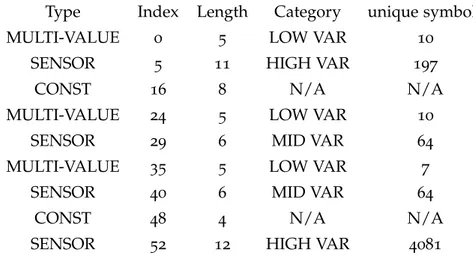
The algorithm outputs a list of disjoint fields, each containing values indicating its index, length, type, number of unique values, and score.
An example of the output for one CAN ID is shown in Table2.4.
However, the greedy algorithm proposed by Markovitz and Wool works by sequentially finding local optima in the group of possible candidates, and in consequence cannot guarantee that the results are optimum.
The field classification algorithm by Markovitz and Wool was pro-posed in a research paper in anomaly detection for automotive net-works. Their ADS proposal is based on Ternary Content Addressable Memorys (TCAMs), commonly used in network switches and routers. However, their ADS proposal was not tested, and their main contri-bution is the field identification algorithm.
2.4 finding structure in can data 23
Type Index Length Category unique symbols
MULTI-VALUE 0 5 LOW VAR 10
SENSOR 5 11 HIGH VAR 197
CONST 16 8 N/A N/A
MULTI-VALUE 24 5 LOW VAR 10
SENSOR 29 6 MID VAR 64
MULTI-VALUE 35 5 LOW VAR 7
SENSOR 40 6 MID VAR 64
CONST 48 4 N/A N/A
SENSOR 52 12 HIGH VAR 4081
Table 2.4: Resulting field division from the field identification algorithm by
Markovitz and Wool. It consists of a list of disjoint fields for a single CAN ID.
3
T H R E AT M O D E L & R E L AT E D W O R K
3.1 introduction
In this chapter we present the threat model and the relevant back-ground on anomaly detection on CAN. We divided this chapter into two parts. In the first part we summarize the vulnerabilities and at-tacks targeting the CAN bus, and from this analysis we present the threat model. In the second part of this chapter, we present a sum-mary of the most notable detection systems for CAN classified by their common characteristics. Then we present an introduction to RNNs, LSTM, and autoencoders; this section provides the context needed to understand some of the approaches used in anomaly de-tection. We conclude this chapter by presenting an overview of the solutions to anomaly detection on multivariate time-series, including their use in automotive applications.
3.2 threat model
3.2.1 Overview of vulnerabilities
Security experts and researchers have been able to compromise the security of vehicles due to the significant expansion of attack surfaces on automotive systems. New attack vectors exist as a result of intro-ducing new connectivity features, combined with several vulnerabil-ities that exist in the vehicle ECUs and other components connected to the bus.
Some of the earliest experimental assessments on automotive vul-nerabilities were published at the beginning of the decade. Koscher et
al.[32] performed an experimental security analysis of modern
vehi-cles, showcasing the issues on their networks and demonstrating that almost every ECU in the vehicle can be compromised. They begin by highlighting the inherent security challenges that the CAN protocol presents, which include:
• The broadcast nature of the protocol.
• Its fragility to Denial of Service (DoS) attacks, easily imple-mented by flooding the bus with high priority messages. • Lack of authentication.
• Weak access control. It can allow an attacker to read or mod-ify the state of ECUs, and to reflash their firmware. Koscher et
26 t h r e at m o d e l & related work
al. showcased examples of how the challenge-response autho-rization mechanism in the protocol specification can be circum-vented by a determined attacker.
Automotive protocols standards specify countermeasures to avoid some safety risks, for example, not allowing firmware updated while the vehicle is moving. However, in some cases, manufacturers
im-plement them poorly or completely ignore them. Koscher et al. [32]
found instances where components and units do not follow the secu-rity requirements of the protocol, which can be exploited by malicious agents to alter the state of the vehicle. The most notable issues they found include:
• Allowing unsafe commands to be accepted by ECUs while the vehicle is being driven. For example, executing the “disable all CAN communications” command and reflashing firmware. • Non-compliant access control. It allowed the researchers to read
sensitive memory and alter the state of several units. This was caused due to a poor implementation of the challenge-response authentication mechanism, which used hardcoded response keys. • Imperfect network segmentation. Because of the dependencies
between components, data has to be exchanged across buses and domains, and so gateways are put in place to bridge these networks. Researchers discovered that they were able to repro-gram these gateways from the low-speed bus, going against the protocol specifications that state that gateway reprogramming must only be possible in the high-speed network.
Later, Checkoway et al. [8] studied additional vulnerabilities, on
their work they classified automotive attack surfaces into three cate-gories:
• Direct/indirect physical access to the CAN bus (e.g. OBD port, CD players, USB interfaces, infotainment systems). These present lack of encryption, authorization, and authentication.
• Short-range wireless (e.g. Bluetooth, RF-based remote keyless entry, etc.). These present buffer overflow vulnerabilities, weak encryption, and a lack of authentication and authorization • Long-range signals (e.g. GPS, satellite/digital radio, cellular
in-terfaces). These present weak encryption, and a weak of authen-tication, and weak authorization mechanisms.
Long-range surfaces have been shown to have surprisingly weak secu-rity mechanisms. Some examples of this include the use of common passwords in Internet-facing components and the re-use of
encryp-tion keys [52]. Each of these surfaces presents different vulnerabilities
that can be exploited with varying levels of difficulty, but they have been experimentally proven to be feasible.
3.2 threat model 27
3.2.2 Attacks on the CAN bus
Attacks are offensive maneuvers that target information systems to gain unauthorized access or use of an asset, they are carried out by exploiting one or several vulnerabilities present in a computer system. In an automotive context, they can originate from components inside or outside the CAN bus, taking advantage of several vulnerabilities
that exist in CAN, as presented in Section 3.2.1. In this section, we
present some of the most notable research on experimental attacks on CAN. Our goal is to provide an overview of the attacks and their effects, and most importantly, to synthesize this information so we can build a threat model. More comprehensive lists on attacks
target-ing CAN can be found in literature [42,56,52]
Koscher et al. [32] presented several methodologies to carry out a
variety of attacks. Among these, they showed an attack that exploits the vulnerabilities on the access control mechanisms found in ECUs, allowing an attacker to inject arbitrary code in the ECU memory us-ing diagnostic messages, specifically the DeviceControl service. This allowed them to reprogram the functionality of the unit, which can be used to inject malicious messages into the CAN bus as if they were coming from a legitimate unit. Another attack consisted of injecting carefully crafted data frames which enabled them to control several components of the vehicle. The authors demonstrated it was possi-ble to display false information on the instrument panel cluster, or displaying bogus speedometer and fuel level values. These crafted frames were also used to control some of the car functionalities, such as: opening the trunk, unlocking the doors, controlling the horns, en-gaging the brakes, killing the engine.
Hoppe et al. [24] demonstrated that by injecting messages at high
rates, they could trick ECUs into accepting malicious input, effec-tively impersonating actuators. They managed to control windows, turn off warning lights, and fake the state of the airbag control sys-tem which had been removed. These attacks worked by continuously flooding the bus with fabricated messages, “drowning” the original signals. Additionally, they managed to take control of a gateway in the network, effectively gaining access to different domains and sub-networks.
Miller and Valasek [43, 42] work is one of the most notable on
cy-berattacks targeting vehicles, having a comprehensive assessment of vulnerabilities on real cars and documented examples of attack tests. Their experiments were carried out on real vehicles, where they were able to tamper the steering, braking, acceleration, and other function-alities. The attacks were carried out by directly fabricating specific frames using a compromised ECU. They also demonstrated a DoS attack that floods the bus with high priority messages, which causes
28 t h r e at m o d e l & related work
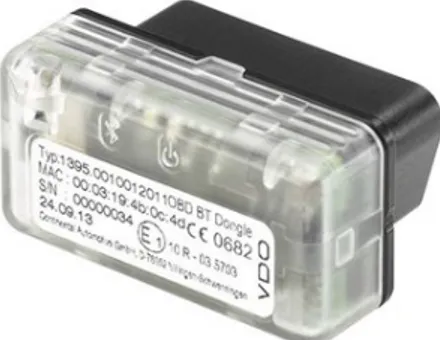
Figure 3.1: OBD Bluetooth Dongle by Continental used to transmit
telem-atics data (available at:https://www.continental-automotive.
com/en-gl/Trucks-Buses/Interior-Cabin/Tachographs, -Telematics-Services/Tolling-Telematic-Solutions/
Telematics/OBD-BT-Dongle)
vulnerabilities that could be exploited remotely, one of the most crit-ical included opening ports over a cellular connection through an authenticated port, and with it gain access to the CAN bus. The au-thors were able to take full control of a Jeep Cherokee wirelessly,
al-lowing them to shut down the engine of a moving vehicle [22]. They
also demonstrated an attack targeting the collision prevention system, where they were able to engage the brakes by impersonating the sys-tem without the need of injecting malicious messages at high rates.
Foster et al. [19] demonstrated how aftermarket telematics
com-ponents can be exploited remotely by taking advantage of several vulnerabilities found in them. They studied Telematic Control Units (TCUs) with Bluetooth or cellular interfaces, which are widely avail-able. These units are directly connected to the OBD-II port and give drivers and insurance companies data on how the vehicle is
operat-ing. Figure 3.1 illustrates an example of a TCU typically found on
the market. Since these units are connected to OBD they have direct access to the CAN bus. Their vulnerabilities can be exploited locally and used externally, i.e. start with physical access which then could launch a webserver with open ports and telnet. It was verified that all units sold by a specific manufacturer used the same SSH key, mean-ing that an attacker could buy a unit, manually retrieve the key, and use it to gain access to other TCUs.
Cho and Shin [10] and Palanca et al. [51] took advantage of the
error handling mechanism on the CAN protocol to compromise the availability of a target ECU, and even the whole bus. This approach uses the bit monitoring checks to deceive the target unit that there was an error with the message it was trying to transmit. This causes a chain of errors that eventually drive the target into bus-off mode, shutting them off the bus.