POLITECNICO DI MILANO
School of Architecture, Urban Planning and Construction
Engineering
Master of Science in Management of Built Environment
Economic Curriculum
AN INTERNATIONAL EXAMINATION OF THE ITALIAN
REIT/SIIQ. The effects of legislative reform: “Sblocca Italia”
Law Decree No. 133/2014.
Thesis Supervisor: Prof. Marzia Morena
Thesis Co-advisor: Dott. Tommaso Truppi
Chitte Sureshbabu
Student ID: 874490
3
Abstract
The aim of the dissertation is to examine the impact of law “Unlock Italy (Sblocca Italia) Decree (Decreto Legge No. 133/2014 of 12 September 2014, enacted by into Law No. 164/2014) – New measures to promote development of Italian REITs (SIIQ)”, introduced significant amendments to the Consolidated Construction Law No.296/2006 (2007 Budget) and comparing relevant and policies on direct taxation in REITs which is Italy’s ability to attract Foreign Direct Investments (FDI) as well as boosting development of SIIQs/SIINQs in the real estate market .
Firstly, the research opens an in-depth analysis of the Real estate market in Italy 2017 towards players (both domestic and foreign), taxation policies of various investment vehicles in the Italian real estate market. The research found an emerging the evolution of REIT (Real Estate investment trust) form in Europe distinguishable from the US model. Dominant REIT regimes around the Europe about the existing structure, regulation of the industry and common understanding between member states REIT regimes offering the prospect of a European harmonized REIT form, mainly the Italy REIT (SIIQ), other successful REITs in other European jurisdictions i.e. United Kingdom (REIT), Germany (REIT), France (SIIC), Spain (SOCIMI) and Netherlands (FBI).
The research can claim to be Italy’s positioning in the global context by measuring it by means of some comparative analysis in terms of the growth of the Italian REITs/SIIQ, diversification of asset allocation, performance of REIT/SIIQ companies, sensitivity of both domestic and foreign investors towards investment and the reaction of managers (SIIQ) of Italian REIT in two tenures as author proposes, which are Special SIIQ regime (2008-2014) under Law No. 296 dated 27 December 2006 and Unlock Italy period (2014-2017) under Legislative Decree n. 133 dated 12 September 2014. And then, we argue reforms (Sblocca Italia Decree) that have been initiated, have contributed to improving Italy’s Investment Climate?
Finally, the key factors for success required for increasing the desirability potential for International investors at improving the investment climate in real estate (REIT/SIIQ), the necessary condition for boosting the REIT industry and giving solidity to the path of growth in coming years that have not been addressed yet.
4
Abstract (Italian)
L'obiettivo della tesi è quello di esaminare l'impatto della legge “Sblocca Italia” (“Unlock Italy”) Decreto Legge n. 133/2014 del 12 settembre 2014, emanato con la legge n. 164/2014 – “Nuove misure per promuovere lo sviluppo di REIT italiani (SIIQ)", che ha apportato modifiche significative al Testo Unico delle Costruzioni - n.296/2006 (Bilancio 2007). La tesi confronta le politiche rilevanti del settore, le imposte dirette nei REIT e la capacità dell'Italia di attrarre investimenti diretti esteri (IED) e di potenziare lo sviluppo di SIIQ/SIINQ nel mercato immobiliare.
In primo luogo, la ricerca svolge un'analisi approfondita del mercato immobiliare in Italia nel 2017, degli attori (nazionali ed esteri), delle politiche fiscali e dei vari strumenti di investimento nel mercato immobiliare italiano. La ricerca evidenzia un'evoluzione del modello REIT (Real Estate Investment Trust) in Europa distinguibile dal modello statunitense. La tesi prende in considerazione i principali regimi REIT presenti in Europa ovvero Regno Unito (REIT), Germania (REIT), Francia (SIIC), Spagna (SOCIMI) e Paesi Bassi (FBI).
La ricerca individua il posizionamento dell'Italia nel contesto globale, misurandolo attraverso alcune analisi comparative in termini di crescita dei REIT/SIIQ italiani, diversificazione dell'asset allocation, performance delle società REIT/SIIQ, sensibilità degli investitori sia nazionali, sia stranieri verso gli investimenti nel settore e la reazione dei gestori di SIIQ in due periodi, individuati dall'autore, che sono il regime speciale SIIQ (2008-2014) ai sensi della legge n. 296 del 27 dicembre 2006 e il periodo Sblocca Italia (2014-2017) ai sensi del decreto legislativo n. 133 del 12 settembre 2014. Si ricerca poi se le riforme (Decreto Sblocca Italia) che sono state avviate hanno contribuito a migliorare il clima degli investimenti in Italia.
Infine, si discutono i fattori chiave di successo necessari per aumentare il potenziale di opportunità per gli investitori internazionali e per migliorare il clima degli investimenti nel settore immobiliare (REIT / SIIQ), condizione necessaria per stimolare l'industria REIT e dare solidità al percorso di crescita dei prossimi anni.
Acknowledgement
Master of science studies at Politecnico di Milano has given me a lot as I grew up as a person and professional, an opportunity to know the diversity of cultures and colleagues and overcome many challenges. Like any compelling adventure, the University studies is not a path that is tackled alone; I would like to thank several people who have contributed to the result of my master studies and thesis in many ways:
Foremost, I would like to express my sincere gratitude to my thesis advisors Prof. Marzia Morena_ FRICS and Dott. Tommaso Truppi of the ABC dept. at Politecnico di Milano for their continuous support of my research, for their patience, affectionate attitude, enthusiasm, immense knowledge, and healthy criticism added considerably to my experience.
My sincere thanks also go to Dr. Nadia Pessetti of IGD group for providing me the important data for analyzation of research and experts who were involved in the survey for this research.
I take this opportunity to express my deep sense of gratitude and respectful regards to all professors and teaching staff of Management of Built Environment at Politecnico di Milano, for sharing their knowledge during attending the courses and gave me untiring help during my study. Without their continual inspiration, it would have not been possible to complete this study. I gratefully acknowledge the financial assistance in form of DSU scholarship during my MSc studies by an Italian Government.
Finally, I must express my very profound gratitude to my both mothers Smt. Veeramma and Rukmini, brother CD Varaprasad, sister Kalpana Prathyusha and my best friends and classmates; Jakka Prasad, T. Venkatesh, Vani, Anusha, Amin, Meghanath, Priyanka, Sairam, Surya, Jagan, Shyam, Santosh, Pavan Tejaswi, Yachi, Vishal, Sandeep, Abhijit, Ravivarma, Ganesh, Bharati, Swami, Sridevi, Maha, Phillip, George, Adrian, Francesco, Federica, Gioia, Liona and Misa for providing me with unfailing support and continuous encouragement throughout my years of study. This accomplishment would not have been possible without them. Thank you.
6
Contents
Abstract ... 3 Abstract (Italian) ... 4 Acknowledgement ... 5 Contents ... 6 Acronyms ... 10 List of Figures ... 11 List of Tables ... 13 Introduction ... 15Chapter 1. Real Estate Investment & Transactions ... 19
1.1 Real Estate Market in 2017 ... 20
1.2 Real estate players and transactions ... 32
1.2.1 Real estate direct investment ... 33
1.2.1.1 Asset deals - Direct sale of real estate assets ... 33
1.2.1.2 Sale of Special Purpose Vehicle ... 41
1.3. Indirect Real Estate Investments ... 43
1.3.1 Real Estate Companies ... 44
1.3.2 Italian alternative collective investment undertakings (Italian AIFs-OICR’s): REIFs and Real estate SICAF’s ... 53
1.3.2.1 Real estate investment funds ... 54
1.3.2.2 Fixed Capital Investment Companies (Società di Investimento a Capitale Fisso-SICAF) ... 69
1.3.3 SIIQ’s and SIINQ’s as an incentive for boosting development of the real estate market. ... 76
1.4 Double tax treaties (DTT) ... 76
7
2.1 Real Estate Investment Trusts (REITs)... 79
2.2 The origins and Evolution ... 81
2.3 REIT types ... 82
2.4 REIT Sectors ... 87
2.5 Why Invest in REIT ... 89
Chapter 3. Characteristics of Global REIT ... 93
3.1 The US-REIT – The “model” REIT ... 93
3.1.2 Legal requirements... 94
3.1.3 Operating activities ... 95
3.1.4 Status ... 95
3.1.5 Tax treatment ... 96
3.1.6 Sanctions ... 96
3.2 REIT structures introduced in the world and in the EU ... 98
3.3 Current Listed REIT Market ... 100
Chapter 4. Italian REIT: SIIQ ... 103
4.1 Società di Investimento Immobiliare Quotate – SIIQ: Italian REITs ... 103
4.1.1 Introduction ... 103
4.1.2 Requirements for access to the regime ... 106
4.1.2.1 Subjective Requirements ... 106
4.1.2.2 Statutory requirements ... 108
4.1.2.3 Governance structure requirements ... 108
4.1.2.4 Objective Requirements ... 109
4.2 Tax regime of contributions to SIIQ/SIINQ ... 112
4.3 Tax regime of SIIQ and SIINQ ... 115
8
4.3.2 SIINQs ... 116
4.3.3 The entry tax ... 116
4.3.4 The exemption regime for income deriving the business of real estate leasing 117 4.3.5 Obligation of distributing the profits of the exempt activity ... 118
4.3.6 Obligation to keep two separate tax accounts ... 119
4.3.7 Events leading to a loss of the right to special regime ... 119
4.4 Tax treatment of shareholders ... 121
4.4.1 Domestic shareholders ... 121
4.4.2 Foreign shareholders ... 123
4.4.3 Tax treatment of foreign REIT and its domestic shareholder ... 125
4.6 Tax Comparison of Italian REIT (SIIQ) vs other alternative investment vehicles128 4.7 Tax Comparison of Italian REIT (SIIQ) vs Successful Europe REITs ... 131
4.5 Comparison table Special Regime 296/2006 vs Sblocca Italia 133/2014 ... 133
Chapter 5. Impact on SIIQ regime by Sblocca Italia ... 138
5.1. Increase in number and size ... 138
5.2 Asset allocation growth... 143
5.3 REIFs Liquidation phase – Transfer to SIIQ ... 144
5.4 Responsiveness of REIT managers to the tax change ... 148
5.5 REIT Performance ... 149
5.5 Sensitivity of Foreign Investors ... 156
5.6 Sensitivity of Domestic Investors ... 159
5.7 SIIQ vs other European REITs ... 163
6. Conclusion ... 168
Bibliography ... 173
10
Acronyms
AIFMD- Alternative Investment Fund Managers Directive (Directive 2011/61/EU) APAC- Asia-Pacific region
AUM- Asset Under Management
CL- Circular letter issues by Italian Tax Authorities
CONSOB- The Italian Companies and Exchange Commission (Commissione Nazionale
per le Società ela Borsa)
DTT- Double Taxation Treaty EEA- The European Economic Area EMEA - Europe, Middle East and Africa
ICI- Local Italian property tax (Imposta Comunale sugli Immobili) IMU – Italian property tax (Imposta Municipale Unica)
IRAP- Italian regional income tax (Imposta Regionale sulle Attività Produttive) IRES- Italian corporate income tax (Imposte sul Reddito delle Società)
IRPEF- Italian personal income tax (Imposta sul Reddito delle Persone Fisiche) OECD- Organization for Economic Co-operation and Development
OICR- Undertakings for collective investment (Nell'ambito degli Organismi di
investimento collettivo del risparmio)
REIF- Real Estate Investment Funds REIT- Real Estate Investment Trust
SGR – Investment Management Company (Societa' di Gestione del Risparmio)
SICAF- Fixed Capital Investment Company (Società di Investimento a Capitale Fisso) SIINQ- Unlisted Real Estate Companies (Società di investimento immobiliare non quotate) SIIQ- Listed Real Estate Investment Companies (Società di Investimento Immobiliare
Quotata)
TASI- Italian tax for Indivisible Services (Tassa sui servizi indivisibili) TARI- Italian maintenance tax (Tassa sui rifiuti)
VAT - Value added tax
EPRA NNNAV- European Public Real Estate Association triple net asset value WHT- Withholding tax
11
List of Figures
Figure 1: FDI inflows in % GDP ... 21
Figure 2: Real GDP forecast ... 23
Figure 3: Global Capital Flows 2017 ($ bn) ... 24
Figure 4: Global real estate investment and cross regional capital ... 24
Figure 5: Investment share by country -Europe 2017 ... 25
Figure 6: cross-border vs domestic investment- Europe 2017... 26
Figure 7: Investment share by asset type - Europe 2017 ... 27
Figure 8: investment volume by asset type - Europe 2017 ... 27
Figure 9: Investment volume in Italy by the source of capital ... 28
Figure 10: Asset volumes type - Italy 2017 ... 30
Figure 11: Cross-border vs domestic investment - Italy 2017 ... 31
Figure 12: Foreign investors region - Italy 2017 ... 32
Figure 13: Number of SGR ... 56
Figure 14: Total number of real estate funds ... 56
Figure 15: Evaluation REIT industry ... 81
Figure 16: Comparable chart of 15-year annualized return of alternative investments. ... 89
Figure 17:Annualized compound dividend growth since 1999 ... 90
Figure 18: Liquidity of various forms of Real Estate of UK ... 90
Figure 19: Listed REIT market share vs Commercial Real Estate by Q2;2018 ... 101
Figure 20: Listed REIT market vs Stock market by Q2;2018 ... 102
Figure 21: Number(company) and total asset volume of SIIQ industry- Year wise ... 142
Figure 22: % of growth in capitalization – year wise ... 143
Figure 23: SIIQ: Asset volume types - year wise ... 144
Figure 24: Total amount of Retail funds expiring year, up to date as of 31/12/2014 ... 146
Figure 25: IGD SIIQ S.p.A - EPRA NNNAV per share vs Price of the security ... 152
Figure 26: Benistabili SIIQ S.p.A - EPRA NNNAV per share vs Price of the security . 153 Figure 27: Stock price/NNNAV Share price ... 154
Figure 28: IGD SIIQ S.p.A - DPS vs FFO/Share ... 155
Figure 29: Benistabili SIIQ S.p.A - DPS vs FFO/Share ... 155
12
Figure 31: Background of responder’s ... 160
Figure 32: Domestic willingness to make type of investment. ... 161
Figure 33: Domestic expectation on diversification requirement in investment. ... 161
Figure 34: Domestic awareness on Sblocca Italia degree no. 133/2014. ... 162
Figure 35: Domestic opinion on returns by the impact of Sblocca Italia no. 133/2014. 162 Figure 36: Domestic opinion on competitiveness of Sblocca Italia degree no. 133/2014 ... 163
Figure 37: Comparison of the Dividend yield of SIIQ vs other EU REIT regimes... 164
Figure 38: Dividend yield comparison of SIIQ vs Europe REIT developed and Global REIT market... 165
Figure 39: SIIQ market vs other EU REIT regimes market ... 167
13
List of Tables
Table 1: FDI inflows in % GDP ... 22
Table 2: Real GDP forecast ... 22
Table 3: Direct taxation for asset deal - direct sale ... 35
Table 4: Registration and VAT tax for Asset deal - Direct sale ... 38
Table 5: Mortgage tax for asset deal - direct sale ... 38
Table 6: Cadastral tax for asset deal - direct sale ... 39
Table 7: Property maintenance taxes ... 40
Table 8: Indirect sale through SPV ... 42
Table 9: type of real estate companies ... 48
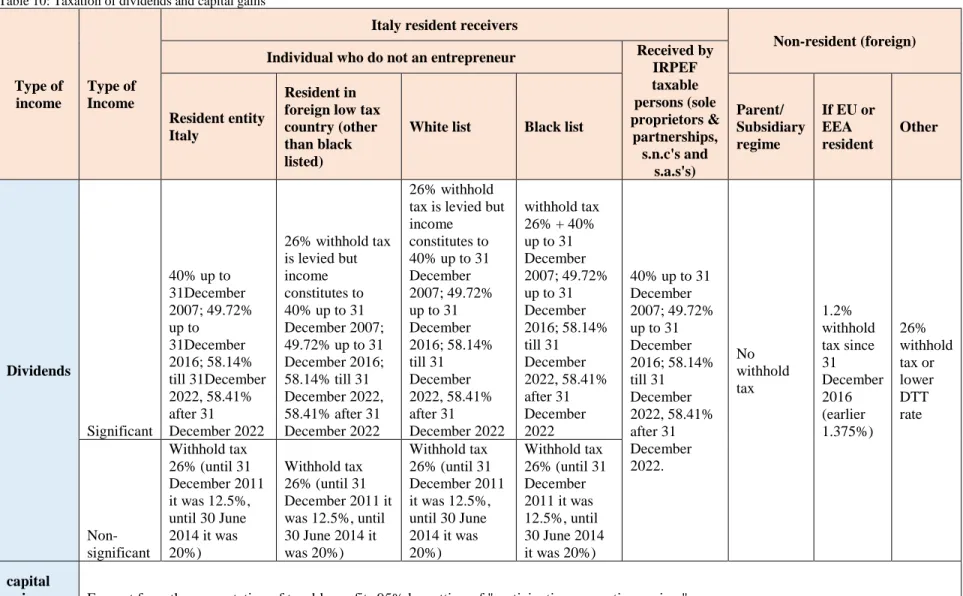
Table 10: Taxation of dividends and capital gains ... 52
Table 11: Direct & Indirect taxes applicable to contributions of real estate assets to a real estate investment fund... 60
Table 12: Direct taxation of real estate funds at an entity level ... 62
Table 13: Non-resident institutional investors which benefit from the exemption from the withholding tax on proceeds distributed by Italian estate investment funds ... 66
Table 14: Tax regime applicable to proceeds distributed by real estate investment funds67 Table 15: Tax regime applicable to Capital gains distributed by real estate investment funds ... 67
Table 16: Tax summary of REIF ... 68
Table 17: Direct & Indirect taxes applicable to contributions of real estate assets to a SICAF ... 72
Table 18: Direct taxation of SICAF at Entity level ... 73
Table 19: Tax regime applicable to proceeds distributed by real estate SICAF ... 74
Table 20: Tax regime applicable to Capital gains distributed by real estate SICAF ... 74
Table 21: Tax summery of SICAF... 75
Table 22: List of white list countries ... 78
Table 23: Overview of the US-REIT model regime ... 97
Table 24: History of REIT and capitalization in the world: 2017 ... 99
Table 25: Listed REIT market ... 101
14
Table 27: Taxation on contribution to SIIQ regime ... 115
Table 28: Events lead to loss of right to the SIIQ status ... 121
Table 29: Taxation of Dividends at domestic shareholder level: SIIQ ... 123
Table 30: Taxation at foreign shareholder level: SIIQ ... 125
Table 31: Tax on capital gains at the Foreign shareholder level ... 125
Table 32: Tax Summary of SIIQ ... 127
Table 33: Tax comparison of Indirect real estate investment vehicles (REIF, SICAF & SIIQ) ... 129
Table 34: Comparison of SIIQ and other successful REIT regimes in the EU. ... 132
Table 35: Comparison of Special regime (296/206) vs Sblocca Italia (133/2014. ... 133
Table 36: Number and total asset volume of SIIQ industry year wise ... 141
Table 37: % of growth in total asset volume - Year wise ... 142
Table 38: SIIQ asset volumes - Year wise ... 143
Table 39: Number of shares increase -year wise ... 147
Table 40: Tax change in Special regime vs Sblocca Italia ... 148
Table 41: SIIQ – Tax-exempt income ... 149
Table 42: Extracted data set of IGDSIIQ S.p.A from yearly financial statements ... 151
Table 43: Extracted data set of Benistabili SIIQ S.p.A from yearly financial statements ... 151
Table 44: Amount of capital flow in IGD - Domestic vs Foreign ... 156
Table 45: Amount of capital flow in IGD - Domestic vs Foreign ... 157
Table 46: IGD - free float regions ... 157
Table 47: Taxation of Income/dividends of SIIQ at foreign shareholder's level ... 158
Table 48: Source of FDI regions with WHT rate ... 159
Table 49: EU REIT regimes: enacted and amended years. ... 164
Introduction
As a broad definition, real estate can be used to mean a piece of land and all the buildings positioned on it. On the other hand, it can also be used as a narrow definition to describe the documents and agreements which state the owner as a property investor. Consequently, direct real estate investment is the direct ownership of real estate. These investments are bought and sold in the private property market that is characterized as having high transaction costs without central trading, and inefficiencies in information creation and asset pricing. Direct real estate investments are characterized by large unit size, indivisibility, heterogeneity, and low liquidity. In addition, direct real estate investments demand large amounts of capital, and they amount only to a small portion of the publicly traded assets, making it harder for small investors to invest in them. Despite the negative characteristics of direct real estate investments, they also comprehend features that are appreciated and preferred by investors. Direct real estate assets are estimated to account for a significant amount of the world’s total wealth. The exact amount of real estate assets in the whole world is unknown but it is estimated that at least 40 to 50 percent of the total wealth in the United States of America comprises of real estate (Han Chan, 2003).
The balancing act between the pros and cons of real estate investments has glimmered new ways of investing in real estate. An alternative way of acquiring real estate assets is by investing in indirect real estate. Indirect real estate investments are securities that offer a claim on the cash flows and value increase of the security’s underlying property assets. These securities are traded on the public asset markets and are generally characterized as having a small unit size, homogeneous claims on the underlying asset, and good liquidity. Besides the physical investment in direct real estate, investors also can invest in several forms of indirect real estate, for example in Italy, the principal juridical forms such as real estate companies (Ordinary commercial companies), real estate investment funds, fixed capital investment companies (SICAF- Società di Investimento a Capitale Fisso), Listed real estate investment companies (SIIQs- Società di Investimento Immobiliare Quotata)
and Unlisted real estate investment companies (SIINQs- Società di Investimento Immobiliare Non Quotate). On a general basis, these instruments have the advantage of
giving investors an acquaintance to the housing market identical to that of direct real estate investments.
16 There are substantial evidence that direct and indirect real estate investments share a common real estate factor that influences their values. This connection between the two types of real estate investments would suggest that investors could more easily invest in real estate via real estate securities. Nevertheless, for the investors to benefit from the positive characteristics of direct real estate, the securitized real estate assets need to be able to work as good substitutes for direct property investments. Previous research has recognized that contemporaneous correlations between direct and indirect real estate are weak (Mueller, 2003) and in short-term indirect real estate is more closely related to the general stock market (Ling, 1999). However, when linkages between real estate investments are studied in inter-temporal context the existence of a common real estate component is confirmed (Gilberto, 1990).
The existence of indirect real estate investments like REITs is not a novelty, for example, the U.S. capital market has had publicly traded real estate securities on it since the 1960s. However, in recent decades the role of public real estate assets has changed, and due to the strong increase in asset securitization real estate investments have become more accessible for small and medium-size investors. A good indication of this is not only the huge increase in market capitalization of indirect real estate assets but also the increased number of actors on the market (Han Chan, 2003). Since indirect real estate investments are traded on the public market they have been considered as some type of hybrids that combine elements from both the general stock markets as well as from the private property market.
The listed Real Estate Investment Trusts (REITs) have reinforced in recent years with the ease of moving money in the global financial market. Over the past four decades, real estate investment trusts or REITs as they are commonly called have become a significant asset class. In fact, REITs have become the third largest asset class available to investors, behind bonds and stocks (Imperiale, 2002). Globalization has fueled a hunger in Investors to extend their focus from domestic to international investments, motivated by beneficial tax regimes in the country where the investment target is located, allowing higher yields. International taxation is an embryonic field, in which conflicting or converging interests between States, or between States and taxpayers, shape the applicable national rules. Previous research on the impact of taxation on foreign direct investment (FDI) flows, using data on flows between seven countries for 1984 through 1989, and a sophisticated measure
17 of the cost of capital and they find that the choice between domestic investment and total outward FDI is not significantly affected by taxation, but that taxation does affect the location of outward FDI by an impact of tax integration systems (FREEMAN, 1995). The globalization of real estate investment continues as new sources of capital flow into the sector, ranging from individuals to the largest institutions in the world. For in the case of Growth Tax Relief Reconciliation Act of 2003 (2003 Tax Act, USA) reduced shareholder-level taxes on dividends and capital gains consequently reduce firms’ overall cost of capital, then the corporate investment should increase after the 2003 Tax Act (John L. Campbell, 2013). REIT popularity grew because of increasing globalization and the related cross-border flow of capital resources, looking to optimize their tax treatment using applicable Double Tax Treaties (DTT). It is of little interest to the domestic shareholder in a domestic REIT, but rather for the non-domestic investor/shareholder. Previous research about the role of taxes in real estate investment and management, the responsiveness of real estate investors to changes in their own taxes and the responsiveness of real estate managers to changes in their investors’ taxes and try to find evidence consistent with foreign investors responding to the 2004 reduction in capital gains withholding taxes (USA), as well as evidence that rate reductions impacted REIT managers’ real asset disposition strategies in the US REIT (Margot Howard, Fall 2016). A large reduction in the individual dividend tax rate (2003 tax act USA) influences corporate payout policy and provide evidence that top executive holdings of company stock significantly influence a firm’s choice of payouts (Brown, 2007).
Generally, studies examining REIT performance are divided into various time periods. First and foremost are those that examined the performance of REITs over the short term (periods less than ten years) and those conducted to examine performance over the long term (periods of ten or more years), Using the traditional Jensen model (Han, 2005), found that REIT performance was similar to the market during the period 1970-1993. They also found however that REIT performance was however not stable over time. However, Li & Wang, (1995) also in their examination of equity real estate investment trusts and mortgage real estate investment trust performance over a twenty-year period and found that REIT returns were more predictable than stock returns. For short terms, other researchers have
18 focused on comparing real estate investment trust performance to common stock and as well as real estate investments (Kuhle, 1987) (Gilberto, 1990); (Martin, 1991).
This research explores whether there is a boost in SIIQ/SIINQ in the Italian real estate market in terms of capitalization, asset allocation, the responsiveness of SIIQ managers and investors (domestic & foreign) especially attracting FDI by an introduction of Sblocca Italia decree no 133/2014 as expected by policymakers.
The work will be set out as follows. The first section will concentrate on the current real estate market in the Europe investment share by country as well as share by asset type. Consequently, the real estate market in Italy and players in the real estate and instruments under Italian law (closed real estate mutual funds and SIIQs), a brief analysis of the main investment instruments available to domestic as well as foreign investors and analysis of current taxation policies applicable to different real estate investments available in Italy. In the second section, seeks a definition of the REIT, types, and sectors in REIT and the current existence of REIT and the reason to invest in REIT along with risk.
In the third section reveals the essential criteria and evolution of the REIT industry across the World and Europe. The focus is given to the US-REIT, the first and so-called “model” REIT. From the analysis of the US-REIT, its relevant criteria provide a framework as a basis for the subsequent analysis of REIT regimes in EU.
In the fourth section, seek out a comparison of Italian REIT (SIIQ) regime in two regime period which are Special regime period (2007-2014) and Sblocca Italia (Unlock Italy) regime period (2014-Present) to define the major changes applicable to the Italian REIT regime and also claiming the taxation comparing with the other competent instruments Italy (Real estate funds and SICAF) and in Europe REIT regimes i.e. United Kingdom (REIT), Germany (REIT), France (SIIC), Spain (SOCIMI) and Netherlands (FBI).
Finally, in the last section try to find out how the Italian real estate market has been transformed by an introduction of Sblocca Italia (Unlock Italy) under Legislative Decree no. 133 dated 12 September 2014, amended to the Special regime under Law No. 296 dated 27 December, in terms of growth of Italian REIT/SIIQ market, diversification of asset classes, the responsiveness of Managers of Italian REITs/SIIQs, the sensitivity of Domestic and Cross-border investors. Also, try to seek out the responsiveness of existing SIIQ market with other successful EU REIT market regimes and further new development.
19
Chapter 1. Real Estate Investment & Transactions
When we talk about real estate investment, we usually discuss the purchase of a property to comprehend gains through rents income or capital appreciation. Extensively, in fact, direct purchase of properties is the conventional way of investing. For several years, however, thanks to the globalization, growing internationalization, and integration of capital markets with American and British markets as reference points, other types of investment have been full-fledged. Such investments aiming to resolve some of the difficulties associated to direct real estate investments, the high unit value of goods and their limited liquidity.
After having current Real Estate market in Europe and Italy (2017-18). Consequently, we will analyze the types of indirect real estate investment available to investors, focusing on the instruments under Italian law. The objective of the chapter is to demonstrate the economic and taxation policies relating to the type of Real estate investments under Italian law which are available to the domestic as well as foreign investors to have a guide for the following tabular and graphical analysis. Whatever analysis could be related to the taxation to the value of the real estate which are operators for the different typology of indirect investment. Without this descriptive part would be difficult to understand the benefits of indirect vehicles that will be analyzed in the following chapters. The main ways of structure to be used to carry out the transfer of an asset or property is particularly important in the real estate investment process. Since this process is complex and greatly influenced by the tax consequences of the various choices of the parties involved in the transaction. Indeed, the impact of a transfer may vary significantly depending on the asset selected, sometimes opposite directions for the buyer and for the seller. In practice, apart from careful analysis, some long and complex work may be required to ensure that an agreement between the interests and needs of the parties.
Before analyzing the taxation of different indirect Real estate investments, let us examine the current situation (2017-18) of the existed real estate market in the Europe and Italy towards diversification of asset classes and diversification of investors i.e. share of the domestic and foreign investment.
20
1.1 Real Estate Market in 2017
FDI inflows global overview
Foreign direct investment (FDI) is an integral part of an open and effective international economic system and a major catalyst to development. Yet, the benefits of FDI do not accrue automatically and evenly across countries, sectors and local communities. National policies and the international investment architecture matter for attracting FDI to a larger number of developing countries and for reaping the full benefits of FDI for development. The challenges primarily address host countries, which need to establish a transparent, broad and effective enabling policy environment for investment and to build the human and institutional capacities to implement them1 (OECD, 2002).
Therefore, FDI does not only bring stable capital inflows but technological know-how, transfer of technology, highly-paying jobs, entrepreneurial and workplace skills, new export opportunities and a panoply of managerial skills and innovation. In other words, it means that the aim of FDI is to generate high returns, and such maximization of wealth requires a healthy business environment in the country where investment is expected, for FDI to perform and to sell the foreign project it created2 (WCO ESA ROCB, 2018).
Since proposed that technology spillovers from international trade can be extended to foreign direct investment, governments around the world have derived the consensus that FDI contributes to economic growth. Almost all countries try to attract foreign investment to stimulate the national economy, especially in the developing countries the governments often adopt preferential policies for FDI. The world market of FDI is highly competitive3 (Hong, 2013). Foreign direct investment is the net inflows of investment to acquire a lasting management interest (10 percent or more of voting stock) in an enterprise operating in an economy other than that of the investor. It is the sum of equity capital, reinvestment of earnings, other long-term capital, and short-term capital as shown in the balance of payments. This series shows net inflows (new investment inflows less disinvestment) in the reporting economy from foreign investors and is divided by GDP4 (IndexMundi, 2018).
1 OECD, FDI for development (2002)
2 https://www.wcoesarocb.org/benefits-foreign-direct-investment-fdi-boost-economic-growth/ 3 Does and How does FDI Promote the Economic Growth? Evidence from Dynamic Panel Data of
Prefecture City in China- Liming Hong (2013)
21
Figure 1: FDI inflows in % GDP
Source: (FDI Inflows -OECD, 2018)
Here, we have extracted the data and graph (figure 1) from OECD of FDI inflows in % of GDP of Italy, European Union, OECD and world from 2005 to 2017. The FDI inflows of % GDP was steady growth from 2005 to 2007, however, due to the financial crisis of 20085 (Recession of 2008, 2018) major worldwide economic downturn that began in 2008 and continued into 2010 and beyond. During 2014-15, the FDI inflows of % GDP of growth ensued in several regions i.e. world from 1.9% to 2.93%, EU from 1.36% to 3.87% and OECD from 1.35% to 2.85%, nevertheless Italy was throwing down from slightly from 1.08% to 1.07%. Since 2015 Italy had started recovering after a deep and long recession due to several Structural reforms, accommodative monetary and fiscal conditions, and low commodity prices have helped the economy to turn the corner. The Jobs Act, part of a wide and ambitious structural reform program, and social security contribution exemptions have improved the labor market and raised employment. Yet, the recovery remains weak and productivity continues to decline. Returning the banking system to health will be crucial to reviving growth and private investment.
22
Table 1: FDI inflows in % GDP
Source: (FDI Inflows -OECD, 2018)
More investment in infrastructure will be essential to raise productivity (OECD economic survey-2017). We can see in Figure 1, the clear indication of growth of FDI flows of % GDP 1.07 % to 1.2% during 2015-16, whereas other regions were falling i.e. in the world from 2.93% to 2.6%, EU from 3.87% to 3.31% and OECD from 2.85% to 2.59% during 2015-16.
GDP growth of Italy
With regards to real GDP growth and forecast, the same situation has been affirmed what we have seen before in terms in FDI flows of % GDP, the real GDP growth of European Area countries in total (16 countries), OECD and world was steady growth till 2006, due to the financial crisis of 2008 major worldwide economic downturn that began in 2007 and 2008. During 2009 and 2010 there was tremendous growth in all the said regions and downturn affirmed in 2011, and the GDP growth is fluctuating since 2012. But we can see in figure 2, from 2014 to 2016, there was negative growth everywhere i.e. world 3.5% to 3.1%, OECD from 2.2% to 1.8 %, Euro area (16 countries) from 1.3% to 2.0 during 2014-15 and turn down to 1.8% in 2016 except Italy which has growth from 0.2% (2014) to 0.8% in 2015 and then 1.0% in 20.16 due to the several policy implications of “structural reforms 2014.
Table 2: Real GDP forecast
23
Figure 2: Real GDP forecast
Source: (Real GDP forecast-OECD, 2018)
One major thing we have been observed that how FDI flows are impacting the country real GDP growth, this is the prime reason for this research towards foreign direct investments in Real estate investment after implementation of Sblocca Italia (Unfreeze Italy) Law No. 133/2014.
The Global real estate market 2017
Real estate continues to attract capital, demonstrating its appeal over other asset classes in an otherwise uncertain investment world that is starting to betray signs of nervousness over inflation and rising interest rates.
According to Real Capital Analytics (RCA), global volumes for completed sales of commercial properties totaled $873 billion last year, matching the total registered in 2016. As shown in figure 3 (global capital flows-2017), a 6 percent rise in the Asia Pacific and an 8 percent increase in Europe offset a decline in the US, the world’s largest commercial real estate investment market. Though the past two years rank behind 2015 as the decade’s most active for investment, the rising deal flow in Europe and record levels of activity in Asian markets, such as Hong Kong and Singapore, are nonetheless remarkable at a time when real estate is universally acknowledged to be late in its cycle6 (Pwc, 2018).
24
Figure 3: Global Capital Flows 2017 ($ bn)
Source: Real Capital Analytics (Pwc, 2018)
The global asset management industry will continue to see rapid growth in assets under management (AUM), Global AUM is forecast to grow by an annualized 6.2% between 2016 and 2025 (Pwc, 2018) driven by inflows from high-net-worth individuals and retirement savings. Growing transparency diversification strategies and an ongoing search for yield will result in investments in alternatives doubling in the 2016-2025 period.
Figure 4: Global real estate investment and cross regional capital
25 According to CBRE Global real estate market outlook-2018, Investors main challenge in 2018 is sourcing core deals7. Better-than-expected global economic growth and strong occupier fundamentals have buoyed investor sentiment, and global investment volumes are at elevated levels, However, the lack of product in core markets is hampering further turnover growth and investment turnover overall is expected to remain stable or stable or modestly decline in 2018 (CBRE, 2018).
As we can observe from figure 4, the global cross-border investment has been steadily growing since 2009 (immediate year of Financial crisis 2008) has cross-regional capital (cross-border investment) 7% of overall investments and it reaches almost 15% in the year 2017.
The European Real estate market 2017
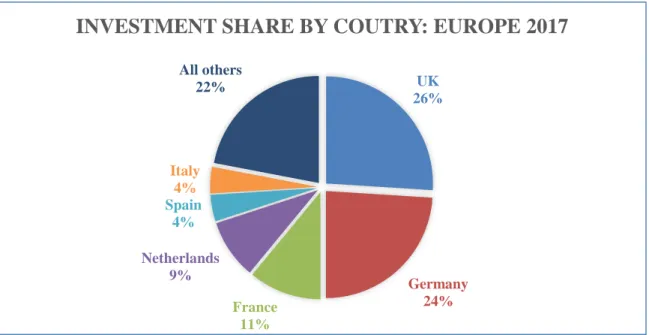
According to Assoimmobiliare, the volumes recorded during the year (2017) confirm a general trust in the real estate market, with a total investment of about €240 billion (excluding residential) invested in Europe. We can see the figure no:5, the favorite market among Europe investors was the United Kingdom, which remained top of the list for real
Figure 5: Investment share by country -Europe 2017
Source: (Assoimmobiliare, 2018)
7 investments considered to be the least risky because they often target stabilized, fully leased, secure
investments. UK 26% Germany 24% France 11% Netherlands 9% Spain 4% Italy 4% All others 22%
26 estate investments (26% total transactions), closely followed by Germany (24%). France was in the third position, with investments equal to 11% of total transactions. The strongest performance was delivered once again by Germany, with volumes of approximately €58 billion and an impact of 25% on total European volumes. This data confirms the benefits derived from post-Brexit decisions in favor of the main German cities. Southern Europe confirmed its position in the investment market with a share of 8% of total European investments, about 4% of which in Italy (Assoimmobiliare, 2018).
When it comes to the diversity of investors (both domestic and foreign), more mature markets, such as the German, British and French ones, confirm a uniform activity of domestic and international investors. Italy, Spain, and the Netherlands confirm a predominance of foreign currency on the total transactions for 2017. We can see in the
figure no.6, Italy stood the first (68%) among all European countries towards foreign
investment compared with domestic investment, Spain stood 2nd with 63% and the Netherlands took 3rd with 60%. It is claiming that Italy had an attraction to foreign investors
(Assoimmobiliare, 2018).
Figure 6: cross-border vs domestic investment- Europe 2017
Source: (Assoimmobiliare, 2018)
The low inflation and low-interest rate environment continued to attract investors, who tended to diversify by product types, focusing on non-traditional asset classes such as-
53% 53% 67% 40% 37% 32% 54% 47% 47% 33% 60% 63% 68% 46% 0% 10% 20% 30% 40% 50% 60% 70% 80% 90% 100%
UK Germany France Netherlands Spain Italy All others
Cross-border vs Domestic Investment 2017
27
Figure 7: Investment share by asset type - Europe 2017
Source: (Assoimmobiliare, 2018)
logistics, hotels, health care and student housing. We can see in figure 7 the diversification of investment in different asset classes excluding traditional residential, office was top asset class of 42% logistics (retail) stood 21% and it has been growing sector among all asset classes according to CBRE 2018, Industrial was with 13%, hotel was with 6% and others including health care, student housing etc. were with 14%.
Figure 8: investment volume by asset type - Europe 2017
Source: (Assoimmobiliare, 2018)
As we can see in figure 8, the diversification is particularly evident in the United Kingdom, Germany, and, The Netherlands, where investors unwilling to adapt to lower profitability
42%
21% 13%
6% 14%
Investment share by asset type - Europe 2017
Office Retail Industrial Hotel Other (exculding residential)
38% 41% 72% 26% 43% 36% 39% 13% 25% 11% 39% 24% 21% 26% 14% 15% 13% 8% 12% 13% 12% 9% 4% 0% 27% 6% 7% 4% 26% 15% 4% 0% 14% 24% 19% 0% 10% 20% 30% 40% 50% 60% 70% 80% 90% 100%
UK Germany France Spain Italy Netherlands All others
Investment volume by asset type -Europe 2017
28 expectations have turned to the alternative asset. With the recession now behind us, the intensity of growth varies from country to country. The Netherlands also displayed extraordinary performance, with volumes more than 20 billion, double compared to the previous year. When it comes to Italy and France had more market for office compare with other markets but in Spain had a huge market for retail sector compare with other countries. The Real estate market in Italy
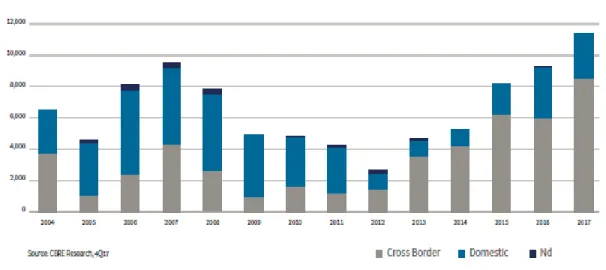
According to CBRE, 2017 was a strong year for the Italian property sector, with investments of Euro 11.4 billion – up by 23% versus 2016 confirming the ongoing consolidation. It is becoming a “major” market despite adversities and thanks to increasing globalization of property trends and capital flows. The prolonged period of low-interest rates has prompted pension funds and institutional investors in general (insurers and sovereign funds) to seek attractive returns. As a result, they have increasingly begun to include property in their investment and portfolio diversification strategies. During 2017, investment in Italy by local institutional investors (some insurance companies and pension funds) and foreign investors (French, in particular) was up versus 2016, reaching at least Euro 2.5 billion – 22% of the total volume. This trend is set to continue in 2018, alongside growth in opportunistic and value-add investments, meeting the demand for higher returns.
Figure 9: Investment volume in Italy by the source of capital
Source: (CBRE Italy, 2018)
The survey showed that asset pricing is becoming one of the main obstacles for potential investors in Italy: 16% said it was a barrier, second only to the 25% who said that asset
29 availability would once again be the main hindrance to investing in 2018. This will act as further encouragement for investors to move higher up the risk curve in 2018. Further proof of this trend is the return of developments, albeit selective, in investors’ crosshairs.
The globalization of the investment industry will continue in 2018. Global capital markets have become increasingly interconnected and this is becoming more and more clear in the Italian property market as well. In fact, in 2017 foreign capital accounted for just over 70% of the capital invested in Italy, totaling approximately Euro 5 billion. These investors will continue to be the main driver of investments in 2018. North American investors were particularly active in Italy again in 2017, accounting for approximately 25% of invested capital. The share of Asian capital increased to approximately 11% in 2017, reflecting indirect investment initiatives and/or pan-European agreements to acquire major asset platforms, especially in the logistics sector. In particular, the majority of the billion euro of Asian capital invested in Italy was made up of CIC’s acquisition of the Logicor logistics platform and the successful IPO by Cromwell, at the second attempt, of a portfolio owned by Cerberus on the Singapore stock exchange (CBRE Italy, 2018).
According to Assoimmobiliare, approximately 9.3 billion euro was invested in the Italian real estate market (excluding residential) in 2017, confirming a very strong interest in the sector and an increasingly dynamic activity characterized by the growth of transactions and portfolios above €100 million (60% of total transactions). In addition, non-traditional asset classes recorded a strong interest, and were mainly represented by the sale of telephone exchanges by Beni Stabili SIIQ for an overall value of 620 million euro, not included in the volumes mentioned above, as it consisted of a sale of a 40% share, which would if considered, increase the investment volumes to approximately €10 billion. We can see various asst volume type along with the value of the investment in figure 10. (Assoimmobiliare, 2018).
30
Figure 10: Asset volumes type - Italy 2017
Source: (Assoimmobiliare, 2018)
The office sector represented the first choice for institutional investors in 2017, thanks to a perception of lower risk, minimum asset management requirements and greater transparency of the office market. Investment volumes reached approximately €4 billion; line with the 2016 figures (43 % of total investment transactions).
The retail sector, which has become increasingly popular since 2016, offering higher returns also in terms of capital value, slowed down during 2017, mainly due to three factors:
• the shortage of prime shopping centers in strategic locations;
• the increased complexity of transactions with a consequent extension of the times required to complete sales procedures;
• the general lack of high street products.
In terms of volumes, the retail market recorded approximately €2.2 billion, a share of approximately 25% of the total investment market (-20 % compared to 2016). At the end of December, however, additional preliminary contracts for Euro 500 million have been signed. The scarcity of institutional products remains, therefore, a key element for the retail sector, something which has always affected the growth of the Italian real estate market. Also, in 2017 most of the activity is in Northern Italy, with volumes of 47% of the total investment activities. However, transactions concerning the portfolios in real estate on the Italian territory were 30% of the total 2017 transactions. Milan remains the powerhouse of
43% (€ 4 billion) 24% (€ 2.2 billion) 12% (€ 1.16 billion) 6% (€ 0.6 billion) 14% (€ 1.3 billion )
Asset volumes type- Italy 2017
31 the Italian investment market, attracting institutional investors in search of assets in both the office and retail segments and representing 35% of the recorded volumes (Assoimmobiliare, 2018).
Figure 11: Cross-border vs domestic investment - Italy 2017
Source: (Assoimmobiliare, 2018)
Regarding players of the Italian real estate market, Italy continues to attract foreign investment, the international capital confirmed its leadership position in 2017 with 68 % of the invested money amounting to €6.2 billion which is more than other European dominant players of real estate market (i.e. UK, Germany, France, Netherland, and Spain) in terms of foreign to domestic investment.
Greater transparency in the Italian real estate market and an increased interest in non-core countries has in fact attracted foreign capital over the past five years. The interest of domestic investors also continues to grow steadily, with 3 billion invested during 2017. With regarding diversity of foreign investors, among international capital active on the Italian real estate market, European money (other European countries) continues to play a fundamental role, accounting for over 77% of foreign capital invested in 2017. Considering net investment activity, European capital is confirmed the leader of the Italian real estate market, representing approximately 27% of the total net investments. In the 77% of European investment, France (40%), Switzerland (21%) and UK (13%) are the lead roles according to Duff & Phelps Reag R&D (Duff & Phelps, 2017).
32% (€3 billion)
68% (€6.2 billion)
Cross-border vs Domestic Investment : Italy 2017
32
Figure 12: Foreign investors region - Italy 2017
Source: (Assoimmobiliare, 2018)
America invested approximately €68 million (approximately 11% of total foreign investment) and Asia invested €68 million (approximately 10% of total foreign investment) The office segment has proved the most interesting sector, with over €2.3 billion invested (37% of foreign-invested capital), followed by the retail segment with €1.9 billion transacted in 2017 (30% of foreign capital). The emerging sectors in 2017 were logistics and alternative asset classes, as shown by two particularly significant transactions concluded in 2017, for a total volume of €1.2 billion, such as the sale of the disposal of Logicor’s pan-European portfolio, the Italian assets of which were estimated to have been disposed for a total of €600 million, and the sale of portfolio of telephone exchanges by Benistabili SIIQ amounting to €620 million (Assoimmobiliare, 2018).
1.2 Real estate players and transactions
The objective of the chapter is to illustrate the most significant aspects of real estate investment in Italy, examining key aspects such as the identification real estate transfer methods and the choice of the investment (direct and indirect) for investors (both domestic and foreign), suitable for investment in real estate, including their legal form, as well as their regulatory and tax position. Without this descriptive part would be difficult to understand the impact of SIIQ (Italian REIT) industry by implantation of Sblocca Italia (unlock Italy) degree that will be analyzed in the following chapters. Since SIIQ has competitors from both domestic (REIF/SICAF) and international (REIT) towards attracting investors domestic and global perspective.
Europe 77.0% (€ 4.8 billion) France 40%, Swiss 21%, UK 13%, others 3% America, 11.0% (€0.68 Asia, 10.0% (0.62 billion) Middle East , 0.2%
(€0.012 billion) Others , 1.8% (€0.11 billion)
Foreign Investors Regions: Italy 2017
33
1.2.1 Real estate direct investment
Real estate property can be transferred in a variety of ways. However, the main typical mechanisms are two types. Which are as follows:
I. Asset deal: An acquisition of assets of the business from the from the operating corporation, consisting of the direct sale or the contribution of assets/ real estate business.
II. Share deal: An acquisition of shares of the operating corporation from the corporation’s shareholders, consisting of the transfer of securities representing the share capital of a special purpose vehicle whose assets include the real estate. Now, let us examine how the taxation applicable in two different scenarios individually.
1.2.1.1 Asset deals - Direct sale of real estate assets
The direct sale of a real estate asset has both direct and indirect tax consequences. Direct Taxation
For the seller: The direct taxation treatment depends first on the profile of the seller, according to personal characteristics, and the context in which the property is sold. Which means:
• Other income: for individuals who own a property as part of their personal estate, the sale of that property may give rise to income
• Business income: for individuals who hold a real estate asset as a part of their business activity, the sale of such assets may give rise to income. For corporations and commercial entities, only the classification as “business income” is applicable. A further relevant element in determining the methods for the sale of property assets is represented by the tax classification of the transferred asset, which may vary as follows:
• Operating properties analytically contribute to the formation of business income (taxable income and deductible costs) and give when sold to capital gains or losses. • Properties held as inventory stock (or real estate as stock in trade) forms part of the computation of business profits based on the changes in inventory stock and give rise to revenue when sold.
• Real estate assets held as part of an individual investment estate gives rise to income calculated on a lump-sum basis depending on the "cadastral value" or on
34 the actual rent decreased by flat-rate percentage because of costs and their disposal gives rise to capital gains or losses.
For the purposes of direct tax, the same classification and treatment8 also apply to assets which are being transferred in the context of a transfer of business concern. Capital gains will be subject to differ whether they are realized within or without business activity. If the seller acts outside of a business activity (an individual who not an entrepreneur or a taxpayer subject to the same substantial tax rules) the "other income" provisions apply and any capital gain realized9 is subject to
• taxation at progressive personal income tax (IRPEF) rates for individuals
• a proportional corporate income tax (IRES) rate for non-commercial entities or non-residents
These taxations are applicable, only the sale takes place within 5 years from the purchase of the asset. If a property is held for more than 5 years, the capital gain realized is not subject to tax. However, if the property being sold consists of building land the capital gain will always subject to tax regardless time being of the ownership.
Conversely, business activity (individual entrepreneur, company or commercial entity) the provisions for business income apply and any capital gain realized is subject to taxation
• at progressive IRPEF rates (for individuals)
• at proportional IRES rate (for limited liability companies or commercial entities) on the whole amount realized
regardless of the duration of the ownership (and so including property held for less than 5 years). In this case a capital gain can, at the taxpayer's choice, accounted for as part of taxable profits entirely in the tax year of realization, or if the assets have been held for more than three years will be taken on a straight-line basis in the period of realization and the following periods up to four10.
The regulations governing the sale of properties held as inventory stock deal with the transfer of properties, the production or commerce which forms the object of the business activity (business income) of the seller. From an accounting point of view, the
8 See, Article 176 of the Consolidated Income Tax Code (TUIR) 9 See, Article 68 of the Consolidated Income Tax Code (TUIR) 10 See, Article 86 (4) of the Consolidated Income Tax Code (TUIR)
35 purchase/production and sale process are normally represented by accounting for costs, revenues, and inventories.
Direct transfers of real estate can be made directly for monetary consideration (cash payment, offsetting of receivables or, as frequently happens, by taking over a debt guaranteed by a mortgage on the transferred property) or by contribution to capital or exchange. Both situations can give rise to a capital gain, comparing the seller's tax basis in the asset with the agreed sale price or with the arm's length value of the shareholding or asset received in consideration.
Assessing the direct tax impact for the seller arising from the sale requires an accurate analysis of the actual situation, with reference to numerous elements including, but not limited to:
• the date of purchase of the property: if the property has been held for some time this normally involves a significant difference between the purchase cost and the sale price and therefore a higher taxable capital gain.
• whether the seller has benefited from significant tax depreciation, which may have significantly reduced the original purchase cost of the property.
• the availability for the seller of tax losses to be carried forward or of other costs and expenses in the year the property is sold, enough to, at least partially, offset the effects of the taxable capital gain.
For the Buyer: As for the buyer, the direct sale of real estate assets does not normally involve any issue in terms of direct tax, as the price paid, increased by the costs incurred for the acquisition, represents the tax value of the property.
Table 3: Direct taxation for asset deal - direct sale
Type of sale
Seller/ buyer
Type
of Tax Income type
Type of property Type of customer (Individual who do not entrepreneur) non-commercial entities; non-residents Seller Direct
Tax Other Income Building
IRPEF (<5 years); No tax (>5 years) IRES (<5 years); No tax (>5 years) Building +
36 Asset deal-Direct sale Business Income Building or building + land Individual entrepreneur Limited liability companies or commercial entities IRPEF (tax year
or if more than 3 years up to 4 years)
IRES (tax year or if more than 3 years up to 4 years) Buyer No tax
Source: Personnel elaboration
Indirect taxation
Indirect taxes affect the sale of real property assets in a different way depending on the characteristics of the asset sold and the person selling it. Typical indirect taxes applicable to the disposable of real assets are the following:
I. Registration Tax (Imposta di registro)
Registration tax applies to a real estate "transfer" (sale or contribution to capital) at a proportional rate determined as follows:
• 9% of the value of buildings and building lands and 15 % of the value of agricultural land (standard rate);
• 2% of the value of the building if the conditions for the application of the "first home" rate apply.
Operational Buildings: For the sale of operational buildings subject to VAT (i.e. those sold by entrepreneurs or self-employed individuals), whether pursuant an exempt or taxable regime (including by option), registration tax applies in a fixed amount (€200) due to the principle is known as "alternation" (either VAT or registration tax can apply but never both)11.
Residential Buildings: The regulations governing the transfer of residential properties subject to VAT are different. In this case, the registration tax applies in a fixed amount (€200, because of the alternation principle mentioned above) only when VAT is applied where the transfer is a taxable supply, with an application of proportional tax 12; whereas
11 pursuant to Article 40 of Presidential Decree n.131/1986 (hereinafter "Consolidated Law on Registration
Tax")
12 The rate of VAT applicable to residential buildings is generally 10 %, except for luxury residential
buildings (categories: A/1, A/S and A/9) for which the rate is 22%, and buildings carrying the right to be considered a " first home, for which the I rate is 4%.
37 if the sale is VAT exempt, registration tax applies in a proportional measure of 9 % ( or 2 % if the property is a " first home ")
II. Value Added Tax (IVA)
VAT applies (including purchase and sale of real estate) that fall within the territorial scope of value-added tax (for properties located in Italy) carried out by VAT-registered traders (companies for the most part). The sale of individual tangible assets, if made by a VAT person, generally constitutes a sale of goods pursuant to Article 2 of Presidential Decree no. 633/1972. Regarding real estate transfers, however, certain distinctions must be made • The sale of non-agricultural lands (building lands) and which do not constitute an
appurtenance to the building is certainly subject to VAT at a rate of 22%
• The sale of buildings and related appurtenances both of "operational properties used in business and "residential" properties are subject to the standard VAT exempt treatment, unless
I. they are "new" buildings, built or having undergone substantial building works in the last five years like restoration, conservative renovation, refurbishment, and town redevelopment, or
II. where the seller explicitly exercises the option to apply VAT in the asset transfer deed.
In the case of the sale of buildings (whether "residential" or "operating"), when the supply is not exempt due to the taxpayer option for VAT in the transfer deed, the tax is charged (generally at the rate of 22% a) to VAT taxable persons for VAT purposes using the reverse charge" mechanism. There is a difference between VAT which must be paid over to the Tax Authorities and VAT applied through the reverse charge. In the first case, the seller requests payment of the tax from the buyer/transferee (by charging it when issuing the relevant invoice) and then proceeds to pay the amount that received to the tax authorities subject to offset against their own VAT credit. The tax paid by a buyer/transferee who is a VAT taxable person becomes a credit for the latter and can be offset periodically against the VAT due arising from sales carried out in the relevant period (a month or quarter), or (ii) subject to a request for a refund. When VAT is applied under the “reverse charge" mechanism, the buyer/transferee accounts for the VAT directly, by offsetting the VAT
38 payable against the VAT credit generated by the transaction rather than paying the VAT over to the seller.
Table 4: Registration and VAT tax for Asset deal - Direct sale
Type of tax Buying from Private seller
Buying from Private seller Buying from VAT registered Company Buying from VAT registered Company Buying from VAT registered Company Tax Primary property
Secondary Property Primary property Secondary Property Luxury Property Registration Tax 2% of cadastral value
9% for buildings and building lands;
15% for agricultural land
€200 €200 €200
VAT None None 4% of the sale price
10% of the sale price
22% of the sale price
Source: Personal elaboration
III. Mortgage Tax (Imposta ipotecaria)
Mortgage tax is applied to compliance formalities (transcription, registration, renewal, and annotation) involved in the transfer of real estate (or required to register a mortgage). The tax in fact is not applied13 to "residential" property whether subject to VAT or, not and on the sale of "operational" properties not subject to VAT, while the sale of "operational" properties subject to VAT both under exemption and taxability regimes, are taxed at a rate of 3 % of saleable value of the assets.
Table 5: Mortgage tax for asset deal - direct sale
Property VAT Exempt Subject to VAT
Mortgage Tax Residential None None
Residential (under construction or renovation)
€200 €200
Operational 3% of saleable value 3% of saleable value
IV. Cadastral Tax (imposta catastale)
On the other hand, applies to transfers that, by causing a change in registered owner of the property, require the registration of the transfer with the Land Registry. Like mortgage registry tax is also in fact disapplied for the “sales of residential properties”. It is applied in a proportion of 1% of the value of the buildings to the transfers of buildings used for business purposes subject to VAT1415.
13 The sale of buildings under construction renovation is a separate case, as mortgage and registration taxes apply in a fixed amount of 200 each.
14 See, Article 1 bis of the tariff attached to the Legislative Decree no.347/1990
15 These proportional taxes are reduced by 50 % where a real estate fund or real estate SICAF is party to the
39
Table 6: Cadastral tax for asset deal - direct sale
Residential Operational (transfer for business purposes)
Operational (transfer to REIF, SICAF or SIIQ/SIIINQ)
Cadastral tax None 1% 0.5%
Price Value (Valore Venale)
It is important to highlight that the taxable basis for registration, mortgage, and cadastral taxes is the “Valore Venale”, i.e. the market value of the property at the time of execution of the transfer deed. Even if, especially in transactions between independent professional operators, this value normally coincides with the price agreed and declared in the transfer deed, the determination of the "Valore Venale" of the properties being sold is increasingly subject to review and challenge by the tax authorities, especially for transactions more than a certain value. The availability, even at a later stage, of solid and technical evidence showing the criteria for determining the price of the sale is certainly a fundamental element in support of the correct calculation of the market value of the property at the date of transfer. The sale concern/business of application of VAT pursuant to Article 2 of Presidential Decree no.633/1972 and is subject to proportional registration tax rates of 3 % on elements other than real estate, and 9 % (building and, residential and operating buildings including related appurtenances) or 15% (agricultural land) on any element represented by real estate as discussed above in registration tax section. Several considerations can be made regarding responsibility for pre- year tax liabilities. Depending on the subject matter of the contract (transfer of individual assets or business concern), the liability for debts, including taxes payable, of the seller prior to the transfer is different. Here reference is made mainly to property taxes (council tax ICI, single municipal tax (IMU), tax for indivisible services (TASI) relating to individual property assets and indirect taxes due for the purchase of the property, but also to direct and indirect taxes(Italian Corporate Income Tax (IRES), regional tax (IRAP) and VAT) relating to the exercise of commercial activity carried out through all the sold operational assets.
Paying maintenance tax for your property in Italy are as follows V. IMU (Imposta Municipale Unica)
The IMU is the regular Italian property tax. Before 2012 the equivalent tax was the ICI. • IMU is a property ownership tax, so it’s the owner’s responsibility