Alma Mater Studiorum-Università di Bologna
Faculty of Engineering and Architecture
INTERNATIONAL MASTER COURSE
IN CIVIL ENGINEERING
Master thesis in
ADVANCED DESIGN OF STRUCTURES
APPLICATION OF CRESCENT-SHAPED
BRACES IN REINFORCED CONCRETE
STRUCTURES
Candidate: Supervisor: OMAR KAMMOUH Prof. STEFANO SILVESTRI Co-supervisor: Dr. MICHELE PALERMO
Session I
Contents
INTRODUCTION ... 1
1. Background ... 1
2. Executive summary and objective ... 4
3. Organization of the work ... 5
1. THE DEVICE... 8
1.1 Review of the analytical relationships of CSB ... 9
1.1.1 Equilibrium equations... 9
1.1.2 The lateral stiffness ... 10
1.1.3 The yield strength ... 12
1.1.4 Design formulas ... 13
1.2 Behavior of the device ... 14
1.2.1 CSB constitutive law (tension and compression) ... 14
1.2.2 Effect of the section profile ... 18
1.3 Positioning of the device ... 21
2. THE STRUCTURE ... 28
2.1 Geometry of the structure ... 28
2.2 Material ... 32
2.3 Analysis of load ... 33
2.3.1 Permanent loads on the floors ... 33
2.3.2 Partition walls which are not placed over the beams ... 35
2.3.3 Partition walls which are placed over the beams ... 38
2.3.4 Variable loads ... 39
2.4 Modeling ... 40
2.5 Modal Analysis ... 42
2.6 Elastic Response spectra (Serviceability and Ultimate) ... 44
3. METHODS OF ANALYSIS ... 47
3.1 Nonlinear Dynamic (Time-history) analysis ... 47
3.1.1 Codes regulations ... 48
3.1.2 Constructing the Accelerograms ... 50
INTRODUCTION
4. BEHAVIOR OF THE NAKED STRUCTURE ... 60
4.1 Linear analysis ... 60
4.2 Non-Linear analysis (The Actual Capacity Curve) ... 62
4.2.1 General ... 62
4.2.2 Nonlinear analysis of reinforced concrete sections ... 63
4.2.3 Nonlinear analysis results ... 67
5. BEHAVIOR OF THE EQUIPPED STRUCTURE... 70
5.1 Design of the CSB devices ... 70
5.1.1 Method I (flexible structures) ... 70
5.1.2 Method II (Stiff structures) ... 78
5.2 Analysis of the linear structure equipped with the non-linear devices ... 86
5.3 Non-Linear analysis (The Actual Capacity Curve) ... 87
5.3.1 Method 1: Nonlinear Time-history analysis ... 88
5.3.2 Method 2: N2 method ... 89
5.3.3 Comparison of the 2 methods ... 100
6. COMPARISON ... 102
7. CONCLUSION AND FURTHER DEVELOPMENT ... 105
Acknowledgements ... 107
1 | P a g e
INTRODUCTION
1. Background
The design of building structures that is capable of providing prescribed seismic performance is the fundamental objective of the Performance-Based Design Approach. Nowadays, Buildings are designed (or strengthened) in order to fulfill the predefined performances (Figure 1). Existing buildings in particular fall in the inacceptable performance area. Therefore, our aim is to bring them under the minimum safety level.
Figure 1- Performance-Based Design Objectives
Buildings in general are not characterized by a lateral force-displacement curve close to the desired seismic “Objective curve” (Figure 2). For this reason, specific system that is capable of
independently matching the required properties in terms of stiffness, strength, and ductility should be added.
INTRODUCTION
Figure 2- A qualitative objective curve
Building structures for their particular use must be capable of providing a high degree of safety, which is compatible with today's society expectations. With respect to earthquake input, the strategies commonly adopted for the seismic design of building structures may be substantially traced back to two strategies:
1) The maximization of the structural ductility capacity;
2) The minimization of energy transmitted by the earthquake to the structural system.
The first strategy (traditional approach) is based upon the hysteretic dissipation, which occurs when structural elements develop non-linear behavior. This excursion in the non-linear field leads to advantages in terms of energy dissipation, but at same time, to considerable damage in the structural system (beams and columns). The second strategy (innovative approach) is based upon innovative technologies for the seismic protection of building structures aimed at guaranteeing the capacity of the structure of facing strong earthquake ground motions without recourse to structural ductility as main resource. Examples of such seismic protection systems are added dampers and base isolators. It is thus clear that the first approach is characterized by
APPLICATION OF CRESCENT-SHAPED BRACES IN RC STRUCTURES
3 | P a g e
low cost but low efficiency, whilst, on the contrary, the second one is characterized by high cost but high efficiency.
It is gradually being recognized that effective means of protecting structures from earthquake forces are by way of using various methods of structural control. They are not only effective for mitigating earthquake forces, but also are equally useful in controlling undesirable vibrations of structures produced due to wind and other dynamic excitations. In addition, there are a number of other factors that have emerged in recent years that require the control of the structural response. These factors include increased flexibility of the structural systems, increased safety levels, stringent performance level, and economic considerations. As a result, research in the area of structural control has intensified since the 1980s and many structural control methodologies have been developed, with some now being implemented in practice.
Broadly, methods of structural control can be classified as passive and active control methods. In the passive control, the mass, the damping, stiffness, a combination of any two, or all are modified by adding some components into the structure. These components are actuated by the movements of the structure and provide control forces according to their dynamic characteristics. No external source of energy is required to activate the system. In the active control, an external source of energy is used to activate the control system by providing an analog signal to it.
The work presented in this thesis is directed towards the behavior of a new innovative lateral resisting system, namely “the crescent shaped braces”, when installed in reinforced concrete
structures. CSB is classified under the passive systems as it is activated when it is exposed to displacement. An in-depth study for the local and global behavior of this lateral system will be presented.
INTRODUCTION
2. Executive summary and objective
In this work, the global behavior of a new innovative passive technology for resisting the lateral actions induced by earthquakes, namely Crescent shaped bracing, will be studied in depth. The CSB, as a new system, has not been undergone much research. As far as the global behavior of structures is concerned, only the behavior of SDOF steel structures with this device being installed was studied in the past [1]
The aim of this research is to study the behavior of MDOF reinforced concrete structures equipped with CSB. In order to achieve this goal, an understanding study of the local behavior of the bracing element will be carried out using fiber-based finite element software (Seismostruct). Once the behavior (constitutive law) is determined, it will be possible to extend the research to cover the global behavior of the element (element+structure) through a real case study.
The preliminary design of structural elements has always been a main concern in the structural engineering world, and crescent shaped braces are no exception. For this reason, a performance-based design approach for both stiff and flexible structures equipped with crescent shaped braces will be introduced. In addition, a part of this research will be dedicated to examine the effect of positioning of the braces on the distribution of the internal forces in the structural elements. This will make it possible to tell which is the best position in terms of structural behavior and architectural limitations.
Different types of nonlinear analysis (static and dynamic) will be used in this study (ex, nonlinear Pushover and nonlinear time history analyses). This will increase the reliability of the results we obtain. I addition, a simplified analysis method called “The N2-method” will be implemented in this work. This method combines the pushover analysis of a multi-degree-of-freedom (MDOF) model with the response spectrum analysis of an equivalent
single-degree-of-APPLICATION OF CRESCENT-SHAPED BRACES IN RC STRUCTURES
5 | P a g e
freedom (SDOF) system. This can be an additional source of information from which we can obtain the global seismic demand for our MDOF structure.
The main objective in this work is to improve the global behavior of RC structures by adding pre-designed CSB devices. Those devices will be designed in such a way that the actual curve of the building matches the pre-defined objective curve. In order to attain this goal, the following tasks should be studied:
1. Local behavior of the bracing element;
2. A performance-based Preliminary approach for designing of the devices; 3. Positioning and distribution of the braces in the structure;
4. Global behavior of RC structure equipped with Crescent shaped braces.
3. Organization of the work
The work is presented in six Chapters. The first chapter, The device, provides an extensive coverage of the local behavior of the bracing device. A review of the analytical expressions of CSB will be discussed. Additionally, Numerical simulations using fiber-based software (seismostruct) will be performed in order to obtain the structural behavior (constitutive law) and the effect of the section profile on the local behavior of the bracing element. Finally, different alternatives of brace positions will be studied in terms of axial force distribution in columns and foundations.
The second chapter, the structure, deals with the case study structure. A full definition of the structure in terms of geometry, material, loadings, and modeling will be carried out. In addition, Modal analysis results will be discussed.
INTRODUCTION
The third chapter, static and dynamic analyses, provides an overview of the used analysis methods of multi degree of freedom systems. Methods include non-linear pushover analysis (static) and non-linear time history analysis (dynamic).
The fourth chapter, behavior of the naked structure, discusses the behavior of the case study structure without the bracing elements. Linear and non-linear analysis for the structure are performed. Linear analysis will be used to determine the level of forces induced by the earthquakes, while the nonlinear analysis will be performed to determine the capacity of the un-equipped structure. The non-linear behavior of the concrete elements will be defined (moment-curvature relationship) as it is necessary for the nonlinear analysis.
The fifth chapter, behavior of the equipped structure, deals with the global behavior of the system with the bracing elements being installed. As a first step we will introduce a performance-based method for dimensioning the steel CSB elements. Those braces will afterwards be inserted in the structure. Nonlinear analysis will be performed through static pushover and dynamic time-history analyses using the software SAP2000. This chapter includes an overview of a method called the N2-method, which combines the pushover analysis of a multi-degree-of-freedom (MDOF) model with the response spectrum analysis of an equivalent SDOF system in order to obtain the global seismic demand.
Finally, a comparison between the 2 structures (Equipped and Naked) will be carried out in order to check the fulfillment of our objective of reducing the amount of damage the structure undergoes when exposed to high ground motion levels.
CHAPTER 1
1. THE DEVICE
This section introduces a special lateral resisting element, herein referred to as Crescent Shaped Brace (CSB) (Figure 3). CSBs are characterized by a geometrical configuration which is ‘‘ad hoc’’ defined in order to provide the structure with prescribed multiple seismic performances,
within the performance based seismic design framework. [2]
For a specific building, the vertical resisting system is typically designed for the static loads and most likely is not characterized by a lateral force–displacement curve close to the desired seismic ‘‘objective curve’’. Thus, in order to translate the desired ‘‘objective curve’’ into the
actual structural response, a specific bracing system should be added, capable of independently matching the required properties in terms of stiffness, strength and ductility [3] [4].Common bracing devices (i.e. concentric stiff diagonal elements) do not usually allow to independently designing these three properties. Although many studies have been carried out on special typologies of steel bracing elements (e.g. eccentric bracing systems, hysteretic devices, friction devices, visco-elastic dampers, buckling-restrained braces, etc… [5] [6]), only few physical solutions allow to obtain a force–displacement response which is close to the ideal ‘‘objective curve’’ [4].
Recently, CSBs have been installed in a Hospital (‘‘Ospedale Maggiore’’) located in the city of Bologna, Italy, in order to connect the steel moment-resisting frames with two external reinforced-concrete cores. Before the installation of the devices, cyclic experimental tests were carried out.
THE DEVICE
9 | P a g e
Figure 3- The geometrical configuration of the studied CSB
In the present section, the mechanical behavior of the CSB is discussed with the objective of providing the designer with the necessary tools for the seismic design of buildings equipped with such devices. First, the elastic behavior of the CSB is studied in order to provide analytical relationships for the lateral stiffness and the yield strength (elastic limit). Second, the inelastic response is studied by means of extensive numerical simulations in order to assess the post yielding behavior under monotonic loading and the hysteretic behavior under reversed cyclic loading. In addition, the influence of some geometrical and mechanical parameters of the CSB is evaluated.
1.1 Review of the analytical relationships of CSB [2]
1.1.1 Equilibrium equations
From simple equilibrium considerations, the axial force, the shear force and the bending moment acting along the two elements are equal to:
APPLICATION OF CRESCENT-SHAPED BRACES IN RC STRUCTURES { ( ) ( ) ( ) ∫ ( ) ∫ (1) { ( ) ( ) ( ) ∫ ( ) ∫ (2) Where and represent the local longitudinal axes of the elements, while z represents
the abscissa along segment EG (Figure 3). The axial and shear forces are constant along the elements (thus can be simply indicated as , and , , respectively), while the bending moment varies linearly and achieves its maximum value at the knee point G:
(3)
1.1.2 The lateral stiffness
The lateral displacement d due to the horizontal force F can be evaluated by applying the principle of virtual works:
∫ ∫ ∫ ( ) ( ) ∫ ( ) ( ) (4) Where and are the axial and the flexural contributions to total deformation.
THE DEVICE
11 | P a g e By introducing and , after simple mathematical developments, the previous equationbecomes:
[ ( ( )
) ( ) ] (5) In order to obtain a more compact notation, the following two functions of and are introduced:
( ) √
√
(6)
( )
√ √ (7)Which allow expressing Eq.5as follows
[
( )
( ) ]
(8)After some mathematical manipulations, the lateral stiffness of the CSB can be expressed as follows:
(
( ) (
)
)
(9)
It can be recognized that the first term ( ) represents the axial rigidity of an ideal straight member, while the second term ( ) is a reduction factor due the geometry of the system. If the diagonal reference line of the CSB configuration is inclined with an angle H with respect to the horizontal line, the inclination should be taken into account as follows:
APPLICATION OF CRESCENT-SHAPED BRACES IN RC STRUCTURES
1.1.3 The yield strength
From the equilibrium considerations discussed in the previous section, it clearly appears that the CSB reaches the first yielding condition at the knee point G. By imposing the yielding condition ( , i.e. the maximum stress equals the yield stress of the material), the
following expression of the yield strength can be obtained:
(11) Alternately:
(12) Where:
( ) (13)
( ) (14)
The coefficients and represent the reduction factors that are to be applied to the pure
flexural strength ( ) and to the pure axial strength ( ) of the member in order
to obtain the effective yield strength, respectively. As illustrative example, Figure 4 displays as a function of for various steel profiles (i.e. for various ratios), for a fixed ratio equal to 0.04.
As observed before, increasing leads to a rapid increase of the flexural contribution. Practically, for larger than 0.10, the yield strength can be assumed equal to the pure flexural strength.
THE DEVICE
13 | P a g e
Figure 4- Coefficient as a function of
1.1.4 Design formulas
From a design point of view, it is useful to provide equations, which allow sizing a specific CSB knowing the target lateral stiffness ̅ and the target yield strength ̅ . If a section profile is chosen, Eqs. 9 and 11 can be rearranged in order to obtain direct design expressions for the normalized ‘‘arm’’ and the modulus of inertia J:
( ̅ ̅ )
(√ (
)
̅ ̅)
(15)̅ (16)
Equations 15 and 16 are derived assuming that the CSB axial deformability can be neglected with respect to the flexural deformability. From a design point of view, this assumption is reasonable for values of . The designer can use Eqs. 9 and 11, which are
of a general validity,but not explicit in terms of and , so that a trial anderror procedure should be used.
APPLICATION OF CRESCENT-SHAPED BRACES IN RC STRUCTURES
1.2 Behavior of the device
In this section, we will first study the post yielding behavior of the device “CSB” under monotonic loadings. After that, we will examine the effect of changing the device’s section profile on the device behavior in both tension and compression. In addition, a study of the axial forces distribution in columns and foundation will be performed because in practice we do not want to over-stress some foundations while leaving others unstressed. A good distribution of the axial forces is crucial in order not to oversize the foundations underneath the building. The axial force distribution is controlled by the configuration of the device. Therefore, different configurations will be tested and the results will be compared.
All experiments have been done using the finite element software “seismostruct”. Seismostuct is a fiber-based finite element package for structural analysis, capable of predicting the large displacement behavior of space frames under static or dynamic loadings, taking into account both geometric nonlinearities and material inelasticity. [Seismosoft [2014] "SeismoStruct v7.0 – A computer program for static and dynamic nonlinear analysis of framed structures," available from http://www.seismosoft.com]
1.2.1 CSB constitutive law (tension and compression)
The constitutive law of the crescent shaped brace is controlled by the configuration of the device (angle of force with respect to the line connecting the device’s both ends), the device’s geometry (lever arm, diagonal length, etc…), and the section characteristics (hardening ratio, yielding strength, stiffness, etc…). Without loss of generality, and for sake of conciseness, the
results presented in this section are referred to the case of the symmetric bilinear configuration (Figure 5). The post yielding behavior of the device has been studied using extensive numerical
THE DEVICE
15 | P a g e analysis carried out on fully non-linear finite models developed using the research software SeismoStruct v7.0.3 [7]
Figure 5- Geometrical parameters of the tested CSB (all dimensions are in mm)
1.2.1.1 Behavior in tension
The behavior of CSB under tension loading is firstly studied. The isotropic hardening parameter was set equal to 0.005. The section profile has been chosen to be HE200B European profile (steel S355).
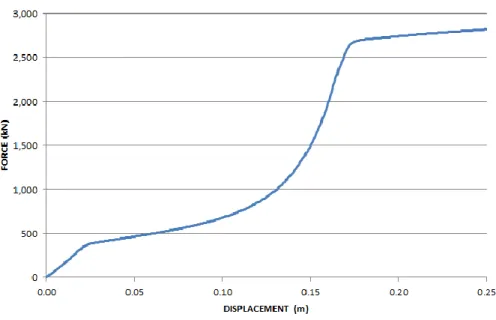
The system is subjected to an increasing horizontal force F up to the complete elongation condition. Figure 6 displays the response of force versus horizontal displacement.
APPLICATION OF CRESCENT-SHAPED BRACES IN RC STRUCTURES
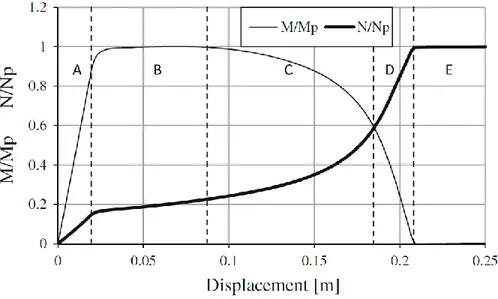
Due to the special geometrical shape of the CSB, the device is able to resist the elongation through its axial as well as its moment capacity at the knee point G, unlike the conventional braces that resist through their axial stiffness only. Figure 7 shows the variation of the axial and moment resistance with the horizontal displacement, while Figure 8 displays the decrease in the normalized arm versus the horizontal displacement.
Figure 7- Normalized Bending moment and axial force versus horizontal displacement
THE DEVICE
17 | P a g e Referring to Figure 7, it is possible to identify five different regions of behavior:
Region A: The response of the system in the elastic field. The behavior is mostly flexural. Region B: The bending moment at knee section reaches the plastic moment Mp and
remains constant while the axial slightly increases up to 0.2 Np.
Region C: The bending moment at knee section decreases while the axial force significantly increases. The behavior is both flexural and axial.
Region D: the bending moment at the knee section rapidly decreases up to vanish, while the axial force rapidly increases up to the axial capacity Np. The behavior is mainly axial. Region E: the axial force is constant and equal to the axial capacity Np. The system
behaves as a truss in tension.
It is interesting to note the gradual drop of the moment capacity of the CSB as the arm
decreases. When the normalized arm reaches zero, the moment capacity will be dissipated and thus the system will continue resisting through its axial capacity only, like a conventional brace or a truss in tensile configuration.
1.2.1.2 Behavior in Compression
Similarly, the device has been tested under compressive monotonic force while keeping the same geometrical configuration and section profile. Both mechanical and geometrical nonlinearities are included in the analysis. Figure 9 displays the response of compression force versus horizontal displacement.
APPLICATION OF CRESCENT-SHAPED BRACES IN RC STRUCTURES
Figure 9- Behavior of the CSB under Compression monotonic loading
Inspection of the curve shows that after yielding the CSB undergoes a softening behavior after reaching the critical force level. This is due to the geometrical nonlinearity effects.
1.2.2 Effect of the section profile
Using numerical simulations, different cross-section are tested in order to identify the influence of changing the section profile on the system behavior. The profiles may be classified based on the i/h ratio.
In order to have a comparable results, all sections are set to have the same inertia J as well as the same section depth h. the lever arm ratio is set equal to 0.1 for all analyses.
The steel yield strength has been assumed equal to 355 MPa (S355), while the hardening ratio . The mechanical parameters of the section profiles are listed in Table 1.
THE DEVICE
19 | P a g e Profile Full circular Full rectangular Tubular circular Tubular rectangular HE200B
( ) 5696 5696 5696 5696 5696 ( ) 18.46 20.00 20.00 20.00 20.00 ( ) 267.54 170.88 149.03 77.44 65.30 4.10 2.62 2.28 1.19 1.00 1.70 1.50 1.27 1.25 1.14 1.49 1.32 1.11 1.10 1.00 0.25 0.29 0.31 0.43 0.47 ( ) 372.50 303.31 256.27 252.76 225.46 1.65 1.35 1.14 1.12 1.00 ( ) 9497.70 6066.24 5290.54 2749.22 2318.15 ( ) 0.21 0.25 0.24 0.46 0.49 ( ) 351.67 319.28 316.21 300.21 294.24
Table 1- Main properties of the different cross-section profiles considered in the study
As in the previous sections, the system will be subjected to an increasing horizontal force F up to the complete elongation condition. Figure 10 displays the response of force versus horizontal displacement for all section profiles.
Figure 10- The response of tensile force versus horizontal displacement for all section profiles
0.00 1,000.00 2,000.00 3,000.00 4,000.00 5,000.00 6,000.00 7,000.00 8,000.00 9,000.00 10,000.00 0.00 0.06 0.13 0.19 0.25 TEN SI LE FO RC E (kN) HORIZONTAL DISPLACEMENT (m) Full circular Full rectangular Tubular circular Tubular rectangular HE200B
APPLICATION OF CRESCENT-SHAPED BRACES IN RC STRUCTURES
Inspection of Figure 10 and Table 1 allows observing that all profiles undergo the same qualitative post-yielding response. In detail:
Qualitatively, all profiles are characterized by almost the same ductility capacity (3/3.5). The strength between yielding (PO-2) and substantial hardening (PO-3) is proportional to
the plastic benefit of the cross-section .
The HE profile exhibits a limited hardening behavior with respect to those showed by the other profiles, whilst the full circular profile exhibits the largest hardening behavior. The two tubular profiles exhibit a quite similar hardening behavior. The full rectangular profile shows a response similar to that of the tubular profiles with a slightly larger global hardening.
In Region E, the strength is clearly proportional to the ratio, given that the
system is reduced to a truss in tensile configuration.
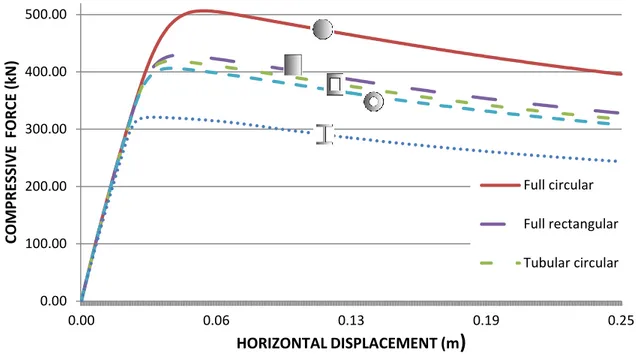
The five section profiles have been put under monotonic compressive force. Figure 11 shows the results of the static pushover analysis of all sections. As in the tension test, the full circular section resists the most, while HE200B is the first to reach yielding. The 3 other profiles, namely, full rectangular, tubular circular, and tubular rectangular show similar pre and post yielding behavior. All of the tested profiles exhibit softening behavior due to the geometrical non-linear effects.
THE DEVICE
21 | P a g e
Figure 11- The response of compressive force versus horizontal displacement for all section profiles
1.3 Positioning of the device
One of the important aspects is to figure out the best configuration of the device. There are plenty of configurations but not all of them are equally effective. Bracings transform lateral forces from earthquakes and wind into axial forces in the columns, and this force is not to be neglected. What we can do about it is to find the configuration that minimizes the amount of forces transmitted.
Another issue lies in the modeling of the device. The crescent shaped brace behaves differently in tension and compression, and thus it is not said that if 2 CSBs are put together then their behavior will be the same. This is because when the first is working in tension, the other will be working in compression (Figure 12), so each of the two braces will produce different force under the same displacement, and thus the axial force transmitted to the columns A and B (Figure 12) will be different. However, given that the system is exposed to a cyclic ground
0.00 100.00 200.00 300.00 400.00 500.00 0.00 0.06 0.13 0.19 0.25 C OM PRE SS IV E FORC E (kN) HORIZONTAL DISPLACEMENT (m
)
Full circular Full rectangular Tubular circularAPPLICATION OF CRESCENT-SHAPED BRACES IN RC STRUCTURES
motion, the axial force envelope in the 2 columns will be the same. This also applies for the foundations.
Figure 12- A configuration for a double CSB system
Given what we have said, two constitutive laws can be used in the modeling of the CSB lateral system. The first model (Figure 13) describes the real behavior (constitutive law) of a single CSB. It is clear that CSB develops hardening behavior when exposed to tensile forces, while it reaches much lower forces when it is put under compressive forces. This model is very accurate but in the practical point of view, it might be a little bit complicated to deal with. The second model (Figure 14) shows a symmetrical behavior in tension and compression. According to what we have said so far, this model does not represent the actual behavior of the system. Nevertheless, when 2 devices are inserted together (a double CSB system), when the first is exposed to a tensile force the second will be exposed to a compressive force, and thus the total resistance will be the summation of the behavior of a CSB device in tension and the behavior of another CSB in compression. Therefore, the behavior of a single CSB can be represented as the half of the sum of the constitutive laws of the device in tension and in compression. Although the
THE DEVICE
23 | P a g e lateral resistance will be the same when using any of the two models, the axial forces transmitted to columns and foundation should be checked if they remain the same.
Figure 13- Real constitutive law of a single CSB
Figure 14- Simplified constitutive law of a single CSB
-500 0 500 1000 1500 2000 2500 3000 3500 -0.25 -0.15 -0.05 0.05 0.15 0.25
Ax
ia
l f
or
ce
(kN)
Displacement (m)
Real behavior of a single CSB
Tension Compressio n -2000 -1500 -1000 -500 0 500 1000 1500 2000 -0.30 -0.20 -0.10 0.00 0.10 0.20 0.30
Ax
ia
l f
or
ce
(kN)
Displacement (m)
Simplified behavior of a single CSB
Tension Compression
APPLICATION OF CRESCENT-SHAPED BRACES IN RC STRUCTURES
In order to understand the problem in a better way, we have performed a little numerical experiment that can conclude all possible configurations with their corresponding axial forces transmitted to the columns and foundations. The best configuration is the one with the lowest level of axial force transmittance into columns and foundations.
Possible configurations:
Figure 15- CSB Possible configurations
A set of 7 time history analyses (SLV EQ level) for each of the 3 configurations was performed. The average of the 7 analyses was used, as recommended by Euro code 8. The axial forces in the columns and foundations are then compared (Table 2-Table 3).
Configuration A shows relatively high tensile and compressive forces in columns and foundations compared to configurations B and C. Configuration C shows no axial force in columns, and the lowest amount of forces in the foundations. Configuration B shows very little axial forces in the columns when using the real model of the device, while it shows no forces when using the simplified model. As for the level of forces in the foundations, configuration B lays between the other two configurations A and C. As a result, configuration C is considered the best among all 3 when it comes to stresses in columns and foundations. However, it is not always feasible to implement due to the geometrical and architectural constraints. Configuration B can be a good solution as it produces low amount of forces in both columns and foundations. Nevertheless, the beam can be exposed to very high stresses from the bracings and this can be an
A B C
THE DEVICE
25 | P a g e issue when the span is long. Configuration A, although it produces the highest level of forces in columns and foundations, and it is architecturally problematic, there is no interaction with the beam element. So picking the configuration depends on several factors such as the span length, the architecture’s desire, and the columns capacity, especially when the braces are used as a
strengthening technique, because in that case the columns are already there and have a defined capacity that we cannot exceed. Unlike in the case of design, in which we are free to define the capacity of our columns.
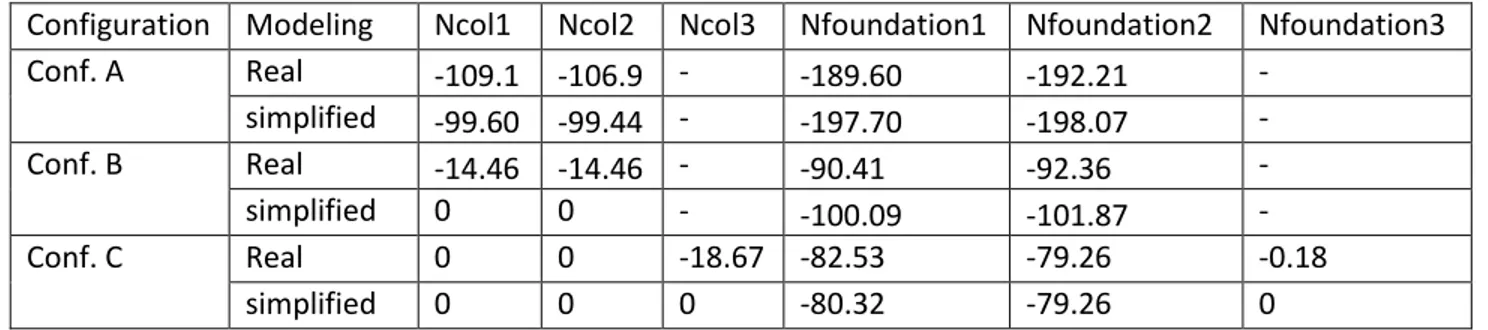
For configuration A, the comparison between the real model and the simplified model shows a slight difference. The simplified model is conservative in inducing tensile forces in the columns and foundations, while it underestimates the compressive forces by a maximum of 10 %. Practitioners must be aware that if they decide to use the simplified model they should take into account the underestimation of the compressive forces in the columns and the foundations. If, however, the designer decides to go with configuration B, results show that both models yield approximately the same results and thus both models are as reliable. As for configuration C, the tensile forces in some foundations are underestimated when using the simplified model, and thus the designer should be aware of that.
Configuration Modeling Ncol1 (kN) Ncol2 (kN) Ncol3 (kN) Nfoundation1 (kN) Nfoundation2 (kN) Nfoundation3 (kN) Conf. A Real 84.03 84.81 - 192.76 189.42 - simplified 99.44 99.60 - 198.07 197.70 - Conf. B Real 3.14 3.14 - 102.64 102.02 - simplified 0 0 - 101.87 100.09 - Conf. C Real 0 0 0.18 61.76 64.30 18.67 simplified 0 0 0 79.57 80.32 0
APPLICATION OF CRESCENT-SHAPED BRACES IN RC STRUCTURES
Configuration Modeling Ncol1 Ncol2 Ncol3 Nfoundation1 Nfoundation2 Nfoundation3
Conf. A Real -109.1 -106.9 - -189.60 -192.21 - simplified -99.60 -99.44 - -197.70 -198.07 - Conf. B Real -14.46 -14.46 - -90.41 -92.36 - simplified 0 0 - -100.09 -101.87 - Conf. C Real 0 0 -18.67 -82.53 -79.26 -0.18 simplified 0 0 0 -80.32 -79.26 0
Table 3- Compressive forces in columns and foundations induced by the braces
For a better representation, the results in the table are presented using bar-chart diagrams in order to allow visual inspection of the problem.
0 20 40 60 80 100
Conf.A Conf.B Conf.C
Tes ile fo rce ( kN)
Tensile Force in Column 1
Real Behavior Simplified behavior 0 50 100 150 200
Conf.A Conf.B Conf.C
Tensi le F o rc e ( kN )
Tensile Force in Foundation 1
Real Behavior Simplified Behavior 0 20 40 60 80 100
Conf.A Conf.B Conf.C
C o mp re ssi ve f o rc e ( kN )
Compressive Force in Column 1
Real Behavior Simplified behavior 0 50 100 150 200
Conf.A Conf.B Conf.C
C o mp re ssi ve F o rc e ( kN )
Compressive Force in Foundation 1
Real Behavior Simplified Behavior
CHAPTER 2
2. THE STRUCTURE
2.1 Geometry of the structure
The building under study is the elementary school "Castle Hill" of Bisignano (CS), Italy, which was put to use in 1983 (Figure 16).
The building is made of three stories with a roof pavilion on the top. The geometry of the plan is rectangular. The backbone consists of four four-bay frames in the secondary direction. The frames are connected in the transverse direction by clay hollow-block floors and edge beams, while the only internal secondary beams are those that support the stairwell. The roof rests on walls and curbs, which is in turn supported by the floor of the attic (3rd level).
Figure 16- Case study structure, Bisignano (CS), Italy
The structural system is shown in Figure 17-Figure 20. The columns have rectangular cross sections of dimensions b = 40 cm and h = 50cm, with the long side in the direction of the
THE STRUCTURE
29 | P a g e main frames. The beams that form the main frames have rectangular cross sections with b = 40 cm and h = 60 cm. The edge beams have instead b = 50 cm, h = 40 cm.
Regarding the stairwell, the side beams have square cross sections with b = h= 30 cm, unless one of those of the first layer, with dimensions of h = 60 cm, b = 25 cm. The structural thickness of the stairs landing is 15 cm.
The cover, unlike the floors of the other layers, are not straight lines from frames but instead it is made of a system of baffles perforated brick, 25 cm thick, and curbs having dimensions b = 30 cm and h = 24 cm. The baffles weigh themselves on the floor of the attic.
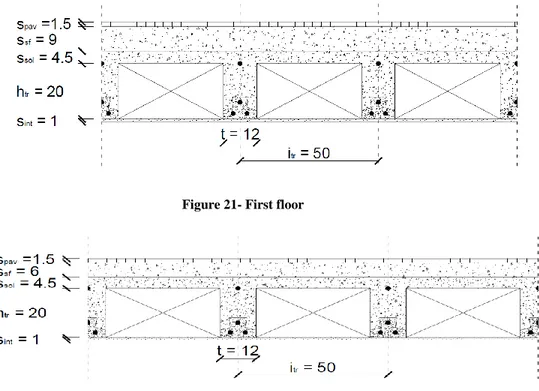
The slabs of the floors and the roof are clay Hollow-Block slabs with precast pre-stressed inverted RC T-beams, 12 cm wide at the base and 8 cm at the top. The joists are 12 cm wide, placed at a distance of 50 cm; the overall height of the joist, including prefabricated part and part cast in situ, is 20 cm. The thickness of the concrete slab is 4.5 cm for the floors of the first and second levels, 3 cm for those of the attic and roof. The Screed thickness is 9 cm on the floors of the first layer, 6 cm on that of the second layer, while it was absent on the attic and the roof. Finally, the thickness of the flooring is 1.5 cm on the floors of the first and second stories. The slopes are covered with roof tiles.
The geometry data were provided by the National Seismic Service of the Department of Civil Protection [SSN, and SSN in 2004, 2005 / a].
APPLICATION OF CRESCENT-SHAPED BRACES IN RC STRUCTURES
Figure 17- First level h= 3,18 m (From the upper surface of the foundation to the center of the first storey slab)
THE STRUCTURE
31 | P a g e
Figure 19- Third level h=9,9 m (From the upper surface of the foundation to the center of the third storey slab)
APPLICATION OF CRESCENT-SHAPED BRACES IN RC STRUCTURES
2.2 Material
The mechanical properties of the concrete were determined by ultrasonic and rebound hammer tests, performed on 10 columns and 8 beams. The results obtained were calibrated using compression tests on core samples taken from two of the pillars and beams. The average cubic strength “ ” was found to be 35.2 MPa, The characteristic cubic strength “ ” is equal to
24.6MPa. The secant modulus of elasticity was evaluated in = 25140 MPa, while the
tangent modulus is estimated to be: . Finally, the bulk density of the concrete was found to be = 2197 kg / m3; adding reinforcement, we obtain a density of about =
As for reinforcing bars, in the absence of a specific determination of the yield stress, it is assumed that they are of steel FeB38K, with
No experimental campaigns were conducted to determine the properties of the walls forming the facades and the partitions; then, for the subsequent analysis, reference was made to the conventional values. The bulk density of the wall board, including blocks, mortar and plaster, was estimated to be .
The density of the mortar was assumed equal to , in the absence of a
specific measurement. In addition, the density of plaster and tiles were assumed on the basis of usual values: and . For coating coverage (tiles, roof
tiles and blankets of insulation and waterproofing), a total weight per unit area is chosen to be . The clay blocks of the slab have a size b = 38 cm, h = 20 cm, L = 25 cm; the weight of one block is .
The material properties have been edited by the Service Sisimico National Department of Civil Protection.
THE STRUCTURE
33 | P a g e
2.3 Analysis of load
2.3.1 Permanent loads on the floors
The weight is calculated for a square area having a side of 1m ( ). In this area, two
joists, being the inter-axial distance = 50 cm, and eight hollow-blocks are included. On all levels the weights of the joists, the slab, and the blocks are considered. For the slabs of the first two levels, the screed, the flooring and the plaster are taken into consideration, while for the floor of the third level only the weight of the plaster is added. Finally, regarding the covering, the overloads due to the coating, which consists of mantle insulation/waterproofing and tiles are taken into account. Figure 21-Figure 24 illustrate the sections of the floors at the various levels.
Figure 21- First floor
APPLICATION OF CRESCENT-SHAPED BRACES IN RC STRUCTURES
Figure 23- Third floor
Figure 24- Roof Level Tiles [kN/m2] Screed (structural topping) [kN/m 2 ] Concrete topping [kN/m2] Joists [kN/m2] Hollow Blocks [kN/m2] Plaster [kN/m2] Roof coating [kN/m2] Total [kN/m2] 1 0.3 1.8 1.035 1.104 0.64 0.2 0 5.079 2 0.3 1.2 1.035 1.104 0.64 0.2 0 4.479 3 0 0 0.69 1.104 0.64 0.2 0 2.634 Roof 0 0 0.69* 1.104* 0.64* 0 1.0* 3.434*
Table 4- Permanent Loads for each floor
Table 4 shows the values of the different loads on each storey level. The asterisk (*) next to the values related to the roofing indicates that they are referred to an inclined surface at an average angle of = 15.65 °; the total load acting on a horizontal surface is obtained as:
( )
THE STRUCTURE
35 | P a g e Where and indicate the loads respectively on a horizontal and an inclined
surfaces.
2.3.2 Partition walls which are not placed over the beams
The distribution of partitions and curtain walls is shown in Figure 25-Figure 28. In this section, we consider only partitions that are not placed directly on the beams, which hereinafter will be also called "scattered".
The calculation is performed by multiplying the volume of the partitions of each plan by the density of the wall assumed to be 11 kN / m3, and then dividing by the area of the plan:
The results are summarized in Table 5, where for each floor the volume of the scattered partitions, its weight, and the load per unit area are reported.
Level Volume [m 3 ] Weight [kN] Load [kN/m 2 ] Ground 37.785 415.6383 1.298 1 17.013 187.1443 0.584 2 14.467 159.1418 0.497 3 12.285 135.1369 0.422
APPLICATION OF CRESCENT-SHAPED BRACES IN RC STRUCTURES
Figure 25- Ground floor
THE STRUCTURE
37 | P a g e
Figure 27- Second floor
APPLICATION OF CRESCENT-SHAPED BRACES IN RC STRUCTURES
Figure 29- Numeration of the columns
2.3.3 Partition walls which are placed over the beams
Considering the plans shown in Figure 25-Figure 28, and by referring to the numbering of beams indicated in Figure 29, we calculate the linear loads of the beams due to the partition walls that are placed on them.
The loads are considered uniform and constant over the entire girder. The calculation starts with an evaluation of the volume of the walls that lay on the beams. The volume is multiplied by the unit weight of the partition walls ( ). The result is then divided over the lengths of the
beams in order to obtain the load per unit length. The results are summarized in the following tables (Table 6-Table 7):
THE STRUCTURE
39 | P a g e
Beam or Girder Ground floor First floor Second floor
[kN/m] [kN/m] [kN/m] 1-5 4.31 6.19 6.24 6-10 2.95 3.44 3.47 11-15 6.28 4.19 4.23 16-20 5.76 5.79 5.84 1-16 8.57 8.33 8.39 5-20 9.77 10.08 10.15 13-18 0 10.33 10.40 14-19 10.19 10.33 10.40
Table 6- Calculation of loads due to partition walls that are placed on the beams of the ground, first, and second floors.
Beams Attic [kN/m] 6-7 1.43 9-10 1.41 11-12 1.43 14-15 1.41 13-18 2.38 14-19 1.28
Table 7-Calculation of loads due to partition walls that are placed on the beams for Attic
2.3.4 Variable loads
Variable loads are chosen according to [NTC, 2008]. First and Second Floors:
The third Floor: does not present any overload, because the attic is not accessible. As for the cover, it is also not accessible.
APPLICATION OF CRESCENT-SHAPED BRACES IN RC STRUCTURES
2.4 Modeling
The building under investigation was modeled using the software SAP 2000 V16 (Figure 30). Elements of type "beam" have been used to represent beams and columns. All axes are considered coincident, though, from the available documents, it seems that the beams of the stairway are slightly eccentric, the error is 5 cm for the beam 60x25 and 10 cm for the beam 30x40.
The Young's modulus, E, is the reduced tangent bulk modulus that we have previously estimated using the secant modulus of elasticity that we obtained experimentally. .
All distributed loads have been assigned on a one-way weightless shell element, which transfers the loads in the transverse direction. Load coming from partitions that are placed directly on the top of the beams is assigned as a linear meter load on the beams. No "rigid diaphragm constraint" was assigned, but instead the correct stiffness of the slab was introduced. It was seen later that all nodes moved exactly the same amount when exposed to lateral force, so rigid diaphragm could be a good assumption for our case study.
For the sake of simplicity, the roof has not been modeled, but instead its effects have been taken as distributed loads on the 3rd level (Attic). This assumption can be correct to a high extend because the highest point of the roof is only 2 m above the attic. In the addition, the set of walls that connect the attic with the roof are relatively very stiff compared with the frame structural system. Thus, both levels can be assumed to have same seismic behavior.
The inertial effects of the seismic action shall be evaluated by taking into account the presence of the masses associated with all gravity loads appearing in the following combination of actions:
THE STRUCTURE
41 | P a g e ∑ ∑
Where:
- is the combination coefficient for variable action . -
-
The combination coefficients shall be computed from the following expression:
The combination coefficients take into account the likelihood of the loads not being present over the entire structure during the earthquake. These coefficients may also account for a reduced participation of masses in the motion of the structure due to the non-rigid connection between them. According to Euro code 2:
APPLICATION OF CRESCENT-SHAPED BRACES IN RC STRUCTURES
2.5 Modal Analysis
According to Euro code 2 [8]:
1) This type of analysis shall be applied to buildings, which do not satisfy the conditions given in 4.3.3.2.1 (2) for applying the lateral force method of analysis.
2) The response of all modes of vibration contributing significantly to the global response shall be taken into account.
3) The requirements specified in paragraph (2) may be deemed to be satisfied if either of the following can be demonstrated:
- The sum of the effective modal masses for the mo [8]des taken into account amounts to at least 90% of the total mass of the structure.
- All modes with effective modal masses greater than 5% of the total mass are taken into account.
MODE Frequency (Hz) Period (sec) Modal Participating Mass Ratios
Ux Uy Rz 1 1.2656 0.790165 1.02E-09 0.7969 0.00044 2 1.8383 0.543966 0.00043 0.00046 0.83382 3 1.9918 0.502047 0.82938 2.25E-07 0.00043 4 4.2996 0.23258 6.25E-11 0.15325 0.00011 5 5.7004 0.175427 6.12E-05 9.56E-05 0.12789 6 6.2713 0.159456 0.13314 3.26E-08 0.00005658 0.963011 0.950706 0.96274658
Table 8- Frequencies, periods, and participating mass rations for the forst 6 modes
Following the Euro Code, it is enough to consider the first 6 modes because the sums of the effective modal masses for those 6 modes amount 96%, 95%, and 96% in Ux, Uy, and Rz direction respectively (Table 8).
THE STRUCTURE
43 | P a g e ( ) ( )
( ) ( )
( ) ( )
APPLICATION OF CRESCENT-SHAPED BRACES IN RC STRUCTURES
2.6 Elastic Response spectra (Serviceability and Ultimate)
For the horizontal components of the seismic action, the elastic response spectrum Se(T) is defined by the following expressions:
( ) [ ( )] ( ) ( ) [ ] ( ) [ ] Where: ( ) √( ) ( )
Normal life [years]:
For normal building, bridges, normal infrastructures, normal dams, etc. Occupancy factor: for Class III: Buildings with large crowds (school) Reference life [years]:
Coordinates of the site: latitude 39,512 ° N Longitude 16,286 ° E. Soil category: B Topographical category: T1
THE STRUCTURE
45 | P a g e The building under study is the elementary school "Castle Hill" of Bisignano (CS), Italy. According to the website: http://www.acca.it, Table 9 Gives the seismic hazard parameters for the four limit states in the city of Bisignano for structures with a reference life equal to 75 years.
Parameters of Seismic Hazard
Limit State Return Period /g [-] [-] [s] Fully Operational 45 0.089 2.29 0.296 Damage 75 0.116 2.286 0.321 Life safety 712 0.323 2.43 0.385 Near collapse 1462 0.426 2.48 0.419
Table 9- Seismic parameters for the location “Bisignano, Italy”
In this work, we are interested in studying the Damage LS (serviceability) and Life safety LS (Ultimate). Figure 32 shows the elastic response spectra that correspond to the 2 limit sates.
CHAPTER 3
47 | P a g e
3. METHODS OF ANALYSIS
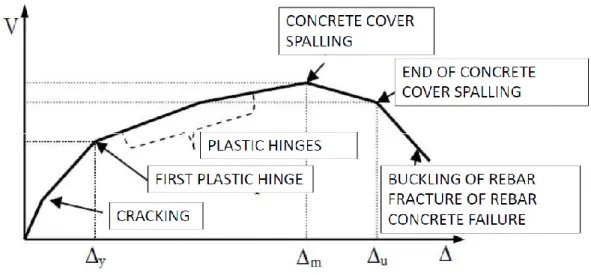
Two types of analysis are performed in this work. The dynamic time-history and The static pushover analyses. Figure 33 shows a typical reinforced concrete structure behavior (cracking, yielding, and failure).
Figure 33- A schematic representation of the non-linear behavior of RC frame structures.
3.1 Nonlinear Dynamic (Time-history) analysis
Nonlinear dynamic analysis utilizes the combination of ground motion records with a detailed structural model, therefore it is capable of producing results with relatively low uncertainty. In nonlinear dynamic analyses, the detailed structural model subjected to a ground-motion record produces estimations of component deformations for each degree of freedom in the model, and the modal responses are combined using schemes such as the square-root-sum-of-squares.
In non-linear dynamic analysis, the non-linear properties of the structure are considered as part of a time domain analysis. This approach is the most rigorous, and is required by some
METHODS OF ANALYSIS
building codes for buildings of unusual configuration or of special importance. However, the calculated response can be very sensitive to the characteristics of the individual ground motion used as seismic input; therefore, several analyses are required using different ground motion records to achieve a reliable estimation of the Probabilistic distribution of structural response. Since the properties of the seismic response depend on the intensity, or severity, of the seismic shaking, a comprehensive assessment calls for numerous nonlinear dynamic analyses at various levels of intensity to represent different possible earthquake scenarios [9]
3.1.1 Codes regulations
According to Paragraph 4.3.3.4.3 in Euro code 8 [10], If the response is obtained from at least 7 nonlinear time-history analyses with ground motions in accordance with 3.2.3.1, the average of the response quantities from all of these analyses should be used as the design value of the action effect Ed. Otherwise, the most unfavorable value of the response quantity among the analyses should be used as Ed. The choice of the accelerograms should be representative of the actual seismicity of the site, taking into account the characteristics of the seismic source, the conditions of the site, the magnitude, the distance from the source, and the expected maximum ground (PGA).
Seismic motion may be made by using artificial accelerograms and recorded or simulated accelerograms. As we lack real data (recorded accelerograms), we will obtain the ground motion through a set of artificial accelerograms.
APPLICATION OF CRESCENT-SHAPED BRACES IN RC STRUCTURES
44 | P a g e
Rules to consider when defining artificial accelerograms:
1) Artificial accelerograms shall be generated so as to match the elastic response spectra given in 3.2.2.2 and 3.2.2.3 for 5% viscous damping (ξ = 5%).
2) The duration of the accelerograms shall be consistent with the magnitude and the other relevant features of the seismic event underlying the establishment of .
3) When site-specific data are not available, the minimum duration Ts of the stationary part of the accelerograms should be equal to 10 s.
4) The suite of artificial accelerograms should observe the following rules:
a) A minimum of 3 accelerograms should be used (average value is not allowed);
b) The mean of the zero period spectral response acceleration values (calculated from the individual time histories) should not be smaller than the value of ag for the site in question.
c) in the range of periods between 0,2 T1 and 2 T1, where T1 is the fundamental period of the structure in the direction where the accelerogram will be applied; no value of the mean 5% damping elastic spectrum, calculated from all time histories, should be less than 90% of the corresponding value of the 5% damping elastic response spectrum. (EC8)
For our case study, we will run two groups of accelerograms, one for the serviceability limit state (Damage) and the other for the Ultimate limit state (Life safety). Each group is made up of 7 accelerograms; in this case, we will be able to refer to the average of the maximum values obtained from each individual analysis. If we, however, run less than seven analyses, it will be necessary to take the effect of the worst condition. Nevertheless, we steel need to use a minimum of three accelerograms for each group.
METHODS OF ANALYSIS
3.1.2 Constructing the Accelerograms
The design spectrum to be used for dynamic analysis of the school "Collina Castello" was built by the SIMQKE_GR software v2.7, made available by Prof. Piero Gelfi, University of Brescia, Italy. SIMQKE_GR generates statistically independent accelerograms, performs a baseline correlation on the generated motions to ensure zero final ground velocity, and calculates response spectra. One of the options in the program generates ground motions whose response spectra "match", or are compatible with, a set of specified smooth response spectra. The basis for the spectrum compatible motion generation is the relationship between the response spectrum values for arbitrary damping and the "expected" Fourier amplitudes of the ground motion (Vanmarcke, 1976). The earthquakes are synthesized by superimposing sinusoidal components with pseudo-random phase angles, and by multiplying the resulting stationary trace by a user specified function representing the variation of ground motion intensity with time. The program SIMQKE also has the capability to adjust, by iteration, the ordinates of the spectral density function to improve the agreement between computed and specified response spectra. Even without the last step, the average response spectrum (of a set of simulated motions) will match the smooth target spectrum very closely [11].
Using the software SIMQKE_GR we were able to obtain 2 groups of response spectra, each corresponding to one of the 2 limit states (SLD and SLV). Each group contains 7 non-smooth spectra matching the corresponding smooth response spectrum that we already obtained in section (2.6). In addition, and by using the same software, we were able to obtain 2 groups of time-history, with 7 accelerograms each. Those accelerograms will be used for performing non-linear time-history analysis.
APPLICATION OF CRESCENT-SHAPED BRACES IN RC STRUCTURES
55 | P a g e
3.1.2.1 Response spectra and Accelerograms for SLD
0 0.05 0.1 0.15 0.2 0.25 0.3 0.35 0.4 0.45 0 0.5 1 1.5 2 2.5 3 3.5 4 4.5 Spe ct ra l a cc e le ra ti on Se [ g] Period T [s]
SLD Response spectra
1 2 3 4 5 6 7 SLD Smooth spectrum -1.5 -1 -0.5 0 0.5 1 1.5 0 2 4 6 8 10 12 14 16 18 acc e le ra ti on a g (m /s^ 2) Time (s)Accelerogram 1-SLD
METHODS OF ANALYSIS -1.5 -1 -0.5 0 0.5 1 1.5 0 2 4 6 8 10 12 14 16 18 acc e le ra ti on a g (m /s^ 2) Time (s)
Accelerogram 2-SLD
-1.5 -1 -0.5 0 0.5 1 1.5 0 2 4 6 8 10 12 14 16 18 acc e le ra ti on a g (m /s^ 2) Time (s)Accelerogram 3-SLD
-1.5 -1 -0.5 0 0.5 1 1.5 0 2 4 6 8 10 12 14 16 18 acc e le ra ti on a g (m /s^ 2) Time (s)Accelerogram 4-SLD
APPLICATION OF CRESCENT-SHAPED BRACES IN RC STRUCTURES 53 | P a g e -1.5 -1 -0.5 0 0.5 1 1.5 0 2 4 6 8 10 12 14 16 18 acc e le ra ti on a g (m /s^ 2) Time (s)
Accelerogram 5-SLD
-1.5 -1 -0.5 0 0.5 1 1.5 0 2 4 6 8 10 12 14 16 18 acc e le ra ti on a g (m /s^ 2) Time (s)Accelerogram 6-SLD
-1.5 -1 -0.5 0 0.5 1 1.5 0 2 4 6 8 10 12 14 16 18 acc e le ra ti on a g (m /s^ 2) Time (s)Accelerogram 7-SLD
METHODS OF ANALYSIS
3.1.2.2 Response spectra and Accelerograms for SLV
0 0.2 0.4 0.6 0.8 1 1.2 0 0.5 1 1.5 2 2.5 3 3.5 4 4.5 Spe ct ra l a cc e le ra ti on Se [ g] Period T [s]
SLV Response spectra
1 2 3 4 5 6 7 SLV Smooth spectrum -3.5 -2.5 -1.5 -0.5 0.5 1.5 2.5 3.5 0 2 4 6 8 10 12 14 16 18 acc e le ra ti on a g (m /s^ 2) Time (s)Accelerogram 1-SLV
APPLICATION OF CRESCENT-SHAPED BRACES IN RC STRUCTURES 55 | P a g e -3.5 -2.5 -1.5 -0.5 0.5 1.5 2.5 3.5 0 2 4 6 8 10 12 14 16 18 acc e le ra ti on a g (m /s^ 2) Time (s)
Accelerogram 2-SLV
-3.5 -2.5 -1.5 -0.5 0.5 1.5 2.5 3.5 0 2 4 6 8 10 12 14 16 18 acc e le ra ti on a g (m /s^ 2) Time (s)Accelerogram 3-SLV
-3.5 -2.5 -1.5 -0.5 0.5 1.5 2.5 3.5 0 2 4 6 8 10 12 14 16 18 acc e le ra ti on a g (m /s^ 2) Time (s)Accelerogram 4-SLV
METHODS OF ANALYSIS -3.5 -2.5 -1.5 -0.5 0.5 1.5 2.5 3.5 0 2 4 6 8 10 12 14 16 18 acc e le ra ti on a g (m /s^ 2) Time (s)
Accelerogram 5-SLV
5 -3.5 -2.5 -1.5 -0.5 0.5 1.5 2.5 3.5 0 2 4 6 8 10 12 14 16 18 acc e le ra ti on a g (m /s^ 2) Time (s)Accelerogram 6-SLV
6 -3.5 -2.5 -1.5 -0.5 0.5 1.5 2.5 3.5 0 2 4 6 8 10 12 14 16 18 acc e le ra ti on a g (m /s^ 2) Time (s)Accelerogram 7-SLV
7APPLICATION OF CRESCENT-SHAPED BRACES IN RC STRUCTURES
55 | P a g e
3.2 Nonlinear Static (Pushover) analysis
Pushover analysis is popular in earthquake engineering, as is the response spectrum method of analysis. As the latter is a good equivalent static analysis (substitute) for the elastic dynamic analysis of structures to a given earthquake, likewise pushover analysis is a good equivalent non-linear static analysis (substitute) for the inelastic dynamic analysis of structures for the earthquake. Pushover analysis provides a load versus deflection curve of the structure starting from the state of rest to the ultimate failure of the structure.
The load is representative of the equivalent static load of a mode (generally taken as the fundamental mode) of the structure and may be conveniently taken as the total base shear of the structure. Similarly, the deflection may represent the deflection of any storey and may be conveniently selected as the top-storey deflection. [12]
The main idea is to apply a distribution of «increasing» forces in order to obtain something similar to an envelope of the maximum responses that we could get from nonlinear dynamic analysis with ground-motions of increasing intensities.
2D or 3D models of the structure may be used in this type of analysis. It is important to take into account the nonlinear behavior of materials as well as the nonlinear geometric effects. Particular distributions of lateral forces are applied and then are used to push the structure (Figure 34). The lateral forces are then scaled, proportionally to the initial distribution, in order to monotonically increment the displacement of a control point.
METHODS OF ANALYSIS
Figure 34- Example of different lateral force patterns
According to Euro code 8:
At least two vertical distributions of the lateral loads should be applied:
A “uniform” pattern, based on lateral forces that are proportional to mass regardless of elevation (uniform response acceleration);
A “modal” pattern, proportional to lateral forces consistent with the lateral force distribution in the direction under consideration determined in elastic analysis.
Lateral loads shall be applied at the location of the masses in the model. Accidental
eccentricity shall be taken into account.
The relation between base shear force and the control displacement (the “capacity curve”)
should be determined by pushover analysis for values of the control displacement ranging between zero and the value corresponding to 150% of the target displacement.
The control displacement may be taken at the center of mass of the roof of the building. The
CHAPTER 4
4. BEHAVIOR OF THE NAKED STRUCTURE
4.1 Linear analysis
A linear analysis of the structure is firstly performed in order to check the actual effects (base shear) of the seismic actions. In this analysis, all structural elements are asked to behave in a full elastic way and thus plastic hinge definition is not needed
Results from both static pushover analysis and dynamic time-history analysis will be plotted. This can be a preliminary check of the finite element Model, and a confirmation of the actions produced by the seismic motion.
Figure 35-Figure 36 show the pushover capacity curve of the elastic un-equipped structure together with the results of the time history analysis of 14 accelerograms in both directions.
Figure 35- The results of Pushover and time-history analyses for the naked linear system in X-direction
SLD: SLV: