PRODUCTION STRATEGIES FOR EXCEPTIONAL ORDERS MANAGEMENT
M. de Falco, M.E. Nenni, M.M. Schiraldi
INTRODUCTION
Increase of competitiveness, unpredictable changes in the demand, rise of new trade procedures generated from e-business models; these factors, during last years, had obliged industry to search for significant improvement in supply chain management and production processes. Since year, supply chain efficiency and flexibility constituted major study topics in operations management area; however, while in past times the research mainly focussed on the analysis and optimisation of single phases among the whole processes, the attention have recently converged on the performances and on the design of the supply chain in its entirety (Beamon,1998). Now, more than in past time, the pursuit of profit for an individual firm in the supply chain seems not to be a far-sighted strategy, if compared to the search for efficiency of a global system, where all players may have the opportunity to agree on production planning and operations management, as well as to share logistic and distribution processes, in order to cooperate and defeat competition. With such hypotheses, the design of flexible contractual agreement gains in importance; the negotiation of productive capacity among supply chain players is, indeed, often based on the basis of an indicative value, to which the customer reserves the rights to apply changes within a certain period of time from the delivery of the order. The capability of promptly reacting to the modification of his customer requests clearly becomes a major competitive advantage factor for the supplier. In order to effectively sustain this reaction, the supplier may be forced to speed-up all or some of his internal processes – first at all, the production process – in different ways according to the amount of the order variation; the maximum flexibility in the exploitation of the supplier potentialities is though needed, in the sense of “capability of reacting to modification of customers’ ne eds” (Brandolese et al., 1995). In this way, the supplier faces a number of chance for production strategies: an exceptional order which requires an immediate execution and a quick delivery indeed, may be carried out partly using stock and partly varying the production pace; the expediting strategy needs to be considered after the evaluation of lots of decision variables; moreover, the choice of a specific production strategy influences a number of aspects related to the production units itself: the behaviour of finite products and raw materials inventory levels, the overbalance of production rate, the variation in management costs, etc. On the other hand, the increased flexibility of the supplier gives advantage to the downstream units, which can diminish their inventory costs, decreasing in example their safety stock levels. The advantages for the customers coming from the possibility to launch an exceptional order which overcome the planned deliveries require the production unit to invest in flexibility, and this investment must be rewarded through an adequate increase in the supply contractual agreement cost. In this work the product-based expediting (Srivastav, 1999) case is taken into consideration; the expeditor represents the entity which continuously adds demands on the top of previously stated order specification (Miller, 2001). The attention devoted to these topics is witnessed by the rise of societies and fellowships which consider the study of expediting as their mission – first at all, the Expediting Management Association, EMA. The aim is to focus on the customer-supplier relationship and to quantify the increase in the contract cost, due to the opportunity for the customer to launch, in the interval between two planned deliveries, and exceptional order of a variable quantity of products, with immediate delivery. The influence of the production strategy choice on this capability will be analysed, and in order to do this, a formalization of the production strategy concept aligned with the main theories of operations management will be proposed.
PRODUCTION STRATEGIES AND MODEL HYPOTHESES
In this paragraph the concept of production strategy will be described: we will use a generic representation of a production unit in which only the basic functions of storage and processing are modelled. Under the hypothesis of re-order cycle inventory policy, the raw material inventory level may follow a linear emptying function which originates from the production rate PR, with periodic instantaneous fillings (with period T) due to the arrivals of the suppliers loads. Obviously, the finite products inventory level follows a similar but inverse trend, under the hypothesis of periodic (with the same period T) shipping of products to the customers. The production rate PR may be upper bounded by a maximum production rate PRmax determined through the analysis of the overall equipment efficiency in the industrial plant. The production unit may agree with its supplier on the periodic delivery of the quantity q of raw materia ls, and the same quantity of finite products may be provided by the production unit to its customers (the processing ratio between raw materials units and finite product units in this case should be 1:1). Now, if we define as production strategy a sequence of couples (PRi ; ∆ti) of certain production rates PRi maintained for certain time intervals ∆ti , in the described case we can pursue the simple production strategy
(PRavg ; T) [A]
so that
PRavg ⋅ T = q and of course q ≤ PRmax⋅ T, ∀ q ≥ 0
Clearly, the strategy (PRavg ; T) is only one among the infinite choices. One could chose, in example, the sequence
(PR1 ; ∆t1 ) ; (PR2 ; ∆t2 ) ; (PR3 ; ∆t3 ) where it stands
PR1⋅ ∆t1 + PR2⋅ ∆t2 + PR3⋅ ∆t3 = q and ∆t1 + ∆t2 + ∆t3 = T
In general, a levelled production strategy may be preferred to a production strategy in which different production rates are chosen in sequence; the possibility to keep an unique production rate for all the period T allows the minimization of the workforce cost, the optimization of the utilization rate of the resource and the industrial equipments, the simplification of the master production schedule generation. In this work though, the opportunity of choosing a not -levelled production strategy will be analysed.
Given the need of producing q finite products by time T, the production unit has the possibility to choose any production strategy which stands among the two extremes:
(PRmax ; ∆tA ) ; ( 0 ; T -∆tA ) [B]
( 0 ; T -∆tA ) ; (PRmax ; ∆tA ) [C]
where it stands
PRmax ⋅ ∆tA = q = PRavg ⋅ T
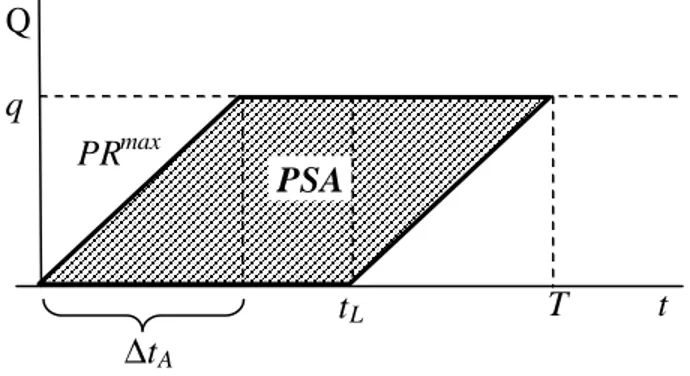
In comparison to C strategy, B strategy is clearly more robust to unexpected occurrences which may slow down or stop the production process. On the contrary, the average inventory level of finite products increases. A production strategies area (PSA) can be identified, which comprises all the feasible production strategies in period T. This area is depicted in Fig.1. Now the costs related to the choice of a certain production strategy will be analysed. In general, we will find:
- storage costs, because the choice of a production strategy influences the raw material and finite products inventory levels;
- production costs, because the choice of a production strategy determines the acceleration or deceleration of the production rate and different production rates are associated to different costs.
Fig. 1 – Production strategies area
Storage cost is calculated on raw materials (RM) and finite products (FP) average inventory levels. It is noticeable that RM and FP average inventory level are equal, on period T, in case strategy A is applied, while are complementary when strategies B and C are applied. The stockholding cost (SC) – related to cycle cost, thus excluding safety stock – can be derived computing the storage cost as a percentage τ of the material value.
As far as the production cost is concerned, in compliance to the more classic theories of project management, we can state that the production cost of one unit Cunit of finite product follows the function
i i unit t q k C C ∆ ⋅ + = min [1]
where Cmin represents a fixed minimum cost, k a constant which originates from the specific typology of production process, while PRi = qi/∆ti represents the production rate chosen for the processing of the selected finite product in the lot qi. The production costs (PC) borne in period T is then equal to
PC
∑
∆ ⋅ + ⋅ = i i i i t q k C q 2 min [2] where it stands T =∑
i ∆ti and q =∑
i qiHence the total cost (TC) associated with each production strategy, being TC = SC + PC , can be expressed as follow:
+ ⋅ ⋅ = 2 MP FP A V V q TC τ + ⋅ + ⋅ T q k C q min [3a] ⋅ ∆ + ⋅ ∆ − ⋅ ⋅ = T t V T t V q TC A MP A FP B 2 2 1 τ + ∆ + ⋅ A t q k C q min [3b] T Q t q PRmax ∆tA PSA tL
⋅ ∆ + ⋅ ∆ − ⋅ ⋅ = T t V T t V q TCC MP A FP A 2 2 1 τ + ∆ + ⋅ A t q k C q min [3c]
Where VFP and VRM indicate respectively the value of the unit finite product and that of raw material. It is noticeable that, from [3a, 3b], the choice of A strategy rather than B strategy allows a cost saving of:
[
]
− ⋅ ⋅ ⋅ + − = − max max 1 2 2 ) ( PR PR q PR k V V TC TCB A τ FP MP avg [4]While, from [3a, 3c], the choice of A strategy becomes more convenient than C strategy when the value of a finite product is “not so higher” than the value of the correspondent raw material, quantitatively when:
τ (VFP – VMP) < 2k ⋅ PRmax [5]
EXCEPTIONAL ORDERS MANAGEMENT
We will now analyse the case in which the production unit allows its customer to launch one exceptional supply order before the end of the period T. This order will request an additional amount of finite products qs, on top of the quantity q, to be delivered within a certain time interval (delivery time, DT). In general, in dependence from the moment in which the exceptional order is received, the production unit will need to increase its production rate, and eventually to use some stock in case PRmax ⋅ DT < qs. If the customer asks for immediate delivery (delivery time = 0), the production unit has the only possibility to satisfy the order with the stock already present in the finite product warehouse; and the inventory build-up function depends on production strategy which has been chosen at the beginning of T.
By the way of an example, the choice of strategy C will determine that the production unit will not be able to accept any exceptional order after time tL (because starting from time tL, the entire production capacity is devoted to the processing of the quantity q), while if the exceptional order is received before time tL , the production unit will not be able to satisfy it if qs > PRmax ⋅ ∆tL, where ∆tL indicates the time interval between tL and the moment in which the exceptional order is received.
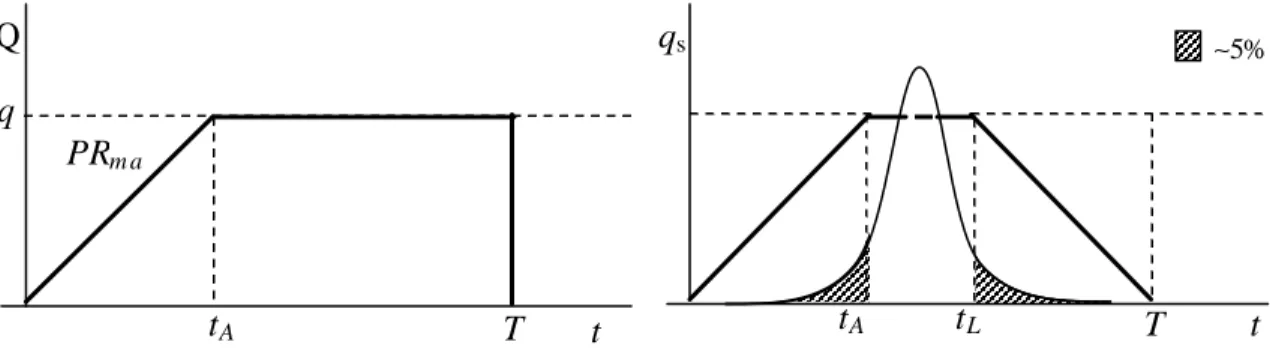
Let’s now consider the frequency distribution of the exceptional order receipt time: in general, the distribution will reach higher values in the middle of the period T while the probability of the receipt of an exceptional order near the beginning or the end of period T will be lower, due to the fact that the standard order has been just launched or is about to be launched; the frequency distribution of exceptional orders may be easily derived from the analysis of historical data. For our purposes, we can make the hypothesis of a generic frequency distribution whose probability of the order receipt for time t < tA and t > tL is actually little, (i.e. ∼ 5%). Then, in order to compare the results of the production strategies, we will restrict our analysis in the time interval [tA ÷ tL] in which the probability of the order receipt is higher. In this way, the choice of strategy B will determine that an exceptional order of amount qs = q can be satisfied with ∼ 95% of probability, as shown in Fig. 2.
On the contrary, the choice of strategy A will determine that the size of the exceptional order that can be satisfied varies on the time in which the order is receipt, but if we require the same service level as in case B before (95%), the maximum size of the exceptional order becomes qs = PRavg ⋅∆tA , as shown in Fig. 3 below.
Fig. 2 – Inventory build -up diagram and exceptional order amount in B strategy
Fig. 3 – Inventory build -up diagram and exceptional order amount in A strategy
This means that the production strategy choice deeply influence the maximum size of the exceptional order that can be satisfied by the production unit: the customer may ask for the possibility of launching an exceptional order of size qs = PRavg ⋅∆tA. In this case the production unit can adopt the simpler production strategy A; on the contrary, the customer may ask for the possibility of launching an exceptional order of size qs = q. In this case the production unit must adopt the production strategy B.
DETERMINATION OF THE SUPPLY CONTRACT COST
On top of the cost related to production strategy, in order to manage the exceptional request by the customer, two more cost components shall be considered, which have the same value independently from the choice of the production strategy:
- the increase of production cost related to the exceptional order acceptance (PCorder): once an order is received, the chosen production strategy maintains a constant production rate until the quantity q is replenished by the end of period T. In the worst case in which the order is received at time tL, the needed production rate will be PRmax. In this way, according to [1], the PCorder is upper bounded by
PCorder = qs (Cmin + k ⋅ PRmax) [6]
- the increase of raw material storage cost devoted to exceptional order satisfaction (SCorder). In general, given the supplier delivery time (DTS), the additional cost can be evaluated with τ ⋅ ⋅ ∆ ⋅ = MP A S s order V t DT q SC if DTS = ∆tA [7] Otherwise, the SCorder is upper bounded by
T Q t q PRm a tA T Q t q PRavg T t tA tL ∼5% qs T t qs tL tA ∼5%
SCorder = qs ⋅ VMP ⋅ τ [7b] Now, focussing on the customer-supplier relationship, the increase in the contract cost, due to the opportunity for the customer to launch, in the interval between two planned deliveries, and exceptional order of a variable quantity of products, with immediate delivery, will be quantified. The supply contract shall be indeed modified including:
- a fixed cost SCorder, related to the overstock of raw materials, evalutated through [6]; - a variable cost PCorder, borne only if the exceptional order is actually launched, related to
the processing of the replenishment of the finite product inventory after the order satisfaction, evaluated through [7] or [7b].
- a fixed cost TCstrategy, related to the choice of a certain production strategy and related to the maximum size of the order that the customer wants to be able to request.
This latter cost, being valid [5], can be configured as follows:
- if the customer asks for the possibility of launching an exceptional order of size qs so that qs = PRavg ⋅∆tA
the production unit can adopt the simpler production strategy A; in this case we have that the total cost (TC) related to the production strategy becomes:
TCstrategy = 0;
- if the customer asks for the possibility of launching an exceptional order of size qs so that qs = q
the production unit must adopt the production strategy B; in this case we have that the total cost (TC) related to the production strategy becomes:
TCstrategy = TCB - TCA according to [4].
The design of such flexible contractual agreement, in which the customer reserves the rights to apply changes within a certain period from the delivery of the order – pretending however high service levels and special requirements such as immediate deliveries – may become in the next future one of the key drivers of supply chain management. For this reason is of critical importance to deepen the research towards the quantification of the costs of the speed-up of the sspeed-upplier production processes – which changes in accordance to the amount of the order variation – and towards the design of flexible supply contracts which go beyond the simple concept of Service Level Agreement ; the opportunity for the customer to deal with his supplier as he would have dealt with an internal unit, prompt to react to any request which arises from the market, should be considered in these agreements. In this sense, this paper wants to represent a little step in this direction.
REFERENCES
- Stanley L.L., Wisner J.D. (2001) “Service quality along the supply chain: implication for purchasing” Journal of Operations Management – 19, 287-306.
- Beamon B.M., (1998) “Supply chain design and analysis: Models and Methods”, International Journal of Production Economics – 55, 281-294.
- Clark A.J., Scarf H. (1960) “Optimal policies for a multi-echelon inventory problems”, Management Science – 6 (4), 475-490.
- Shneeweiss C., Shneider H., (1998) “Measuring and designing flexibility as a generalized service degree”, European Journal of Operation Research – 112, 98-106.
- Parker R.P., Wirth A. (1999) “Manufacturing flexibility: measure and relationship ” , European Journal of Operation Research – 118, 429-449.
- Miller M.S., Graddy T.M, (2001) “Purchasing and Expediting – the true facts”, Institute of Management & Administration.