ALMA MATER STUDIORUM – UNIVERSITÀ DI
BOLOGNA
SCUOLA DI ECONOMIA, MANAGEMENT E STATISTICA
Corso di Laurea in Economia, mercati e istituzioni
To what extent have the EU referendum announcement and the Brexit
result had a negative impact on the UK’s economy?
(Economia internazionale)
Relatore: prof. Stefano Bolatto
Presentata da:
Nome e Cognome: Leonardo Zanobetti
Matricola: 721064
Abstract
On 23 June 2016, the British people decided to leave the European Union in a referendum that has inaugurated a period of considerable uncertainty. Before the vote, national and international organisations warned against the negative long-term implications that such an unprecedented decision could have for the UK’s economy, and generally for the everyday life of its citizens. This dissertation shall focus on the short-term implications of Brexit instead. Following the announcement of the referendum, and especially after the vote to leave, there have already been some negative consequences for the British economy. Uncertainty seems to be behind the deterioration of the UK’s economic climate, and poses a serious threat to its future economic stability.
Contents
Abstract ... 3
Introduction ... 7
Literature review ... 9
A love-hate relationship: a historical background ...13
A plan to unite Europe ...13
A blueprint for a single currency ...14
A matter of sovereignty ...17
A comedy of errors ...18
The short-term consequences of Brexit...20
The role of uncertainty...20
How the pound reacted ...22
Impact on the stock market ...26
The plunge in details: some case studies ...30
The case of government debt: the gilt market ...32
How the GDP has changed overtime ...33
How business confidence was affected ...35
The case of inflation and wages ...35
How consumer confidence was affected ...36
The real estate market ...37
Trends in immigration ...39
Graphs
Fig. 1: Inflation rate and unemployment in the UK, % change over one year earlier ...16
Fig. 2: GDP, % change over one year earlier ...16
Fig. 3: Do you feel a citizen of the EU? ...19
Fig. 4: Uncertainty and nominal GDP growth, over one year earlier...21
Fig. 5: Economic Policy Uncertainty Index for the UK...21
Fig. 6: GBP/USD exchange rate...23
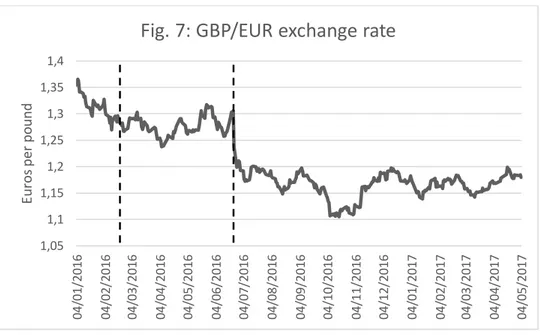
Fig. 7: GBP/EUR exchange rate ...24
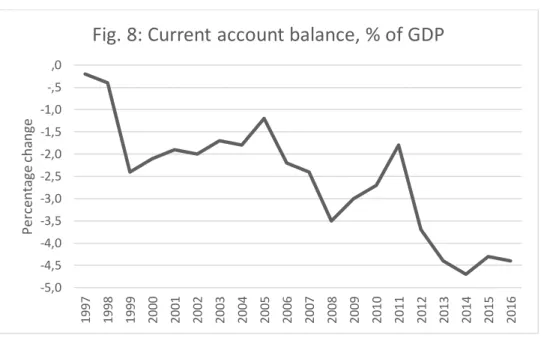
Fig. 8: Current account balance, % of GDP...25
Fig. 9: Finance and insurance, % of value-added ...27
Fig. 10: FTSE 100 ...28
Fig. 11: FTSE 250 ...29
Fig. 12.A, Fig. 12.B: Barclays ...31
Fig. 14.A, Fig. 12.B: IAG ...31
Fig. 15.A, Fig. 15.B: Taylor Wimpey ...32
Fig. 16: UK government's conventional gilts yields ...33
Fig. 17: UK GDP quarterly growth and levels of GDP for the UK ...34
Fig. 18: Business confidence index ...35
Fig. 19: Inflation rate and weekly growth of nominal wages, % over one year earlier ...36
Fig. 20: Consumer confidence index ...37
Fig. 21: House prices growth in England, % change over one year earlier ...38
Fig. 22: House prices growth in London, % change over one year earlier ...38
Fig. 23: Balance of UK migration (all nationalities) ...39
Fig. 24: Hate crime ...40
Tables
Tab. 1: Imports content of exports in the mid-2000s ...25List of abbreviations and acronyms
BCI Business Confidence Index CAP Common Agricultural Policy CCI Consumer Confidence Index CDS Credit Deafult SwapCPI Consumer Price Index
ECSC European Coal and Steel Community ECU European Currency Unit
EEA European Economic Area
EEC European Economic Community
EERM European Exchange Rate Mechanism EFTA European Free Trade Association EMU Economic and Monetary Union ESM European Single Market
EU European Union
EUR Euro
FDI Foreign Direct Investment FRED Federal Reserve of St Louis
FTA Free Trade Agreement
FTSE Financial Times Stock Exchange GBP Great Britain Pound
GDP Gross Domestic Product
HM Her Majesty
HPI House Price Index
IAG International Airlines Group
MFN Most-Favoured Nation
NHS National Health System
OECD Organisation for Economic Cooperation and Development ONS Office for National Statistics
RBS Royal Bank of Scotland
UK United Kingdom
UKIP United Kingdom Independence Party USD United States Dollar
7
Introduction
One year ago, on 23 June 2016, the United Kingdom voted to leave the European Union in a referendum that will probably make history. The sentiment of discontent with the European Union and the nostalgia for the ‘good old days’ of national sovereignty when Britain ruled the waves prevailed among British voters, who chose to back Brexit.
The referendum was held after the then prime minister, David Cameron, thought it was time ‘for the British people to have their say’, promising to address the growing disillusionment in his country with the European Union (Cameron, et al., 2013). A vote to leave triggered a period of political instability that still continues and recently culminated with an inconclusive election that produced a hung parliament in May 2017. The unprecedented decision to exit the European Union paved the way for long and complex negotiations. This has produced a climate of uncertainty that might have affected the UK economy in many different ways (Irwin, 2015).
One year ago, things were different. One pound still bought 1.46 dollars, David Cameron was still prime minister of the United Kingdom, Nigel Farage still insistently wanted his country back, his party, the UKIP, was still doing well, and the National Health System (NHS) was still being deprived of 350 million pounds a week that went to the European Union. One year later, all of that has changed, except for the NHS funding. Some positive figures, in particular those related to GDP growth, led some Brexit enthusiasts to downplay gloomy forecasts, claiming that data-rich warnings issued by respected national and international organisations were just scaremongers and threats (The Sun, 2016a; The Sun, 2016b; Daily Mail, 2016). Yet, reality seems to be slightly more complex than a headline in a newspaper. This dissertation shall attempt to investigate the changes in the UK economy by examining the economic impact of both the EU referendum announcement and its result in the United Kingdom. This dissertation shall begin by assimilating the key literature that has sought to estimate the economic consequences of Brexit. In addition to this, it shall present the historical background of the relations between the United Kingdom and the European Union, as it is essential to understand what led the country to reconsider its membership. It shall then focus on the impact of Brexit on the financial sector. The analysis shall firstly examine the effects on the pound’s value, before analysing the stock market, and additionally using certain companies on the stock market for in-depth analysis. The gilt market shall conclude the analysis of the financial sector. Then this dissertation shall take into account the effects of the EU referendum on industrial production and consumer spending. It shall examine GDP trends, and then the level of confidence of British firms. The analysis shall develop by investigating the patterns in inflation and unemployment, before turning to study consumers’ confidence
8
levels, saving ratio, and the real estate market. Also, it shall examine trends in immigration and hate crime, which could reflect an increasingly unfavourable climate surrounding inflows of people from other nationalities or with different ethnic backgrounds. In conclusion, this dissertation shall outline the main consequences for the UK economy in the short-term.
9
Literature review
The field of Brexit has received increasing academic interest in the last few years, especially after the decision to hold a referendum on the UK’s membership of the European Union was formalised. The academic debate has been lively. Most research has concluded that Britain is likely to be worse-off outside the European Union, although there is no consensus among researchers on what the extent of this loss would be (Armstrong & Portes, 2016). There are very few exceptions to this mainstream view (Dhingra, et al., 2016c). However, it is important to note that research has mainly focused on the long-term consequences of Brexit, while neglecting the short-term impact.
The most detailed analysis of the alternatives facing the UK in the long-term is the UK government’s analysis ‘The long-term economic impact of EU membership and the alternatives’ (HM Treasury, 2016a). As the withdrawal of a member state is an unprecedented event in the history of the European Union (PwC, 2016), the government’s analysis made hypotheses about possible scenarios consistent with the existent relationships of other countries with the European Union and determined three options. Although none of these alternatives would ensure full access to the European Single Market (ESM), all of these options would be costly, and the cost would be positively correlated with the benefits from being able to participate in the Single Market (HM Treasury, 2016a). The main drawback for the UK would be that no model outlined by the government would allow them to have their say on legislation implemented in the European Union, even that regarding the Single Market (Dhingra & Sampson, 2016a).
The option which would allow a continued access to the Single Market with few obligations would be joining the European Economic Area (EEA). As a member of the EEA, the UK would enjoy free trade of goods and services1, along with free movement of capital and people, the so-called ‘four freedoms’ at the
foundation of the European Single Market (European Union, 2010). The UK would independently run its own foreign policy, and would not be obliged to join the common currency, nor it would be part of the common customs union (Dhingra & Sampson, 2016a). Enjoying the benefits of the EEA comes at a cost: the UK would still have to comply with all the regulations regarding the Single Market, and it would need to contribute to the European Union’s budget, and savings on direct transfers are likely to be modest (Dhingra & Sampson, 2016a).
A second-best option would be striking a Free Trade Agreement (FTA) with the European Union. The terms of such deal would need to be negotiated, and this can take a long time (HM Treasury, 2016a). A bilateral
10
agreement would probably cover most of trade in goods, but it is likely to leave out the services sector (HM Treasury, 2016a), which is an essential part of the UK’s economy (Booth, et al., 2015). A precedent is set by the Swiss contractual model, which consists of a number of agreements negotiated on each specific issue, from education to aviation (Dhingra & Sampson, 2016a).
Resorting to the World Trade Organisation (WTO) terms would be the fall-back option. This would mean that the UK would trade with the EU under WTO rules, with the Most Favoured Nation (MFN) clause2. The
UK would be only one of the 162 entities involved in the agreements. This scenario would be limited to goods trade, and the UK would have to face an external tariff (and so would the EU) (HM Treasury, 2016a). To avoid the WTO conditions, a radical perspective is that proposed by Dhingra et al. (2016b) in which it is assumed that the UK could unilaterally decide to abolish all its tariff barriers. This would only apply to goods trade, and financial services would still be excluded.
Overall, the long-term impact would be negative, as most research seems to suggest. Uncertainty over the negotiations makes it difficult to predict what the impact of Brexit will be on the UK’s economy. Whilst all studies employ different forecasting models, they all tend to show negative figures for GDP growth and employment levels for the UK, explained by a loss in economic openness and competitiveness on international markets. The Treasury’s analysis estimates that in 2030 the GDP could be lower by 6.2 percent in case the UK manages to secure a FTA rather than being a member of the EU, or the loss could be -7.5 percent if it had to trade under WTO’s rules; the decline in GDP levels would be smaller (-3.8 percent) if the UK joined the EEA, with households being overall worse-off (HM Treasury, 2016a). The OECD’s study finds that the impact is less strong, but still negative in the same timeframe under a FTA or WTO scenario, with a 5.1 reduction in GDP levels (OECD, 2016b). Armstrong and Portes (2016) are more optimistic, although their findings are still negative, predicting a contraction in national output levels ranging of -1.8 percent or -3.2 percent in case of an EEA or a WTO scenario respectively. The main conclusion of these studies is that uncertainty would have consequences for the UK’s economic performance in the short-run, whereas in the long-term goods trade and financial services restrictions would hit the economy (Armstrong & Portes, 2016).
Losing access to the largest Single Market in the world would be detrimental for the UK in the long-run (Bank of England, 2015). The UK has very close economic ties with the rest of the European Union; by 2014, the UK received from the European Union 53 percent of its total imports, and exports to the bloc accounted for 45 percent of the total (Bank of England, 2015), with over 3 million export-related jobs (OECD, 2016b).
11
In the long-term, goods trade would be hit by tariffs that may be imposed and regulatory divergence would be costly, offsetting the potential savings generated by a reduction in red-tape (OECD, 2016b). In 2015, the UK had a trade deficit of 68.8 billion with the EU, accounting for 3.6 percent of its GDP, although the negative figures for goods trade were offset in part by a surplus in services that accounted for 1.1 percent of GDP, equivalent to 20.9 billion sterling pounds (HM Treasury, 2016a). By reducing ties with the European Union, multinational companies may consider the United Kingdom as a less suitable place where to have their headquarters for the Single Market, and might choose to relocate somewhere else in Europe (Irwin, 2015). Foreign Direct Investment (FDI) in the UK from the European Union would be lower, and a decline in investments would hit productivity and innovation (OECD, 2016b). The decline in FDI would be particularly marked for the financial sector; services and insurances are the main sector of the UK’s economy, accounting for almost 7 percent of the UK’s GDP (OECD, 2016b), and over 1 million jobs (Tyler, 2017). 80 of more than 350 banks in the UK are using London as a hub for their operations with rest of the EU (Bank of England, 2015). Even after the withdrawal, London could retain its comparative advantage in providing financial services, and the scrapping of European regulations which are perceived as a burden for financial markets would be an extra incentive for financial activity, although overall gains could be lower than expected (Springford & Whyte, 2014).
In the short-term, the main determinant of a negative outlook would be uncertainty (HM Treasury, 2016b). Not knowing what the outcome of the negotiations would be during the two-year period for the withdrawal negotiations would lead households and businesses to readjust their spending in line with expectations of being poorer in the future (HM Treasury, 2016b). Businesses’ confidence would be hit, with companies unsure about the level of demand and the UK’s ability to strike a deal that would allow it to continue being part of the Single Market (HM Treasury, 2016b). On the other hand, households would begin to save and their purchasing power would reduce with rising prices (HM Treasury, 2016b). Uncertainty would cause instability on financial markets, in terms of increased risk premia for credit and equity markets for companies and for the government (PwC, 2016). By analysing the pattern of Credit Default Swaps (CDS)3, it can be seen that the cost of shoring against risk of default rose after November
2015, consistent with negative forecasts for the British economy in case of a vote to leave (HM Treasury, 2016b). This would go along with a rise in inflation and a depreciation of the British pound on currency markets (PwC, 2016), as investors would start selling sterling-denominated assets fearing further falls in
12
value. This has been signalled by increasing volatility in the run-up to the EU referendum which continued also in the following months (HM Treasury, 2016b).
13
A love-hate relationship: a historical background
The UK has never been an enthusiastic member of the European Union (Baldini, 2016, p. 16). It has always enjoyed a unique degree of flexibility and selectivity that allowed the British government to choose to opt in or out depending on the policies discussed in Brussels (Emerson, 2015, p. 109).
A
PLAN TO UNITEE
UROPEWith the memories of WW2 still vivid, in 1950, the French foreign minister, Robert Schuman, put forward a plan to pool the production of coal and steel between Germany and France. The scheme was open to any other European state that wished to participate. Belgium, The Netherlands, Luxemburg, and Italy embarked on the project that led to the signing of the Treaty of Paris that established the European Coal and Steel Community (ECSC) in 1951. The British government rejected the proposal in the first place, primarily because it had no need to cut ties with the past, and, more importantly, because it considered the UK’s post-war economy far stronger than that of the other countries (Bache, et al., 2011, p. 97). Joining the ECSC would have meant losing sovereignty, a non-negotiable clause of the agreement.
Following the successful achievements in terms of cooperation within the ECSC, its member states signed the Treaty of Rome on 25 March 1957, establishing the European Economic Community (EEC) with the objective of a more inclusive general common market. The Treaty was the outcome of a careful balance between dirigisme and free-market economics (Bache, et al., 2011, p. 111). Its institutions, the Commission and the Council, were boosted by the economic achievements of the new scheme. In fact, the EEC’s start was successful, with trade among the six members surging by 166 percent in just over seven years, and industrial output growing by 52 percent (Mammarella & Cacace, 2013, p. 131). In 1959, British prime minister Harold Macmillian tried to interfere with the EEC project by establishing the European Free Trade Association, along with Sweden, Norway, Denmark, Switzerland, Austria, and Portugal, that was meant to be a less political and more economic form of integration (Mammarella & Cacace, 2013, p. 107), yet the advances made by the EEC were striking. The Economist (1957) describes the objective of a wide free-trade area led by the EEC as ‘encouragingly pragmatic’ and suitable for Britain’s interests because of the Treaty’s adaptability. Driven by the progress made by the EEC, the British government under Macmillian applied to be a member of the economic community in 1961, but the proposal was rejected by Charles De Gaulle’s government (Bache, et al., 2011, p. 128). When De Gaulle left politics in 1969, the UK applied again, but the application came at a time of great turbulence for the world’s economy. While the 1960s had been a period of constant and rapid economic growth, in 1971 a deep recession hit the global economy, as the
14
international monetary system collapsed. For the UK, this meant that it could not experience the positive aspects of the integration, and thus the people’s commitment to the ideal of European integration was not as strong as in the founding countries (Bache, et al., 2011, p. 136). In addition to this, the downturn was heightened by the first oil crisis in 1973. Along with the UK, Ireland, Denmark, and Norway sought to join the EEC. In Ireland and Denmark, referenda approved the membership, whereas Norway rejected it. The UK’s Tory prime minister, Edward Heath, refused to hold a referendum (Bache, et al., 2011, p. 136). Harold Wilson’s Labour Party won the 1974 general election, after having campaigned to renegotiate the terms of the membership, although Wilson himself had already sought to join the EEC in 1966 (Mammarella & Cacace, 2013, p. 127). Wilson was constrained between two sides of its own party; the majority willing to retain the UK’s full sovereignty, and a staunchly pro-European minority (Bache, et al., 2011, p. 136). A referendum was held in 1975 and the membership was backed by a large majority of the British voters in the 1975 referendum, with more than 67 percent of votes casted for continued membership.
A
BLUEPRINT FOR A SINGLE CURRENCYSoon it became clear that the next stage in the completion of the European integration project was the creation of a monetary union to reduce uncertainty in trade and complete the common market building (Bache, et al., 2011, p. 137). The Economic and Monetary Union (EMU) was established to address this issue in February 1971, and the project took the name of ‘snake in the tunnel’. The member states’ currencies, including those of the four new member states, were free to float within a certain range, linked to one another and to the American dollar (Bache, et al., 2011, p. 137). The US decision to withdraw from the international convertibility system was a first setback to the European project. The sterling was forced to resort to floating exchange rates after being targeted by speculation, and so were Italy, France, and Sweden. Following the failure of the EMU, the new Commission appointed in 1977, under the presidency of Roy Jenkins, a British politician, launched a new scheme to lay the foundations for a common currency, the European Currency Unit (ECU), backed by a basket of national currencies. Member states committed themselves to fix an exchange rate with the ECU within wider margins of fluctuations than those of EMU. In addition to this, a common reserve fund would support countries in preventing speculation. Yet, the UK refused to take part to this initiative.
T
HE YEARS OF DISCONTE NTIn the same years, the UK was facing an unprecedented rise in inflation which had sparked unrest among trade unionists, that culminated with multiple strikes that paralysed the country while the general
15
economic climate was rapidly deteriorating (Hay, 2010). Wage negotiations had failed, and the country had experienced the pains of the ‘three-day-week’, during which electricity was rationed (Hay, 2010). Social turmoil became evident in the trade-off between inflation and unemployment: in order to reduce the latter, the country experienced record levels of inflation, peaking at 25 percent in 1975 (Hay, 2010), while imports were becoming increasingly more expensive.
The election of Margaret Thatcher as prime minister of the UK in 1979 marked a turning point for the British economy. While the economic downturn was continuing, Margaret Thatcher rose the issue of Britain’s contribution to the budget of the European Community; the UK was the third net contributor in 1976, and the trend was suggesting that within a short time, Britain would become second (Bache, et al., 2011, p. 144). This was due to Britain’s tendency to import more from outside the EC than other members, in combination with very little gains from the Common Agricultural Policy (CAP), given the small size of the sector in Britain and its efficiency (Bache, et al., 2011, p. 145). The CAP was the main policy of the EC at that time, and only 2 percent of the British workforce was employed in agriculture and it constituted only 2 percent of national GDP (Mammarella & Cacace, 2013, p. 186). Eventually, Margaret Thatcher’s government managed to renegotiate the agreement with the Commission, reaching an end in 1985, after criticising the policy of the EC by saying that ‘it was not right that half of the total Community budget was being spent on storing and disposing of surplus food’ (Thatcher, 1988).
The Single European Act of 1985, approved under the Delors Commission, paved the way to a reform of the process of European integration by addressing the need of a new institutional framework and by formalising the objective of a monetary union, which was fiercely opposed by Margaret Thatcher (Bache, et al., 2011, pp. 159-160). In the meantime, the prime minister was carrying out structural reforms modelled on her free-market approach, which intended to reduce the role of the state in the economy by privatising state-owned companies and lowering taxes on businesses. Most importantly, Thatcher adopted a monetarist approach to macroeconomics, which consisted of control of the money supply and credit, in combination with ensuring a good state balance (Seldon & Collings, 2013, p. 56). The inflation-target objective adopted in the country contributed to reducing inflation from 18 percent in 1980 to 3 percent six years later, until it rose up again in the early 1990s, when it peaked at 7.9 percent and the country fell into recession again (Seldon & Collings, 2013, p. 66), as it can be seen in Figure 1. Unemployment followed a similar pattern, changing from 3 million people in 1979 to 1.6 million at the end of the 1980s, before increasing again with the economic downturn of the 1990s (Seldon & Collings, 2013, p. 66), also represented in Figure 1.
16
Source: (Office for National Statistics, 2017b), (Office for National Statistics, 2017g) Note: 2017 values for unemployment until March, for inflation until May
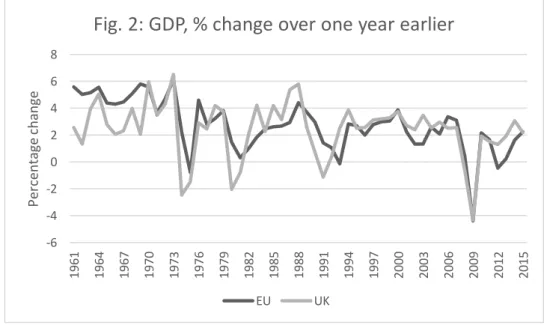
At the same time, the blueprint of Thatcher’s government was privatisations, which involved the sale of British Telecom and British Gas, and by 1990 50 previously state-controlled companies were sold or ready to be offered to private investors (Seldon & Collings, 2013, p. 68). On the side of the labour supply, Margaret Thatcher achieved her goal of reducing the influence and the power of trade unions, after a long dispute against them, which culminated in the 1982 Employment Act (Seldon & Collings, 2013, p. 68). From the early 1990s, the UK’s GDP started growing steadily at a faster pace than that of the European Union, as shown in Figure 2. In downturns, the UK did not perform significantly worse than the EU altogether.
Source: (World Bank, 2017a)
0 5 10 15 20 25 1971 1973 1975 1977 1979 1981 1983 1985 1987 1989 1991 1993 1995 1997 1999 2001 2003 2005 2007 2009 2011 2013 2015 2017 P er cent ag e cha nge
Fig. 1: Inflation rate and unemployment in the
UK, % change over one year earlier
Unemployment rate Inflation rate
-6 -4 -2 0 2 4 6 8 1961 1964 1967 1970 1973 1976 1979 1982 1985 1988 1991 1994 1997 2000 2003 2006 2009 2012 2015 P er cent ag e cha nge
Fig. 2: GDP, % change over one year earlier
17
A
MATTER OF SOVEREIGNTYMargaret Thatcher’s strenuous opposition to the single currency was one of the main reasons behind her fall in the early 1990s, along with a proposed poll tax4 that sparked protests all over Britain. Margaret
Thatcher defended her monetarist approach to control inflation over exchange rate stability, leading to frictions with her chancellor of the exchequer, Nigel Lawson, until she found herself outnumbered in her own Conservative Party (Seldon & Collings, 2013, p. 51). Her disagreements with the rest of the bloc became evident with her speech in Bruges (1988), where she called for a union that would ‘reflect the traditions and the aspirations of all its members’, with Britain refraining from being isolated and with its future as a part of the Community, that could foster prosperity and security for its people. Yet, she stressed that the guiding principle should be ‘willing cooperation among member states’, de facto rejecting the idea of closer integration, if it was not for economic cooperation.
‘But working more closely together does not require power to be centralised in Brussels or decisions to be taken by an appointed bureaucracy.’ (Thatcher, 1988)
To sum up, there were two points that Margaret Thatcher made in her speech: less political and more economic integration, and a more practical attitude towards policy-making (Thatcher, 1988). Her disengagement with the European cause made her to become isolated within her own party, eventually leading her to step down in November 1990, after Britain had (briefly) joined the European Exchange Rate Mechanism (EERM).
Margaret Thatcher’s speech from 1988 has striking similarities with that of another British prime minister, David Cameron (2013). In 2013, addressing the audience at Bloomberg in London, he underlined his view that the European Union needed to undergo a radical change. Again, the UK was said not to be wanting isolation, and the European Union was defined again as a means of prosperity and stability. Yet, Cameron highlighted his vision for a new European Union that would address some main challenges.
‘We urgently need to address the sclerotic, ineffective decision making that is holding us back. That means creating a leaner, less bureaucratic Union.’ (Cameron, et al., 2013)
Cameron pointed to the situation of the Eurozone, at European competitiveness and the role of national sovereignty in policy-making. In his speech, he underlined the role of the single market as the core of the European Union, combined with a higher degree of flexibility which would allow Britain to opt-out for
4 Also known as ‘community charge’, that everyone using a public service would be subject to pay, regardless of their
18
further integration to which it is not committed, and, by denying the existence of a European demos, a renewed primary role for national parliaments as representatives of democracy in designing policies. At the end of his speech, he committed himself to address the unresolved issue of membership in British politics by calling a referendum.
‘It is time for the British people to have their say. […] If we left the European Union, it would be a one-way ticket, not a return.’ (Cameron, et al., 2013)
The referendum would be called on a settlement between the European Union and the European Council regarding the role of the UK in the EU. One year later, Cameron announced that in case he would be elected for a second term as prime minister, he would call a referendum (Baldini, 2016, p. 28). After his re-election in 2015, Cameron sought to secure a deal with the European Council, which came after the meeting on 18 and 19 February 2016. The deal contained decisions concerning economic governance, competitiveness, and concessions in relation to migration policy and provisions for the financial district of the City of London (European Council, 2016). The deal would come into effect from the moment the UK would officially inform the Secretary-General of the European Council of its intention to remain part of the European Union. On the following day, the prime minister announced the date of the referendum, set for 23 June.
A
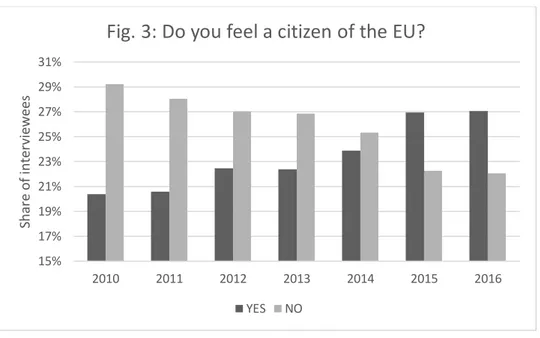
COMEDY OF ERRORSThe EU referendum debate seems to have arisen from the necessity to address British people’s detachment and hostility towards the European Union, perceived as a source of regulatory burden, with an unfair distribution of resources (Cameron, et al., 2013). British people have never showed a high degree of attachment to the European Union, but the trend changed in the year before the referendum (European Commission, 2017). Comparing figures for British interviewee who at least to some extent feel citizens of the European Union with those who do not feel the same, it is possible to see that the former increased constantly, and in 2015 becoming more than those who do not feel European citizens, as it appears in Fig. 3. British citizens who also felt they belonged to the European Union too represented 27 percent in 2016.
19
Source: (European Commission, 2017)
Note: affirmative or slightly positive answers are ‘Yes’, whereas negative or slightly negative responses are counted as ‘No’.
Possibly, the rise was due to increased awareness of the European institutions, because they became the centre of the EU referendum debate. Yet, the referendum saw the UK choosing Brexit, with 51.9 percent of voted casted for leave the European Union, and a turnout of 72.2 percent (The Electoral Commission, 2016). As a consequence of the result of the referendum, Cameron resigned, calling for the need of ‘fresh leadership’ (The Guardian, 2016a). After a contest inside the Conservative Party, Theresa May, former Home Secretary, was chosen to be the next prime minister, and she took office on 13 July 2016. Only after nine months since the Brexit vote the process to leave the European Union officially started, when a letter notifying the European Council of the intention to leave was delivered to its president, Donald Tusk, according to procedures outlined in Article 50 of the Lisbon Treaty. Yet, progress on the actual start of negotiations seems to have been little until recently; in fact, on 18 April 2017 snap elections were called to ensure that the government has the necessary stability to start negotiations under a ‘strong and stable leadership’ (The Telegraph, 2017). General elections held on the 8 June resulted in a hung parliament, with the Tories losing 13 seats in the House of Commons although gaining 5.5 percent compared to general elections in 2015, forcing them to seek to form a coalition government with the Democratic Unionist Party (DUP) (BBC, 2017a). Thus, the political gamble of Theresa May does not seem to have paid off, as her majority shrunk, making it more unlikely for the government to move together and speed up in the Brexit talks. 15% 17% 19% 21% 23% 25% 27% 29% 31% 2010 2011 2012 2013 2014 2015 2016 Sha re o f int er vi ewees
Fig. 3: Do you feel a citizen of the EU?
20
The short-term consequences of Brexit
Brexit is supposed to happen within two years of the official notification to the European Council of the United Kingdom’s intention to leave. Yet, such a decision has already produced effects on financial markets and real economy, and sometimes they seem to contradict forecasts for what would happen once the United Kingdom leaves the European Union. A mismatch between immediate consequences and forecasts does not imply that predictions are wrong; simply, it is about different timeframes.
T
HE ROLE OF UNCERTAINTYBrexit is a leap in the dark. A member state exiting the European Union is a totally unprecedented event (PwC, 2016a). Research has tried to ascertain possible scenarios for the United Kingdom after its exit from the European Union, and econometrics has sought to precisely quantify gains and losses, winners and losers, but only from the moment Brexit would actually happen. Reality tells us that the road to that moment is long and winding, and negotiations so far have been particularly slow. This has triggered a climate of heavy uncertainty that threatens to harm the UK’s economy.
To a certain degree, uncertainty is an inherent factor in the economy; rational economic agents should use all the information available to them to make the best decision for their interests. The case of Brexit is different: the British economy has received an uncertainty shock, with unpredictability surging suddenly as a result of largely unexpected political developments that are likely to have strong implications for the economy.
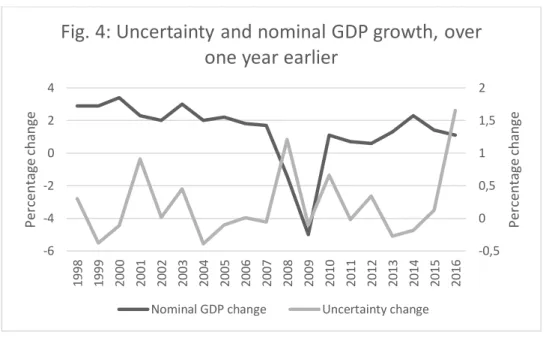
Recent history of the United Kingdom seems to suggest that there is some inverse relationship between economic performance and uncertainty. During the most recent financial crisis in 2008, economic growth plunged, while an indicator elaborated by the Federal Reserve of St Louis (2017) surged, as shown in Figure 4. Plotting together GDP growth and uncertainty change, it appears that when the economy moves downward and production slows, uncertainty rises. After the financial crisis, uncertainty peaked again by the end of 2015, reaching over 1.5 percent in 2016, as the possibility of exiting the European Union became increasingly real and GDP started growing at a more modest pace.
21
Source: (Eurostat, 2017), (Baker, et al., 2017)
The announcement of the EU referendum, and especially its outcome, are likely to have contributed to an increase in the feeling of uncertainty, as it appears in Fig. 5, and this might have changed investors’ expectations to negative. The uncertainty indicator shows rising uncertainty since January 2016, around the time when the referendum was announced, although the rise could be due to other factors. Causality seems to be clearer later in the year, when from May the trend is markedly upward. In June 2016 uncertainty stood at over 799 points, hitting a record high in July at over 1140 points.
Source: (Baker, et al., 2017)
-0,5 0 0,5 1 1,5 2 -6 -4 -2 0 2 4 1998 1999 2000 2001 2002 2003 2004 2005 2006 2007 2008 2009 2010 2011 2012 2013 2014 2015 2016 P er centa ge cha ng e P er cent ag e cha nge
Fig. 4: Uncertainty and nominal GDP growth, over
one year earlier
Nominal GDP change Uncertainty change
0 200 400 600 800 1000 1200 Ja n-1 5 Feb -1 5 M ar -1 5 Ap r-1 5 M ay -1 5 Jun -1 5 Jul -1 5 Au g-15 Sep -1 5 O ct -1 5 N ov -1 5 D ec-1 5 Ja n-1 6 Feb -1 6 M ar -1 6 Ap r-1 6 M ay -1 6 Jun -1 6 Jul -1 6 Au g-16 Sep -1 6 O ct -1 6 N ov -1 6 D ec-1 6 Ja n-1 7 Feb-17 M ar -1 7 Ap r-1 7 Index
Fig. 5: Economic Policy Uncertainty Index
for the UK
22
Given the rise in unpredictability linked to the referendum, it is possible that uncertainty would be one of the channels through which economic performance of the UK will be affected.
Uncertainty is likely to have hit the UK economy twice. Firstly, there was no consensus among pollsters about the outcome of the referendum from the moment it was called, with the margin getting narrower as time passed (Financial Times, 2016). Secondly, uncertainty has been the natural consequence of a vote to leave, with the UK definitively confirming its intention to regain full sovereignty. The government committed itself to honour the will of British people, thus triggering a period of uncertainty about the short-term and long-term status of the UK. As a consequence, uncertainty is one of the main channels through which the UK’s economic performance will be affected (Irwin, 2015).
Uncertainty might cause harm to the economy through several different channels. In general, in an uncertain climate, economic agents tend to reassess their financial position, devoting less resources to consumption and increasing savings (OECD, 2016a). The first effect could result in a contraction of demand for goods and services. Households, companies, and investors would immediately readjust their spending decisions to shelter from potentially worsening economic conditions by increasing their savings or contracting more debt in the form of loans. Decisions would be made with the idea of being worse-off in the future. Firms would have no certainty about the continued internal and external demand for their products and services. In addition to this, the threat of tariff and non-tariff barriers in trade with the EU could delay investments in new markets abroad. Uncertainty could also impact on foreign direct investment (FDI), especially in terms of political instability; the presence of institutional soundness is one of the factors that has made the UK attractive for businesses over the years (Irwin, 2015). Lowering investments would also affect hiring decisions, causing companies to reduce vacancies or to respond to a decrease in demand by making workers redundant. Job security would be hit, and households would increase savings even more to cope with increased instability of the labour market. Financial markets would be more volatile and more vulnerable to panic shocks. Financial investors might choose to relocate their investments abroad, or they might ask for higher risk premia to compensate for increased default risks. Borrowing would be more expensive for companies and households, but also for the government. Uncertainty would contribute to a self-fulfilling crisis that could only be curbed by clarity about the future.
H
OW THE POUND REACTEDThe pound has become an accurate thermometer for the heated climate surrounding Brexit. Throughout 2016 and during the first months of 2017, the exchange rate between the pound and some of the major
23
currencies was impacted by the uncertainty about the future of the United Kingdom outside the European Union.
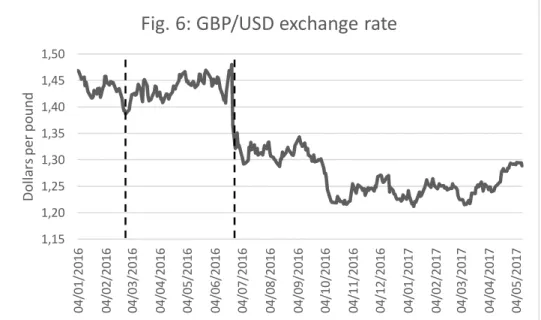
The pound’s exchange rate against the dollar is shown in Fig. 6, whereas the pound against the euro is presented in Fig. 7. The exchange rate was volatile throughout the first months of 2016, with a standard deviation of 0.014 against the dollar and a slightly higher standard deviation against the euro, at 0.023, from the beginning of January 2016 until 20 February 2016. Although the exchange rate was slightly volatile in the first period of 2016, the pound sharply depreciated after David Cameron’s announcement of the EU referendum and the former influential Mayor of London Boris Johnson’s public decision to support the leave campaign, hitting a 7-year low record against the dollar on 22 February 2016 (PwC, 2016a). The fall of the pound was rather modest in comparison to the value at the beginning of the month, but after it went down by 1 percent, a period of heightened volatility began. Within one month, the pound fell from 1.46 against the dollar to 1.39. Similarly, against the euro the pound dropped from 1.33 euros for one pound to only 1.27 euros.
Source: (Board of Governors of the Federal Reserve System, 2017)
1,15 1,20 1,25 1,30 1,35 1,40 1,45 1,50 04 /0 1/ 20 16 04 /0 2/ 20 16 04 /0 3/ 20 16 04 /0 4/ 20 16 04 /0 5/ 20 16 04 /0 6/ 20 16 04 /0 7/ 20 16 04 /0 8/ 20 16 04 /0 9/ 20 16 04 /1 0/ 20 16 04 /1 1/ 20 16 04 /1 2/ 20 16 04 /0 1/ 20 17 04 /0 2/ 20 17 04 /0 3/ 20 17 04 /0 4/ 20 17 04 /0 5/ 20 17 Dol la rs per po un d
24
Source: (European Central Bank, 2017)
A considerable fall happened the day after the referendum, when the outcome was officially announced. In the run-up to the vote, investors had shown confidence in a remain vote, as the pound appreciated, being traded for 1.48 dollars and 1.31 euros on 23 June. As markets opened on the following day, sterling dropped, ending up losing almost 9 percent against the dollar and depreciating by 5 percent against the euro. By the end of the day, one pound could only buy 1.36 dollars, and just 1.24 euros. The pound kept falling in the aftermath of the referendum, as the dollar appreciated by 3 percent against the pound on 25 June. At the beginning of July 2017, the pound had depreciated by over 10 percent against the dollar, and it had fallen by more than 8 percent against the euro. Standard deviation against the dollar rose to 0.086, and it increased to 0.062 against the euro in the period from January 2016 to 15 May 2017.
Big sell-offs of sterling-denominated assets began in the aftermath of the referendum, possibly as a result of investors’ rising fears over the UK’s long-term economic performance. The ditching of UK assets led to a dramatic plunge in the value of the pound, which is likely to have influenced expectations about a delayed increase in official bank rates and might have fuelled concerns over the UK’s widening current-account deficit, which is represented in Fig. 8.
1,05 1,1 1,15 1,2 1,25 1,3 1,35 1,4 04 /0 1/ 20 16 04 /0 2/ 20 16 04 /0 3/ 20 16 04 /0 4/ 20 16 04 /0 5/ 20 16 04 /0 6/ 20 16 04 /0 7/ 20 16 04 /0 8/ 20 16 04 /0 9/ 20 16 04 /1 0/ 20 16 04 /1 1/ 20 16 04 /1 2/ 20 16 04 /0 1/ 20 17 04 /0 2/ 20 17 04 /0 3/ 20 17 04 /0 4/ 20 17 04 /0 5/ 20 17 Eur o s per po un d
25
Source: (Office for National Statistics, 2017a)
Markets seem to have shown their hostility to Brexit, weighting the prospects of deterioration of economic activity and increased risk deriving from a rise in uncertainty (HM Treasury, 2016b). As investors started losing confidence in the soundness of the UK’s economy and readjusted expectations, they might have requested higher premia to compensate the risk of holding assets denominated in pounds, thus increasing the risk premia on the exchange rate.
Increased risk premia are not the only negative consequence of a depreciation of sterling. A weaker currency could boost export, but this does not seem to be the case for the UK. Whether exports could grow faster than imports depends on the degree of elasticity of internal and external demand; data collected during the 2008 recession show that the pound depreciation did not have remarkably positive effects on UK exports (HM Treasury, 2016b), although the crisis had also hit other countries, thus reducing their imports. Moreover, exports could become gradually more expensive, as there might be no ‘pass-through’ of the exchange rate, and consumers might have to bear an increase in inflation rate. A yeast-based spread popular in the UK, Marmite, was at the centre of a price controversy between its European producer and some British retailers, for example; in order to offset losses caused by the pound’s depreciation, Marmite now costs 13 percent more than it used to before the referendum (The Economist, 2016).
However, gains from a weaker pound in terms of exports could be limited. When a country exports raw materials, a home currency depreciation boosts exports. Yet, the United Kingdom seem to rely on imports to export; this means that British businesses import a certain amount of goods and services, transform them into new products, and then export them again. The higher the share of imported materials or services for each unit of exported goods, the smaller the gains triggered by a depreciation of the pound.
-5,0 -4,5 -4,0 -3,5 -3,0 -2,5 -2,0 -1,5 -1,0 -,5 ,0 1997 1998 1999 2000 2001 2002 2003 2004 2005 2006 2007 2008 2009 2010 2011 2012 2013 2014 2015 2016 P er cent ag e cha nge
26
Tab. 1 shows that the UK depends on imports to export much more than the European Union. On average, 21 percent of a unit of British exports derive from imports, while this is only 13 percent for the European Union. Similarly, figures for the UK are almost double for the manufacturing and services sectors than that of the European Union.
Tab. 1: Imports content of exports in the mid-2000s
United Kingdom European Union
Total 0.213 0.131
Manufactures 0.318 0.167
Services 0.110 0.059
Source: (OECD, 2012)
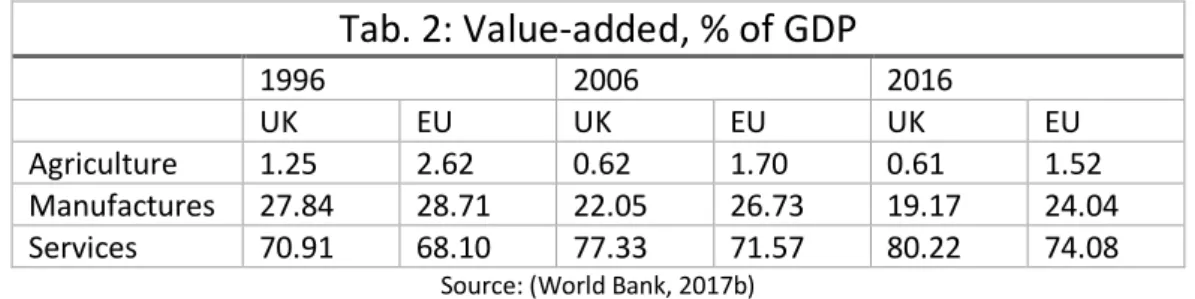
The pound’s depreciation might fall short of stimulating the economy. In the UK, manufacturing and agriculture, the sectors that could be more competitive with a weaker sterling, account for less than 20 percent of GDP in value-added terms, whilst services value-added is over 80 percent of GDP, as in Tab. 2.
Tab. 2: Value-added, % of GDP
1996 2006 2016 UK EU UK EU UK EU Agriculture 1.25 2.62 0.62 1.70 0.61 1.52 Manufactures 27.84 28.71 22.05 26.73 19.17 24.04 Services 70.91 68.10 77.33 71.57 80.22 74.08Source: (World Bank, 2017b)
Since the referendum, the pound has remained weak both against the dollar and the euro, and has continued to be volatile. This might cause foreign investors to lose confidence in sterling-denominated investments, and might also lead to a reduction in foreign direct investment (FDI), because a weak currency may not outweigh the price of heightened political instability. The value of the pound reached record lows in October 2016, consistent with the gloomy climate surrounding negotiations with the European Union to define the terms of exit (The Guardian, 2016b). On 4 October, the pound hit a 31-year low, going as low as 1.27 dollars exchanged for one British pound. There has been no recovery so far for the pound, which has been constantly below the pre-referendum highs. Clearly, a depreciation of the pound helps all those businesses that are export-oriented, whose goods and services become cheaper for foreign buyers. At the same time, the FTSE 100, one of the main indices of the London stock market that groups companies whose revenues are denominated in dollars, soared.
I
MPACT ON THE STOCK MARKETThe financial sector of the UK is the most developed of the European Union. It accounts for almost one-quarter of all income deriving from financial services in the European Union, and it represents 40 percent of
27
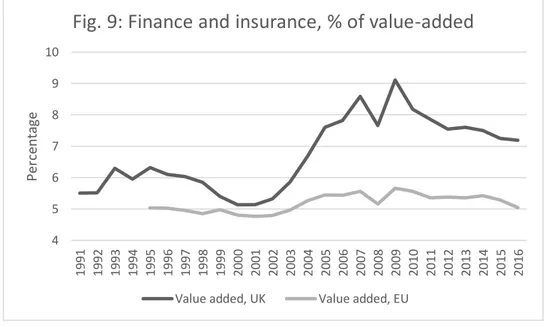
financial services exports from the European Union (Bank of England, 2015). To date, over 7 percent of value-added in the UK is represented by the finance and insurance sector, whilst the European Union average stands at about 5 percent, as it can be seen in Fig. 9. This is because the UK, and namely London, have become a hub for financial services and insurance over the years, creating a network of financial institutions with an international orientation. The value-added of finance and insurance sector has increased rapidly from 2000, peaking at 9 percent in 2010, after a drop in the years of the financial crisis, and then averaging just below 7.5 percent from 2011 onwards. In comparison to that of the European Union (including the UK), the share of financial and insurance value-added is much higher in the UK.
Source: (OECD, 2017c)
The financial sector growth was driven by the liberalisation of capital flows in the 1970s, and further liberalisations of financial services in the 1980s (Bank of England, 2015). Alongside internal policy changes, the UK’s membership of the European Union has enhanced its openness and dynamism, hence making the United Kingdom a more attractive place for FDI (PwC, 2016b). One of the factors that promoted the clustering of financial services in the City in recent years is that the UK benefits from the so-called ‘passporting rights’, a rule that allows a financial institution licensed in any of the EEA countries to open new branches, subsidiaries, or conduct cross-border transactions in any other EEA countries without the need of additional authorisations (Bank of England, 2015). This has meant that third-countries’ financial institutions have increasingly chosen the UK as headquarters for their operations in the European Union (PwC, 2016b), so that in 2014 358 banks were present in the UK, with 80 being European (Bank of England, 2015). It is clear that exiting the European Union and failing to agree to be part of the EEA would imply losing passporting rights and would induce banks and other financial institutions to relocate elsewhere in
4 5 6 7 8 9 10 1991 1992 1993 1994 1995 1996 1997 1998 1999 2000 2001 2002 2003 2004 2005 2006 2007 2008 2009 2010 2011 2012 2013 2014 2015 2016 P er cent ag e
Fig. 9: Finance and insurance, % of value-added
28
the European Union to maintain their operability. In fact, Deutsche Bank, JP Morgan, Morgan Stanley, Citigroup, and Goldman Sachs are threatening to move their facilities and staff to the European Union (The Guardian, 2017; Bloomberg, 2017c); ING is going against the current by moving trading jobs into London, convinced it will retain its role as a financial hub (The Telegraph, 2016), although little has happened so far. Certainly, something happened when the referendum was announced and when results were made public. Investors were immediately affected by the news and reacted with sell-offs of equities that caused a slump in the FTSE 100, represented in Fig. 10. As in the case of the exchange rate, losses were limited in February 2016 following the announcement of the referendum, and the blue-chip index closed at a higher level on 22 February in comparison to the Friday before. Investors were probably encouraged by the deal signed by David Cameron, that included special provisions for the financial district, and felt optimistic about the economic outlook of the UK. With the referendum results, the investors’ reaction was radically different. On opening, the index fell by over 8 percent, losing more than 5 percent in a week. Panic spread rapidly, leading to huge sell-offs of assets. The plunge of the FTSE 100 was consistent with a shock that hit all the economy, and thus also this index, regardless of the fact that most of its companies are non-British.
Source: (Bloomberg, 2017a)
On 29 June 2016, FTSE 100 companies had already forgotten about the losses. From that moment on, the index began to increase its value. This would be surprising, but the good performance of the FTSE 100 should not be misleading. In fact, the FTSE 100 mainly comprises internationally-oriented companies, whose profits are boosted by the pound depreciation, as they are normally in dollars, and this was the case (PwC, 2016b). In addition to this, export is encouraged by a weak pound, and exporters of goods and services can benefit from absence of trade barriers and a weak currency while it lasts, until the negotiations
5000 5500 6000 6500 7000 7500 8000 4 /1 /2 01 6 1 /2 /2 01 6 2 9 /2 /2 01 6 3 0 /3 /2 01 6 2 7 /4 /2 01 6 2 6 /5 /2 01 6 2 4 /6 /2 01 6 2 2 /7 /2 01 6 19 /8 /2 01 6 1 9 /9 /2 01 6 1 7/ 1 0/ 20 16 14 /1 1/ 20 16 1 2/ 1 2/ 20 16 1 2 /1 /2 01 7 9 /2 /2 01 7 9 /3 /2 01 7 6 /4 /2 01 7 9 /5 /2 01 7 7 /6 /2 01 7 G BP
Fig. 10: FTSE 100
29
over a Brexit deal are concluded. Behind such a good performance there could also be the data about the UK’s GDP, which is still growing in spite of the negative outlook that analysts predict for the country. On the other hand, the FTSE 250 instead comprises more domestic-oriented companies, from national transport groups such as First or National Express to clothing brands such as Ted Baker, but it includes also real estate agents such as Savills, and bakers like Greggs and Domino’s Pizza (London Stock Exchange, 2017). Thus, this market is likely to be less exposed to international fluctuations such as those triggered by Brexit. In fact, as it appears from Fig. 11, there is no record of relevant losses in February 2016 around the time of the referendum announcement. Yet, one week after the referendum the index had turned to negative figures, losing almost 14 percent of its pre-referendum value. Volatility increased around the referendum date. This can be due to heightened uncertainty about internal demand, which could be harmed by a weaker pound in combination with rising inflation and decreasing real wages that would limit households’ purchasing power and would induce them to save more and consume less as a precautionary measure. Growing GDP in the UK seems to have convinced investors that demand would not decrease significantly, at least in the short-term. In reality, another factor that could have favoured the growth of the firms part of the FTSE 250 is rising inflation; price levels recorded marked increases for most of the sectors that the companies of the FTSE 250 are part of. In 2017, inflation is on the rise for transport (5.7 percent), clothing and footwear (1.6 percent), housing (1.2 percent), and food (0.9). Rising inflation could be perceived as higher revenues, bearing in mind that wages are fixed in the short-term, thus potentially increasing the firms’ mark-up on sales.
Source: (Bloomberg, 2017b) 12500 13500 14500 15500 16500 17500 18500 19500 20500 21500 22500 4/ 1/ 2 01 6 1/ 2/ 20 16 29 /2 /2 0 1 6 30 /3 /2 0 1 6 27 /4 /2 01 6 26 /5 /2 0 1 6 24 /6 /2 0 1 6 22 /7 /2 0 1 6 19 /8 /2 0 1 6 19 /9 /2 0 1 6 17 /1 0/ 20 1 6 14 /1 1/ 20 1 6 12 /1 2/ 20 1 6 12 /1 /2 0 1 7 9/ 2/ 2 01 7 9/ 3/ 2 01 7 6/ 4/ 2 01 7 9/ 5/ 20 17 7/ 6/ 2 01 7 G B P
Fig. 11: FTSE 250
30
Interesting findings emerge from an analysis of the performance around the dates of the referendum announcement and of the aftermath of the referendum. As examples, a wide range of companies quoted on the London Stock Exchange with assets denominated in pounds can be taken.
T
HE PLUNGE IN DETAILS:
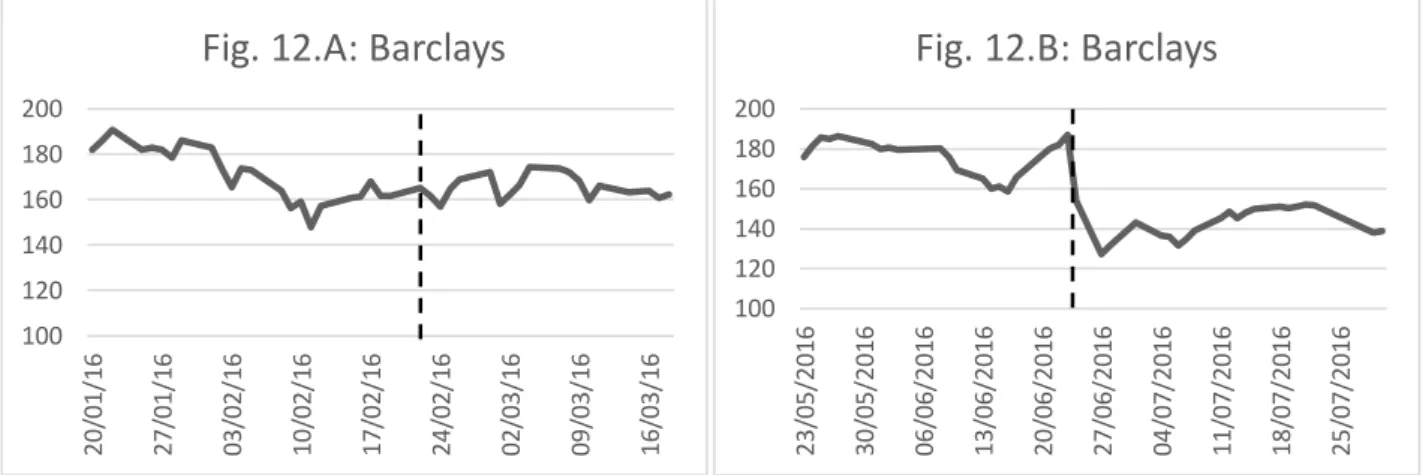
SOME CASE STUDIESThe banking sector seems to be the field that was most struck by the shock of the announcement of the referendum and even more by the outcome of the vote. Barclays is a multinational bank headquartered in London and specialised in multinational services.
Source: (Yahoo Finance, 2017)
After the announcement of the referendum on 20 February 2016, Barclays closed 2 percent lower, as shown in Fig. 12.A, but on 24 June 2016 the pattern was much more marked, when it went down by 17 percent by the end of the day, as it is evident from Fig. 12.B.
Also the Royal Bank of Scotland (RBS) performed badly in both cases, with a sharper fall in June 2016 compared to that of the beginning of the year when the referendum was announced.
Source: (Yahoo Finance, 2017)
100 120 140 160 180 200 20 /0 1/ 16 27 /0 1/ 16 03 /0 2/ 16 10 /0 2/ 16 17 /0 2/ 16 24 /0 2/ 16 02 /0 3/ 16 09 /0 3/ 16 16 /0 3/ 16
Fig. 12.A: Barclays
100 120 140 160 180 200 23 /0 5/ 20 16 30 /0 5/ 20 16 06 /0 6/ 20 16 13 /0 6/ 20 16 20 /0 6/ 20 16 27 /0 6/ 20 16 04 /0 7/ 20 16 11 /0 7/ 20 16 18 /0 7/ 20 16 25 /0 7/ 20 16
Fig. 12.B: Barclays
210 220 230 240 250 260 270 20 /0 1 /2 0 16 27 /0 1 /2 0 16 03 /0 2 /2 0 16 10 /0 2 /2 0 16 17 /0 2 /2 0 16 24 /0 2 /2 0 16 02 /0 3 /2 0 16 09 /0 3 /2 0 16 16 /0 3 /2 0 16Fig. 13.A: RBS
120 140 160 180 200 220 240 260 280 23 /0 5 /2 0 16 30 /0 5 /2 0 16 06 /0 6 /2 0 16 13 /0 6/ 20 16 20 /0 6 /2 0 16 27 /0 6 /2 0 16 04 /0 7 /2 0 16 11 /0 7 /2 0 16 18 /0 7 /2 0 16Fig. 13.B: RBS
31
The trend was negative during the period of the EU referendum announcement, when prices went from 246 pounds per share on 19 February to 232 pounds on 24 February, as it is represented in Fig. 13.A. The worse was yet to come, and the bank was hit by the UK’s decision to leave, with prices falling by over 30 percent within 4 days from the referendum, as shown in Fig. 13.B. On 5 July 2016, possibly still affected by the Brexit result, RBS was almost 37 percent lower than the day of the referendum.
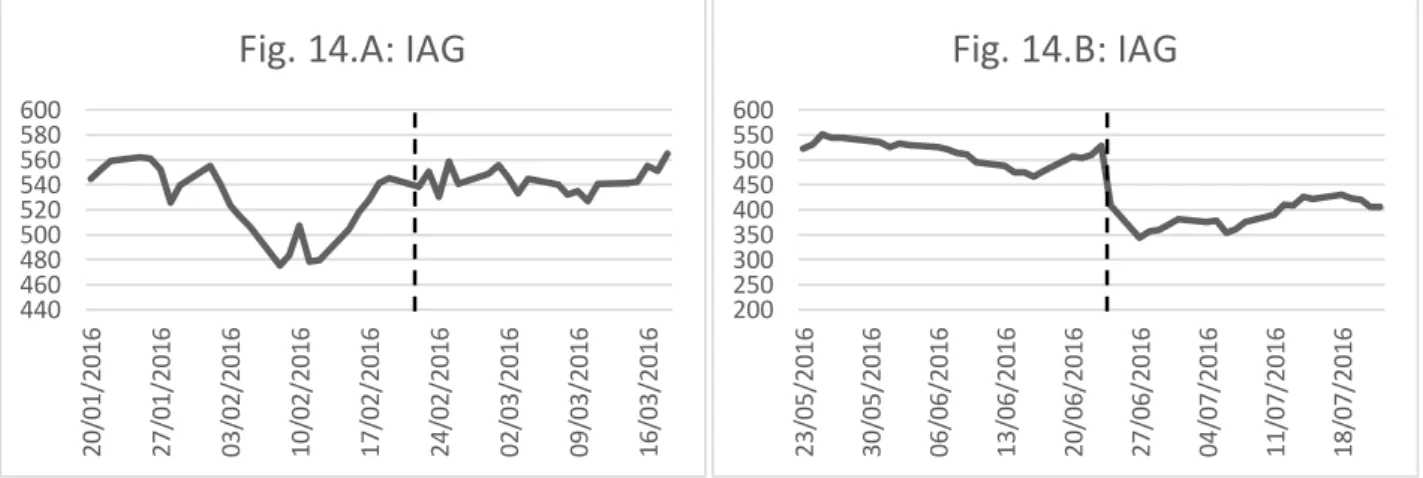
Brexit casts doubts also on issues related to movement of people between the United Kingdom and the rest of the European Union, as one of the arguments for Brexit was to limit immigration, and this was a point highlighted in the European Council meeting in February 2016, with special concessions made to the UK to clamp down on immigration and benefits for non-native people (European Council, 2016). This would discourage also work-related movement of people to and from the UK. At the same time, Brexit could affect holidaymakers and business travellers in the form of increased security checks, translating into longer waiting times at international terminals. For airlines, it could also mean increased regulatory difficulty to access the European Union’s aerospace, as long as the British government’s inability to participate in shaping air-traffic regulations. International Airlines Group (IAG), that controls British Airways, headquartered in London, and Iberia, located in Barcelona, and the Irish Aer Lingus, shows that investors were concerned by Brexit.
Source: (Yahoo Finance, 2017)
IAG showed volatility during the first months of 2016, which appears from Fig. 14.A, so it might be difficult to point at an evident causality between the referendum announcement and its performance. The causal link seems somewhat clearer after 23 June, when its value went down by almost 23 percent, represented in Fig. 14.B.
The housing market was affected by the sudden shock because investors expected a combined effect of rising uncertainty that induces households to save more as a precaution, and rising inflation that would
440 460 480 500 520 540 560 580 600 2 0/ 01 /2 01 6 2 7/ 01 /2 01 6 0 3/ 02 /2 01 6 1 0/ 02 /2 01 6 1 7/ 02 /2 01 6 2 4/ 02 /2 01 6 0 2/ 03 /2 01 6 0 9/ 03 /2 01 6 1 6/ 03 /2 01 6
Fig. 14.A: IAG
200 250 300 350 400 450 500 550 600 2 3/ 05 /2 01 6 3 0/ 05 /2 01 6 0 6/ 06 /2 01 6 13 /0 6/ 20 16 2 0/ 06 /2 01 6 2 7/ 06 /2 01 6 0 4/ 07 /2 01 6 1 1/ 07 /2 01 6 1 8/ 07 /2 01 6
Fig. 14.B: IAG
32
reduce real incomes. Big-ticket spending decisions are likely to be postponed following a rise in uncertainty. As one of the largest builder of new homes in the UK, Tailor Wimpey was struck by the referendum.
Source: (Yahoo Finance, 2017)
Fig. 15.A shows that volatility was present throughout the first period of 2016, although the company closed 4 percent lower on the day following the announcement of the referendum. As for the other companies, the drop was far more dramatic in June, as it appears in Fig. 15.B; in two days, shares were almost 40 percent cheaper.
T
HE CASE OF GOVERNMENT DEBT:
THE GILT MARKETA combination of hope and fear has produced mixed results on gilts, sterling-denominated liabilities issued by the HM Treasury on behalf of the UK government are offered to investors, and the gilt market’s changes are represented in Fig. 16. In February, when David Cameron announced that a referendum on the UK’s membership of the European Union would be held, short-term, medium-term, and long-term conventional gilts5 showed a decrease in average yields of around 30 basis points. Such a drop could be part of the
normal volatility of gilts yields, and interest rates stayed constant at around 0.87 percent for the short-term, 1.45 percent and 2.32 percent for medium-term and long-term bonds respectively until the referendum. The spectrum of Brexit had led analysts to forecast an immediate downgrading of the UK’s sovereign debt in case British people chose to leave the European Union (PwC, 2016a). In fact, after the referendum rating agencies lowered their expectations for the UK; Moody’s changed its outlook to negative, Fitch from AA+ to AA, and S&P downgraded the UK debt from AAA to AA (BBC, 2016). Surprisingly, investors seemed to disregard the caveat issued by the rating agencies; interest rates on government gilts plunged, down by over 50 basis points in July in comparison to the levels of the month
5 Conventional gilts are the most common liabilities issued by the HM Treasury, and they are not indexed to inflation.
150 160 170 180 190 200 20 /0 1/ 20 16 27 /0 1/ 20 16 03 /0 2/ 20 16 10 /0 2/ 20 16 17 /0 2/ 20 16 24 /0 2/ 20 16 02 /0 3/ 20 16 09 /0 3/ 20 16 16 /0 3/ 20 16
Fig. 15.A: Taylor Wimpey
100 120 140 160 180 200 220 23 /0 5/ 20 16 30 /0 5/ 20 16 06 /0 6/ 20 16 13 /0 6/ 20 16 20 /0 6/ 20 16 27 /0 6/ 20 16 04 /0 7/ 20 16 11 /0 7/ 20 16 18 /0 7/ 20 16
33
before the referendum. Interest rates and price are inversely correlated, so a decrease in yields suggests that there was a rally to buy government debt.
Source: (United Kingdom Debt Management Office, 2017)
This could be explained with investors rushing to purchase safer assets. At the same time, investors might have trusted the Bank of England’s repeated announcements of easing monetary policy further in case of a strong depreciation of sterling (Bank of England, 2016). Eventually, the Bank of England cut bank rates from 0.5 to 0.25 in August, and furthered a programme of quantitative easing that started in 2009 in response to the financial crisis. The new measures decided by the Monetary Policy Committee (MPC) aimed to sustain growth and to lead inflation closer to the 2 percent target included also a plan to purchase up to £60 billion of gilts and £10 billion of UK corporate bonds. In spite of the additional package of measures of the Bank of England, yields on gilts began to rise again from September 2016, which could be explained with investors renewing their interest in the equity market, possibly ruling out further reductions of the official bank rate. Also, fear that rising inflation above the 2 percent target could eat off their revenues on fixed-yield gilts could lead investors to resort to reduce UK gilts in their portfolio.
H
OW THEGDP
HAS CHANGED OVERTIMESome British newspaper that had backed Brexit triumphantly emphasised that GDP kept growing in spite of the EU referendum outcome. It is true that GDP continued its growth even after the referendum, yet this should not lead to the conclusion that the referendum has produced no harm to the economy.
0,00% 0,50% 1,00% 1,50% 2,00% 2,50% 3,00% Ja n-15 Feb -1 5 M ar -1 5 Ap r-15 M ay -1 5 Jun -1 5 Jul -1 5 Au g-15 Sep -1 5 O ct -1 5 N ov -1 5 D ec-15 Ja n-16 Feb -1 6 M ar -1 6 Ap r-16 M ay -1 6 Jun -1 6 Jul -1 6 Au g-16 Sep -1 6 O ct -1 6 N ov -1 6 D ec-16 Ja n-17 Feb -1 7 Yi el ds
Fig. 16: UK government's conventional gilts yields
34
Source: (Office for National Statistics, 2017e), (Office for National Statistics, 2017d)
To date, GDP in the UK has recorded the 17th consecutive quarter of growth (Office for National Statistics,
2017c), as it can be seen in Fig. 17. Volatility on markets and expectations about the moves of the Bank of England might have driven the slow growth pace of GDP in the first quarter of 2016, although it cannot be ruled out that uncertainty about a possible future economic downturn triggered by a Brexit result could have had an impact on a modest 0.2 percent GDP growth. The statistical bulletin released by the Office for National Statistics (ONS) (2016) covering the third quarter of 2016, that from July to September, suggested that economy was not significantly affected by the outcome of the referendum, although the GDP growth rate slowed to 0.5 percent, compared to 0.7 percent of the previous quarter. The last quarter of the year saw a marked increase in the contribution of energy industry (3.1 percent) and manufacturing (1.2 percent) to national output levels, and services also grew by 0.8 percent, hauling a generalised increase in production. The pattern could be explained with initial hesitation of businesses consistent with the uncertainty that was caused by the referendum, which was followed by a regain in confidence, relying on the fact that Brexit would not happen shortly. Absence of tariffs and a weak pound could be behind the increase in manufacturing industries’ contribution to GDP growth, and the same could go for services, which account for 78.8 percent if the total UK’s GDP (Office for National Statistics, 2017c). Almost one year after the referendum, in the first quarter of 2017 the UK’s GDP appeared to have reduced its growth speed, returning again to the levels of the year before. This might be due to a reduction in household spending that seems to have affected primarily consumer-facing industries, such as retail and accommodation, and simultaneously due to a rise in prices (Office for National Statistics, 2017c).
360000 380000 400000 420000 440000 460000 480000 -2,5 -2 -1,5 -1 -0,5 0 0,5 1 1,5 20 06 Q 1 20 06 Q 2 20 06 Q 3 20 06 Q 4 20 07 Q 1 20 07 Q 2 20 07 Q 3 20 07 Q 4 20 08 Q 1 20 08 Q 2 20 08 Q 3 20 08 Q 4 20 09 Q 1 20 09 Q 2 20 09 Q 3 20 09 Q 4 20 10 Q 1 20 10 Q 2 20 10 Q 3 20 10 Q 4 20 11 Q 1 20 11 Q 2 20 11 Q 3 20 11 Q 4 20 12 Q 1 20 12 Q 2 20 12 Q 3 20 12 Q 4 20 13 Q 1 20 13 Q 2 20 13 Q 3 20 13 Q 4 20 14 Q 1 20 14 Q 2 20 14 Q 3 20 14 Q 4 20 15 Q 1 20 15 Q 2 20 15 Q 3 20 15 Q 4 20 16 Q 1 20 16 Q 2 20 16 Q 3 20 16 Q 4 20 17 Q 1 Mi lli o n G B P P er centa ge cha ng e
Fig. 17: UK GDP quarterly growth and levels of GDP for the UK
35
H
OW BUSINESS CONFIDENCE WAS AFFECTEDThe Organisation for Cooperation and Economic Development (OECD) has developed a Business confidence index (BCI) that attempts to put a value on firms’ current situation and their expectations for the short-term, and it includes companies’ judgments about production, orders, and stocks (OECD, 2017a). Opinions are compared to a ‘normal’ long-term average fixed at 100. The BCI is shown in Fig. 18.
Source: (OECD, 2017a)
After 2011, UK’s firms have had a positive outlook over their future, generally outperforming the levels recorded in the Euro Area. After a small reduction in confidence around the date of the referendum, businesses have shown positive outlook, and levels of confidence jumped from 100.75 in July 2016 to 101.82 in March 2017, when the United Kingdom officially notified the European Union of its intention to leave. Such a rise in confidence might derive from above-expectations economic climate after the referendum, thus to those same factors that cause the GDP to increase. However, the index takes into account immediate expectations; this is consistent with macroeconomic data which show ongoing GDP growth, while an official Brexit is still not in sight.
T
HE CASE OF INFLATION AND WAGESIt is somehow inevitable that a weaker pound correlates with higher inflation rate, with a consequent impact on the purchasing power of British households. Higher inflation, in combination with unchanging or even decreasing growth pace of nominal wages, reduces the spending capability of wage-earners. High levels of inflation combined with tumbling growth of wages seems to be the case for the United Kingdom, as it appears from Fig. 19.
95 96 97 98 99 100 101 102 103 Ja n-08 Jul -0 8 Ja n-09 Jul -0 9 Ja n-10 Jul -1 0 Ja n-11 Jul -1 1 Ja n-12 Jul -1 2 Ja n-13 Jul -1 3 Ja n-14 Jul -1 4 Ja n-15 Jul -1 5 Ja n-16 Jul -1 6 Ja n-17 Ind ex