Cost-Optimal measures for renovation of
existing school buildings towards nZEB
Article in Energy Procedia · December 2017 DOI: 10.1016/j.egypro.2017.11.143 CITATIONS0
READS23
4 authors, including: Tiziano Dalla Mora Università Iuav di Venezia 13 PUBLICATIONS 13 CITATIONS SEE PROFILE Fabio Peron Università Iuav di Venezia 72 PUBLICATIONS 287 CITATIONS SEE PROFILE Piercarlo Romagnoni Università Iuav di Venezia 63 PUBLICATIONS 342 CITATIONS SEE PROFILEScienceDirect
Available online at Available online at www.sciencedirect.comwww.sciencedirect.com
ScienceDirect
Energy Procedia 00 (2017) 000–000www.elsevier.com/locate/procedia
1876-6102 © 2017 The Authors. Published by Elsevier Ltd.
Peer-review under responsibility of the Scientific Committee of The 15th International Symposium on District Heating and Cooling.
The 15th International Symposium on District Heating and Cooling
Assessing the feasibility of using the heat demand-outdoor
temperature function for a long-term district heat demand forecast
I. Andrić
a,b,c*, A. Pina
a, P. Ferrão
a, J. Fournier
b., B. Lacarrière
c, O. Le Corre
c aIN+ Center for Innovation, Technology and Policy Research - Instituto Superior Técnico, Av. Rovisco Pais 1, 1049-001 Lisbon, PortugalbVeolia Recherche & Innovation, 291 Avenue Dreyfous Daniel, 78520 Limay, France
cDépartement Systèmes Énergétiques et Environnement - IMT Atlantique, 4 rue Alfred Kastler, 44300 Nantes, France
Abstract
District heating networks are commonly addressed in the literature as one of the most effective solutions for decreasing the greenhouse gas emissions from the building sector. These systems require high investments which are returned through the heat sales. Due to the changed climate conditions and building renovation policies, heat demand in the future could decrease, prolonging the investment return period.
The main scope of this paper is to assess the feasibility of using the heat demand – outdoor temperature function for heat demand forecast. The district of Alvalade, located in Lisbon (Portugal), was used as a case study. The district is consisted of 665 buildings that vary in both construction period and typology. Three weather scenarios (low, medium, high) and three district renovation scenarios were developed (shallow, intermediate, deep). To estimate the error, obtained heat demand values were compared with results from a dynamic heat demand model, previously developed and validated by the authors.
The results showed that when only weather change is considered, the margin of error could be acceptable for some applications (the error in annual demand was lower than 20% for all weather scenarios considered). However, after introducing renovation scenarios, the error value increased up to 59.5% (depending on the weather and renovation scenarios combination considered). The value of slope coefficient increased on average within the range of 3.8% up to 8% per decade, that corresponds to the decrease in the number of heating hours of 22-139h during the heating season (depending on the combination of weather and renovation scenarios considered). On the other hand, function intercept increased for 7.8-12.7% per decade (depending on the coupled scenarios). The values suggested could be used to modify the function parameters for the scenarios considered, and improve the accuracy of heat demand estimations.
© 2017 The Authors. Published by Elsevier Ltd.
Peer-review under responsibility of the Scientific Committee of The 15th International Symposium on District Heating and Cooling.
Keywords: Heat demand; Forecast; Climate change
Energy Procedia 140 (2017) 288–302
1876-6102 © 2017 The Authors. Published by Elsevier Ltd.
Peer-review under responsibility of the scientific committee of the AiCARR 50th International Congress; Beyond NZEB Buildings 10.1016/j.egypro.2017.11.143
ScienceDirect
Energy Procedia 00 (2017) 000–000www.elsevier.com/locate/procedia
1876-6102 © 2017 The Authors. Published by Elsevier Ltd.
Peer-review under responsibility of the scientific committee of the AiCARR 50th International Congress; Beyond NZEB Buildings.
AiCARR 50th International Congress; Beyond NZEB Buildings, 10-11 May 2017, Matera, Italy
Cost-Optimal measures for renovation of existing school buildings
towards nZEB
T. Dalla Mora, A. Righi, F. Peron, P. Romagnoni*
* Department of Design and Planning in Complex Environments, University IUAV of Venice, IT
Abstract
The energy policies of the European Union (EU) encourage the member states to convert building stock into nearly Zero-Energy Buildings (nZEB) and national public authorities to adopt exemplary actions. Directive 2010/31/EU (EPBD recast) introduces the concept of nZEB as a building that has a very high energy performance and its energy need is covered to a very significant extent by energy from renewable sources (RES). Moreover the Directive refers to the cost-optimal methodology for fixing building energy requirements.
This paper presents the results of the application of the cost-optimal methodology in a couple of existing school buildings located in the North East of Italy. The analysed buildings are a primary and a secondary schools that differ in construction period, in compactness ratio, in buildings envelope materials and systems. Several combinations of retrofit measures have been applied in order to derive cost-effective efficient solutions for retrofitting according to the methodology proposed by the project Annex56 “Cost Effective Energy & CO2 Emissions Optimization in Building Renovation”. The cost-optimal level has been identified for each building and the best performing solutions have been selected considering a financial analysis and the application of “Conto Termico 2.0” government incentives. The results show the suitability of the proposed methodology to assess cost-optimality and energy efficiency in school building refurbishment. Moreover, this study shows different possibility providing the most cost-effective balance between costs and energy saving.
© 2017 The Authors. Published by Elsevier Ltd.
Peer-review under responsibility of the scientific committee of the AiCARR 50th International Congress; Beyond NZEB Buildings.
* Corresponding author. Tel.: +39 0412571293 E-mail address: [email protected]
2 Author name / Energy Procedia 00 (2017) 000–000
Keywords: energy retrofitting, nZEB, school building, cost-optimal. 1. Introduction
The European Directive 2002/91/EU [1] concerns energy efficiency of buildings and it was enacted on 04/01/2003. On May 2010 the European Parliament adopted the recast of the Energy Performance of Building Directive (EPBD recast) [2] with the aim to reinforce the requirements of energy performance for new and existent buildings and to fix the target of nearly Zero Energy Buildings (nZEB) for new constructions within the 2021. According to the EPBD, Member States (MS) have to consider cost-optimality to establish minimum energy performance requirements in buildings at the lowest costs.
Several projects focused on this topic in order to promote interventions of energy retrofit on existent buildings or to convert them into nZEB. In Italy the national school stock represents a strategic sector to promote important redevelopment: non-residential buildings are around 13% of the Italian building stock [3]. In particular, around 51,000 buildings are used entirely or partly as schools [4]. Moreover the great majority of schools are public property and, as consequence, the possibility for deep renovations is poor due to lack of funds for public administration.
Finally, the majority of existing school buildings present inefficient heating systems and old technologies. In particular the heating systems are characterized by radiators, for heat distribution, and gas/oil-fired boilers for generation [5]. Space heating is still the main end-use with 43% of heating needs met using natural gas in 2012.
Possible strategies for reducing energy consumption in public schools have been developed in some National and European Projects as School of the Future [6], ZEMeds [7], Renew School [8] e VERYSchool [9]; these projects make available funding and incentives for the redevelopment of existing schools with the aim to spread strategies and best practice among MS.
2. Methodology
The aim of this paper is to present a method to define and compare different measures of energy retrofitting, as interventions on the building envelope and the heating system. The methodology foresees a comparison in terms of costs [10] and energy performance [11] of construction alternatives; the scope is to define the cost-optimal level, i.e. to propose the solution presenting the lowest total costs. This solution can be located in a graph where the global costs (€/m2) versus primary energy consumption (kWh/m2y) are presented. The required benchmarks concerns the
achievement of nZEB targets and the calculation of incentives.
This study is carried out in accordance with the EPBD recast, the Delegated Regulation No. 244/2012 [12] and its Guidelines [13] to derive cost-effectiveness from a technical and economic perspective. In particular, the methodology consists of several steps:
definition of reference buildings;
definition of energy efficiency measures (measures based on energy from RES and/or packages and variants of such measures for each reference building);
calculation of primary energy demand resulting from the application of the previously selected measures and/or packages of measures;
calculation of global costs in terms of net present value for each reference building; sensitivity analysis related to cost data;
identification of cost-optimal levels in each reference building. 2.1. Reference building
Concerning the reference building, MS can select different types of non-residential buildings as listed in Annex I (paragraph 5) of the EPBD recast. This paper refers to the definition of reference building as proposed by the Annex 56 Cost-Effective Energy & CO2 Emissions Optimization in Building Renovation [14], [15]. Starting from the point of
T. Dalla Mora et al. / Energy Procedia 140 (2017) 288–302 289
ScienceDirect
Energy Procedia 00 (2017) 000–000
www.elsevier.com/locate/procedia
1876-6102 © 2017 The Authors. Published by Elsevier Ltd.
Peer-review under responsibility of the scientific committee of the AiCARR 50th International Congress; Beyond NZEB Buildings.
AiCARR 50th International Congress; Beyond NZEB Buildings, 10-11 May 2017, Matera, Italy
Cost-Optimal measures for renovation of existing school buildings
towards nZEB
T. Dalla Mora, A. Righi, F. Peron, P. Romagnoni*
* Department of Design and Planning in Complex Environments, University IUAV of Venice, IT
Abstract
The energy policies of the European Union (EU) encourage the member states to convert building stock into nearly Zero-Energy Buildings (nZEB) and national public authorities to adopt exemplary actions. Directive 2010/31/EU (EPBD recast) introduces the concept of nZEB as a building that has a very high energy performance and its energy need is covered to a very significant extent by energy from renewable sources (RES). Moreover the Directive refers to the cost-optimal methodology for fixing building energy requirements.
This paper presents the results of the application of the cost-optimal methodology in a couple of existing school buildings located in the North East of Italy. The analysed buildings are a primary and a secondary schools that differ in construction period, in compactness ratio, in buildings envelope materials and systems. Several combinations of retrofit measures have been applied in order to derive cost-effective efficient solutions for retrofitting according to the methodology proposed by the project Annex56 “Cost Effective Energy & CO2 Emissions Optimization in Building Renovation”. The cost-optimal level has been identified for each building and the best performing solutions have been selected considering a financial analysis and the application of “Conto Termico 2.0” government incentives. The results show the suitability of the proposed methodology to assess cost-optimality and energy efficiency in school building refurbishment. Moreover, this study shows different possibility providing the most cost-effective balance between costs and energy saving.
© 2017 The Authors. Published by Elsevier Ltd.
Peer-review under responsibility of the scientific committee of the AiCARR 50th International Congress; Beyond NZEB Buildings.
* Corresponding author. Tel.: +39 0412571293 E-mail address: [email protected]
2 Author name / Energy Procedia 00 (2017) 000–000
Keywords: energy retrofitting, nZEB, school building, cost-optimal. 1. Introduction
The European Directive 2002/91/EU [1] concerns energy efficiency of buildings and it was enacted on 04/01/2003. On May 2010 the European Parliament adopted the recast of the Energy Performance of Building Directive (EPBD recast) [2] with the aim to reinforce the requirements of energy performance for new and existent buildings and to fix the target of nearly Zero Energy Buildings (nZEB) for new constructions within the 2021. According to the EPBD, Member States (MS) have to consider cost-optimality to establish minimum energy performance requirements in buildings at the lowest costs.
Several projects focused on this topic in order to promote interventions of energy retrofit on existent buildings or to convert them into nZEB. In Italy the national school stock represents a strategic sector to promote important redevelopment: non-residential buildings are around 13% of the Italian building stock [3]. In particular, around 51,000 buildings are used entirely or partly as schools [4]. Moreover the great majority of schools are public property and, as consequence, the possibility for deep renovations is poor due to lack of funds for public administration.
Finally, the majority of existing school buildings present inefficient heating systems and old technologies. In particular the heating systems are characterized by radiators, for heat distribution, and gas/oil-fired boilers for generation [5]. Space heating is still the main end-use with 43% of heating needs met using natural gas in 2012.
Possible strategies for reducing energy consumption in public schools have been developed in some National and European Projects as School of the Future [6], ZEMeds [7], Renew School [8] e VERYSchool [9]; these projects make available funding and incentives for the redevelopment of existing schools with the aim to spread strategies and best practice among MS.
2. Methodology
The aim of this paper is to present a method to define and compare different measures of energy retrofitting, as interventions on the building envelope and the heating system. The methodology foresees a comparison in terms of costs [10] and energy performance [11] of construction alternatives; the scope is to define the cost-optimal level, i.e. to propose the solution presenting the lowest total costs. This solution can be located in a graph where the global costs (€/m2) versus primary energy consumption (kWh/m2y) are presented. The required benchmarks concerns the
achievement of nZEB targets and the calculation of incentives.
This study is carried out in accordance with the EPBD recast, the Delegated Regulation No. 244/2012 [12] and its Guidelines [13] to derive cost-effectiveness from a technical and economic perspective. In particular, the methodology consists of several steps:
definition of reference buildings;
definition of energy efficiency measures (measures based on energy from RES and/or packages and variants of such measures for each reference building);
calculation of primary energy demand resulting from the application of the previously selected measures and/or packages of measures;
calculation of global costs in terms of net present value for each reference building; sensitivity analysis related to cost data;
identification of cost-optimal levels in each reference building. 2.1. Reference building
Concerning the reference building, MS can select different types of non-residential buildings as listed in Annex I (paragraph 5) of the EPBD recast. This paper refers to the definition of reference building as proposed by the Annex 56 Cost-Effective Energy & CO2 Emissions Optimization in Building Renovation [14], [15]. Starting from the point of
view of a renovation in which not only the energy consumptions and carbon dioxide emissions costs are considered, also the renovation measures which are carried out for maintaining the building and its functionality are considered.
For the determination and assessment of the effects of energy related renovation solutions, it is assumed that energy related measures are undertaken in the moment in which a building really needs a retrofit because of functional reasons (replacement of building elements because of wear-out or because of modernization to meet the needs of the users or because of failure or damages like break down of heating system, replacement of piping, etc.). This anyway needed renovation solution, comprising the so-called anyway renovation measures, identifies a reference situation for determining and assessing the impacts of an energy related renovation solution on energy use, carbon emissions, materials, costs and possible benefits. The energy related solution comprises, on the one hand, those retrofit measures of the anyway renovation which are not changed by the energy related measures. On the other hand, it comprises additionally the energy related measures, which might be additional to the anyway measures or which might substitute some anyway necessary measures by measures which improve also energy performance and do not only restore original functionality of the particular building element. Building renovation comprising energy related measures is compared to the anyway reference case to determine the effects of the energy related measures.
2.2. Establishment of Energy Efficiency Measures
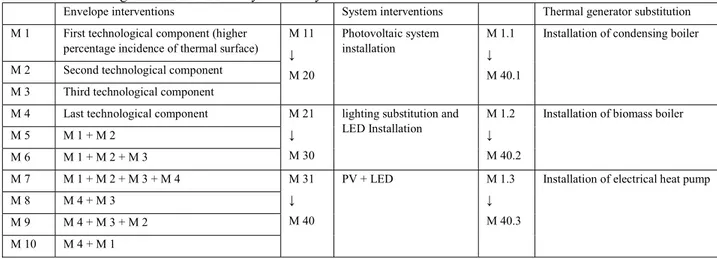
The interventions are defined by different steps (Table I). First of all the analysis of thermal envelope: each element (external wall, roof, basement, windows) is considered in terms percentage incidence of surfaces and thermal losses. Suddenly three groups of Energy Efficiency Measures (EEMs) are determined according to the benchmarks values of thermal transmittance fixed by the Conto Termico 2.0 regulation (DM 16/02/16) [16][17]: interventions of insulation in single technological component in the envelope; interventions on technological components according to percentage incidence of thermal surface, from higher to lower area; interventions on technological components according to percentage incidence of thermal surface, from lower to higher area.
In this way, a set of ten EEMs on envelope are defined and then are implemented with interventions on electrical lighting and wiring system, in order to increase a number of 40 total combinations: installation of photovoltaic system in order to save the 50% of electrical need; substitution of lighting with high-efficiency LED lamps.
In the last step each EEMs considers the substitution of the existent thermal generator with three boilers with different energy vector (natural gas, biomass, electricity): installation of condensing boiler; installation of biomass boiler; installation of electrical heat pump.
The total amount of EEMs consists on almost 120 interventions, which will be analyzed in terms of primary energy use and annualized global cost for a life cycle of 30 years.
Envelope interventions System interventions Thermal generator substitution M 1 First technological component (higher
percentage incidence of thermal surface) M 11 ↓ M 20
Photovoltaic system
installation M 1.1 ↓ M 40.1
Installation of condensing boiler M 2 Second technological component
M 3 Third technological component
M 4 Last technological component M 21 ↓ M 30
lighting substitution and
LED Installation M 1.2 ↓ M 40.2
Installation of biomass boiler M 5 M 1 + M 2 M 6 M 1 + M 2 + M 3 M 7 M 1 + M 2 + M 3 + M 4 M 31 ↓ M 40 PV + LED M 1.3 ↓ M 40.3
Installation of electrical heat pump M 8 M 4 + M 3
M 9 M 4 + M 3 + M 2 M 10 M 4 + M 1
Table I – list of interventions and organization on different combinations of measures
2.3. Primary Energy Use
After the definition of the reference buildings and the energy efficiency retrofit measures, primary energy demand is calculated using a software for energy dynamic simulation.
Heating, cooling, ventilation, domestic hot water, lighting and auxiliary demands have been estimated in accordance with the Italian technical specification UNI/TS 11300 series [18], which implements the European standards EN 15316 series [19] and EN 15243:2007 [20]. The characteristics of energy production, distribution, emission and control, as well as the energy carrier, are inserted to derive final primary energy consumption, according to conversion factor given by the national normative. The model is calibrated by means of the energy consumption of the last years.
2.4. Global Costs
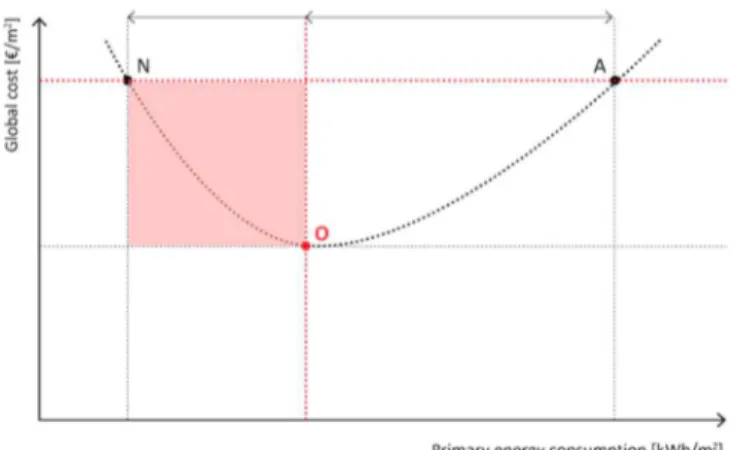
The evaluation of costs is carried out according to EPBD Regulation, that requires the evaluation of the cost optimal level related both to the financial level and to the macroeconomic level. In this study the financial level is defined as the global costs as the sum of the initial investment, the sum of the annual costs for each year (energy, maintenance, operation and any additional costs), the extraordinary replacement of systems and components, the final value, and the costs of disposal, as appropriate. All costs are actualized to the starting year, considering a lifespan of 30 years and the interest rate. The financing framework methodology is based on the net present value (global costs, GC) calculation, carried out according to standard EN 15459: 2007 [21], which provides a method for considering the economic aspects related to the application of heating systems and other technical systems that affect the energy consumption of the building. A sensitivity analysis is carried out considering the global cost and the primary energy consumption for each EEMs compared to reference scenario, in order to find out the cost optimal solution. The Figure 1 shows the Global cost curve after renovation (yearly costs for energy, operation and maintenance): the curve starts from the reference situation A (anyway renovation). Point O represents the cost optimal renovation option and point N represents the cost neutral renovation option with the highest reduction of primary energy [22].
2.5. Definition of nZEB and measures complying nZEB targets
The main scope of the renovation is to convert school building into nZEB. According to EPBD recast, “nearly-zero energy building” (nZEB) is a building that has a very high energy performance; the nearly zero or very low amount of energy required should be covered to a very significant extent by energy from renewable sources produced on-site or nearby. For European Countries, one of more consistent problem concerns the meeting point between the nZEB definition and the cost-optimal Energy Performance (EP) requirements; each MS shall receipt the directive and to enact a detailed nZEB definition in a legal document, ensuring a feasible national application at both technical and financial levels. A building is considered as nZEB when the following requirements are met: the EP is lower than the cost optimal level, because the nZEB is more energy efficient than the cost optimal building; the differential Global Cost ( GC) with reference to the building before the refurbishment is negative (nZEB is cost effective); the national minimum energy performance requirements for nZEBs are fulfilled. Thus, the nZEBs should have a primary energy consumption lower than the cost optimal range, and the global cost in between the cost optimal cases and the current reference building (Figure 1).
In Italy the DL 63/13 [23] law defined requirements and performances and parameters to achieve nZEB targets, achieving values within benchmarks for several parameters and index such as the overall heat transfer coefficient (H’t), the solar transfer coefficient (Asol,est/Asup utile), the Energy Performance index (EPH,nd, EPC,nd, EPgl,tot), the
efficiency for generating thermal and electrical energy (ηH, ηW, ηC), and also the installation of required renewable
energy, according to national minimal requirements, at least integration of 55% [24].
With reference to the aforementioned parameters, this study considers the proposed EEMs which followed nZEB targets, identifying the cost-optimal solutions.
view of a renovation in which not only the energy consumptions and carbon dioxide emissions costs are considered, also the renovation measures which are carried out for maintaining the building and its functionality are considered.
For the determination and assessment of the effects of energy related renovation solutions, it is assumed that energy related measures are undertaken in the moment in which a building really needs a retrofit because of functional reasons (replacement of building elements because of wear-out or because of modernization to meet the needs of the users or because of failure or damages like break down of heating system, replacement of piping, etc.). This anyway needed renovation solution, comprising the so-called anyway renovation measures, identifies a reference situation for determining and assessing the impacts of an energy related renovation solution on energy use, carbon emissions, materials, costs and possible benefits. The energy related solution comprises, on the one hand, those retrofit measures of the anyway renovation which are not changed by the energy related measures. On the other hand, it comprises additionally the energy related measures, which might be additional to the anyway measures or which might substitute some anyway necessary measures by measures which improve also energy performance and do not only restore original functionality of the particular building element. Building renovation comprising energy related measures is compared to the anyway reference case to determine the effects of the energy related measures.
2.2. Establishment of Energy Efficiency Measures
The interventions are defined by different steps (Table I). First of all the analysis of thermal envelope: each element (external wall, roof, basement, windows) is considered in terms percentage incidence of surfaces and thermal losses. Suddenly three groups of Energy Efficiency Measures (EEMs) are determined according to the benchmarks values of thermal transmittance fixed by the Conto Termico 2.0 regulation (DM 16/02/16) [16][17]: interventions of insulation in single technological component in the envelope; interventions on technological components according to percentage incidence of thermal surface, from higher to lower area; interventions on technological components according to percentage incidence of thermal surface, from lower to higher area.
In this way, a set of ten EEMs on envelope are defined and then are implemented with interventions on electrical lighting and wiring system, in order to increase a number of 40 total combinations: installation of photovoltaic system in order to save the 50% of electrical need; substitution of lighting with high-efficiency LED lamps.
In the last step each EEMs considers the substitution of the existent thermal generator with three boilers with different energy vector (natural gas, biomass, electricity): installation of condensing boiler; installation of biomass boiler; installation of electrical heat pump.
The total amount of EEMs consists on almost 120 interventions, which will be analyzed in terms of primary energy use and annualized global cost for a life cycle of 30 years.
Envelope interventions System interventions Thermal generator substitution M 1 First technological component (higher
percentage incidence of thermal surface) M 11 ↓ M 20
Photovoltaic system
installation M 1.1 ↓ M 40.1
Installation of condensing boiler M 2 Second technological component
M 3 Third technological component
M 4 Last technological component M 21 ↓ M 30
lighting substitution and
LED Installation M 1.2 ↓ M 40.2
Installation of biomass boiler M 5 M 1 + M 2 M 6 M 1 + M 2 + M 3 M 7 M 1 + M 2 + M 3 + M 4 M 31 ↓ M 40 PV + LED M 1.3 ↓ M 40.3
Installation of electrical heat pump M 8 M 4 + M 3
M 9 M 4 + M 3 + M 2 M 10 M 4 + M 1
Table I – list of interventions and organization on different combinations of measures
2.3. Primary Energy Use
After the definition of the reference buildings and the energy efficiency retrofit measures, primary energy demand is calculated using a software for energy dynamic simulation.
Heating, cooling, ventilation, domestic hot water, lighting and auxiliary demands have been estimated in accordance with the Italian technical specification UNI/TS 11300 series [18], which implements the European standards EN 15316 series [19] and EN 15243:2007 [20]. The characteristics of energy production, distribution, emission and control, as well as the energy carrier, are inserted to derive final primary energy consumption, according to conversion factor given by the national normative. The model is calibrated by means of the energy consumption of the last years.
2.4. Global Costs
The evaluation of costs is carried out according to EPBD Regulation, that requires the evaluation of the cost optimal level related both to the financial level and to the macroeconomic level. In this study the financial level is defined as the global costs as the sum of the initial investment, the sum of the annual costs for each year (energy, maintenance, operation and any additional costs), the extraordinary replacement of systems and components, the final value, and the costs of disposal, as appropriate. All costs are actualized to the starting year, considering a lifespan of 30 years and the interest rate. The financing framework methodology is based on the net present value (global costs, GC) calculation, carried out according to standard EN 15459: 2007 [21], which provides a method for considering the economic aspects related to the application of heating systems and other technical systems that affect the energy consumption of the building. A sensitivity analysis is carried out considering the global cost and the primary energy consumption for each EEMs compared to reference scenario, in order to find out the cost optimal solution. The Figure 1 shows the Global cost curve after renovation (yearly costs for energy, operation and maintenance): the curve starts from the reference situation A (anyway renovation). Point O represents the cost optimal renovation option and point N represents the cost neutral renovation option with the highest reduction of primary energy [22].
2.5. Definition of nZEB and measures complying nZEB targets
The main scope of the renovation is to convert school building into nZEB. According to EPBD recast, “nearly-zero energy building” (nZEB) is a building that has a very high energy performance; the nearly zero or very low amount of energy required should be covered to a very significant extent by energy from renewable sources produced on-site or nearby. For European Countries, one of more consistent problem concerns the meeting point between the nZEB definition and the cost-optimal Energy Performance (EP) requirements; each MS shall receipt the directive and to enact a detailed nZEB definition in a legal document, ensuring a feasible national application at both technical and financial levels. A building is considered as nZEB when the following requirements are met: the EP is lower than the cost optimal level, because the nZEB is more energy efficient than the cost optimal building; the differential Global Cost ( GC) with reference to the building before the refurbishment is negative (nZEB is cost effective); the national minimum energy performance requirements for nZEBs are fulfilled. Thus, the nZEBs should have a primary energy consumption lower than the cost optimal range, and the global cost in between the cost optimal cases and the current reference building (Figure 1).
In Italy the DL 63/13 [23] law defined requirements and performances and parameters to achieve nZEB targets, achieving values within benchmarks for several parameters and index such as the overall heat transfer coefficient (H’t), the solar transfer coefficient (Asol,est/Asup utile), the Energy Performance index (EPH,nd, EPC,nd, EPgl,tot), the
efficiency for generating thermal and electrical energy (ηH, ηW, ηC), and also the installation of required renewable
energy, according to national minimal requirements, at least integration of 55% [24].
With reference to the aforementioned parameters, this study considers the proposed EEMs which followed nZEB targets, identifying the cost-optimal solutions.
Figure 1 – Global cost curve after renovation with EEMs in comparison with reference situation; Identification of nZEB solutions (red area) in sensitivity analysis of global cost and primary energy consumption
2.6. Incentive calculation
Even if the Directive EPDB recast doesn’t consider the application of financial incentives, this study considers the calculation of Conto Termico 2.0 program, developed by GSE (Gestore dei Servizi Energetici).
The Decree regulates the incentive for interventions of small dimensions for increasing energy efficiency and for the production of thermal energy from renewable sources. Both public administrations and private owners are admitted and the incentive duration varies from 2 to 5 years depending on the type of intervention.
The characteristics of envelope and system for retrofit measures are based on the benchmarks fixed by the Conto Termico 2.0 in order to evaluate the possible application of incentives to the different kind of interventions.
For solutions according to nZEB parameters, the bonus is equivalent to 65% of total investment cost of intervention and conversion into nZEB.
After defining the costs for each intervention with the calculation of incentives, the optimal cost is selected among all possible interventions and among those which comply with the nZEB parameters.
2.7. Output
All the outputs are inserted as primary energy use versus the annualized global cost: four costs optimal solutions can be selected analyzing:
cost optimal solution among all proposed measures; cost optimal solution among those achieving nZEB target;
cost optimal solution among all proposed measures with calculation of incentives; cost optimal solution among those achieving nZEB target with calculation of incentives. 3. Applications
The schools analyzed are part of the public buildings of the Italian municipality of Motta di Livenza (TV) (2347 HDD); they are characterized by similar construction typology even if the compactness ratio is different.
3.1. Case study n.1
The first case study is the elementary school Alessandro Manzoni. The thermal surface is 947.98 m2 and the heated
volume is 2070 m3. The compactness ratio S/V is equal to 0.46: the geometry is compact and regular.
Element Area (m2) Thermal transmittance (W/m2K) Thermal dispersion (W/K) % by surface (m2) % by thermal dispersion (W/K)
Wall bricks with 2 heads 213.79 1.76 376.27 22 % 26 %
Double wall brick UNI 143.34 0.90 129.00 15 % 9 %
Alveolar wall blocks 107.17 0.90 95.45 12 % 6 %
Total wall 464.30 - 601.72 49 % 40 %
Windows 68.30 3.19 217.88 7 % 15 %
Roof 207.69 1.75 363.46 22 % 25 %
Basement 207.69 1.93 288.69 22 % 20 %
Total 947.98 - 1471.75 100 % 100 %
Table II - Area, thermal transmittance, thermal dispersion and percentage distribution of the envelope elements In this case the possible interventions on envelope are defined as follows:
Intervention code Description Percentage of envelope considered for interventions
M1 External wall 49 % M2 Roof 22 % M3 Basement 22 % M4 Windows 7 % M5 M1 + M2 71 % M6 M1 + M2 + M3 93 % M7 M1 + M2 + M3 + M4 100 % M8 M4 + M2 29 % M9 M4 + M2 + M3 51 % M10 M4 + M1 56 %
Table III - Definition of EEMs for energy retrofitting on building envelope
The scheme in Table III defines the different typologies of interventions and shows the percentage of the envelope interested to the retrofit according to the percentage subdivision by area.
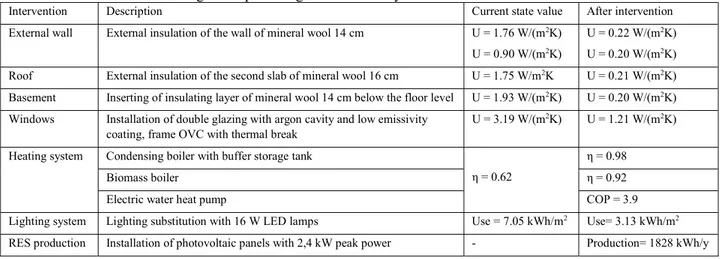
Intervention Description Current state value After intervention
External wall External insulation of the wall of mineral wool 14 cm U = 1.76 W/(m2K)
U = 0.90 W/(m2K)
U = 0.22 W/(m2K)
U = 0.20 W/(m2K)
Roof External insulation of the second slab of mineral wool 16 cm U = 1.75 W/m2K U = 0.21 W/(m2K)
Basement Inserting of insulating layer of mineral wool 14 cm below the floor level U = 1.93 W/(m2K) U = 0.20 W/(m2K)
Windows Installation of double glazing with argon cavity and low emissivity
coating, frame OVC with thermal break U = 3.19 W/(m
2K) U = 1.21 W/(m2K)
Heating system Condensing boiler with buffer storage tank
η = 0.62
η = 0.98
Biomass boiler η = 0.92
Electric water heat pump COP = 3.9
Lighting system Lighting substitution with 16 W LED lamps Use = 7.05 kWh/m2 Use= 3.13 kWh/m2
RES production Installation of photovoltaic panels with 2,4 kW peak power - Production= 1828 kWh/y Table IV - Description of proposed EEMs for the case study
Figure 1 – Global cost curve after renovation with EEMs in comparison with reference situation; Identification of nZEB solutions (red area) in sensitivity analysis of global cost and primary energy consumption
2.6. Incentive calculation
Even if the Directive EPDB recast doesn’t consider the application of financial incentives, this study considers the calculation of Conto Termico 2.0 program, developed by GSE (Gestore dei Servizi Energetici).
The Decree regulates the incentive for interventions of small dimensions for increasing energy efficiency and for the production of thermal energy from renewable sources. Both public administrations and private owners are admitted and the incentive duration varies from 2 to 5 years depending on the type of intervention.
The characteristics of envelope and system for retrofit measures are based on the benchmarks fixed by the Conto Termico 2.0 in order to evaluate the possible application of incentives to the different kind of interventions.
For solutions according to nZEB parameters, the bonus is equivalent to 65% of total investment cost of intervention and conversion into nZEB.
After defining the costs for each intervention with the calculation of incentives, the optimal cost is selected among all possible interventions and among those which comply with the nZEB parameters.
2.7. Output
All the outputs are inserted as primary energy use versus the annualized global cost: four costs optimal solutions can be selected analyzing:
cost optimal solution among all proposed measures; cost optimal solution among those achieving nZEB target;
cost optimal solution among all proposed measures with calculation of incentives; cost optimal solution among those achieving nZEB target with calculation of incentives. 3. Applications
The schools analyzed are part of the public buildings of the Italian municipality of Motta di Livenza (TV) (2347 HDD); they are characterized by similar construction typology even if the compactness ratio is different.
3.1. Case study n.1
The first case study is the elementary school Alessandro Manzoni. The thermal surface is 947.98 m2 and the heated
volume is 2070 m3. The compactness ratio S/V is equal to 0.46: the geometry is compact and regular.
Element Area (m2) Thermal transmittance (W/m2K) Thermal dispersion (W/K) % by surface (m2) % by thermal dispersion (W/K)
Wall bricks with 2 heads 213.79 1.76 376.27 22 % 26 %
Double wall brick UNI 143.34 0.90 129.00 15 % 9 %
Alveolar wall blocks 107.17 0.90 95.45 12 % 6 %
Total wall 464.30 - 601.72 49 % 40 %
Windows 68.30 3.19 217.88 7 % 15 %
Roof 207.69 1.75 363.46 22 % 25 %
Basement 207.69 1.93 288.69 22 % 20 %
Total 947.98 - 1471.75 100 % 100 %
Table II - Area, thermal transmittance, thermal dispersion and percentage distribution of the envelope elements In this case the possible interventions on envelope are defined as follows:
Intervention code Description Percentage of envelope considered for interventions
M1 External wall 49 % M2 Roof 22 % M3 Basement 22 % M4 Windows 7 % M5 M1 + M2 71 % M6 M1 + M2 + M3 93 % M7 M1 + M2 + M3 + M4 100 % M8 M4 + M2 29 % M9 M4 + M2 + M3 51 % M10 M4 + M1 56 %
Table III - Definition of EEMs for energy retrofitting on building envelope
The scheme in Table III defines the different typologies of interventions and shows the percentage of the envelope interested to the retrofit according to the percentage subdivision by area.
Intervention Description Current state value After intervention
External wall External insulation of the wall of mineral wool 14 cm U = 1.76 W/(m2K)
U = 0.90 W/(m2K)
U = 0.22 W/(m2K)
U = 0.20 W/(m2K)
Roof External insulation of the second slab of mineral wool 16 cm U = 1.75 W/m2K U = 0.21 W/(m2K)
Basement Inserting of insulating layer of mineral wool 14 cm below the floor level U = 1.93 W/(m2K) U = 0.20 W/(m2K)
Windows Installation of double glazing with argon cavity and low emissivity
coating, frame OVC with thermal break U = 3.19 W/(m
2K) U = 1.21 W/(m2K)
Heating system Condensing boiler with buffer storage tank
η = 0.62
η = 0.98
Biomass boiler η = 0.92
Electric water heat pump COP = 3.9
Lighting system Lighting substitution with 16 W LED lamps Use = 7.05 kWh/m2 Use= 3.13 kWh/m2
RES production Installation of photovoltaic panels with 2,4 kW peak power - Production= 1828 kWh/y Table IV - Description of proposed EEMs for the case study
Table IV describes the adopted characteristics for envelope and heating system taking into account the limits provided by the Conto Termico 2.0. As previously described, EEMs interventions have been combined with the replacement of the three generators and the installation of photovoltaic system and LED lamps.
The obtained results for the Manzoni school are presented with a list which refers to the different working phases. 3.1.1. Cost optimal among all the interventions
Figure 2 – Cost optimal concerning primary energy consumption and global cost for the proposed EEMs
The intervention M 21.2 (Figure 2) represents the optimal solution with the realization of the external insulation of mineral wool in the envelope, the installation of condensing boiler and LED lamps, resulting in a primary energy use of 57.32 kWh/ m2 for years and an annualized global cost of 16.30 €/m2 during the lifecycle (Table V).
Heating Primary energy use Total Primary Energy use Investment Cost Annualized Global Cost
M 21.1 50.66 kWh/m2 57.32 kWh/m2 200.42 €/m2 16.30 €/m2
Table V – Energy use and cost for the identified cost-optimal measure 3.1.2. Cost optimal among all the interventions achieving nZEB targets
Figure 3 – Cost optimal concerning primary energy consumption and global cost for the proposed EEMs achieving nZEB targets
According to nZEB benchmarks, the cost-optimal solution is M 31.2 (Figure 3), that includes the installation of biomass boiler and LED lamps, the realization of the external insulation and, in addition, the installation of the photovoltaic system (Table VI).
Heating Primary energy use Total Primary Energy need Investment Cost Annualized Global Cost
M 31.2 10.27 kWh/m2 10.38 kWh/m2 247.57 €/m2 17.23 €/m2
Table VI – Energy use and cost for the identified cost-optimal measure 3.1.3. Cost optimal among all the interventions with incentives application
Figure 4 – Cost optimal concerning primary energy consumption and global cost for the proposed EEMs applying incentives calculation The calculation of incentive calculation shows the M 37.2 (Figure 4) as the cost optimal solution: in this case each element of the envelope is retrofitted (insulation on external walls, basement, roof and replacement of windows), a biomass boiler and photovoltaic system are installed and light system with LED lamps is considered, saving the overall energy need and the global cost during the lifespan (Table VII).
Heating Primary energy use Total Primary Energy use Investment Cost Annualized Global Cost
M 37.2 4.74 kWh/m2 4.85 kWh/m2 139.74 €/m2 9.10 €/m2
Table VII – Energy use and cost for the identified cost-optimal measure 3.1.4. Cost optimal among all nZEB measures considering incentive application
The M 37.2 comply with the nZEB parameters and it is confirmed as the best proposed solution (Figure 5). In case study n.1 the conversion on nZEB allows an higher energy saving in comparison to the reference and current situation or to the cost optimal solution, showing a similar annualised global cost (16.41 €/m2); the application of the
current national subsidy program allows to halve the global cost during the 30 years life span (-56%), even if the renovation measures regards all the building elements of envelope, corresponding to the highest investment cost due to the amount of interventions area and elements. In fact a single intervention on external wall is proposed as the cost optimal solution, corresponding to the best compromise of energy saving at lower global cost.
Figure 5 – Cost optimal concerning primary energy consumption and global cost for the proposed EEMs achieving nZEB target and applying incentives calculation
3.2. Case study n.2
The second case study proposed is the Girardini school. This building is larger than previously analyzed and it present a thermal envelope surface of 5035.51 m2, a heated volume of 6533.40 m3. The S/V is equal to 0.77: the shape
is more irregular than Manzoni school. The first phase develops an analysis on the building envelope (Table VIII).
Element Area
(m2) Thermal transmittance (W/m2K) Thermal dispersion (W/K) % by surface (m2) % by thermal dispersion (W/K)
Wall bricks with 2 heads 844.43 1.76 1487.04 17 % 18 %
Wall bricks with 3 heads 422.22 1.34 565.77 8 % 7 %
Semi-solid brick wall double 211.28 1.18 249.31 4 % 3 %
Reinforced concrete wall 427.52 1.63 696.86 9 % 7 %
Total wal 1905.45 - 2998.14 38 % 35 %
Windows 300.26 3.19 957.83 6 % 18 %
Roof 1492.70 1.75 2612.23 30 % 28 %
Ground floor 1337.10 1.39 1858.57 26 % 19 %
Total 5035.51 - 8426.77 100 % 100 %
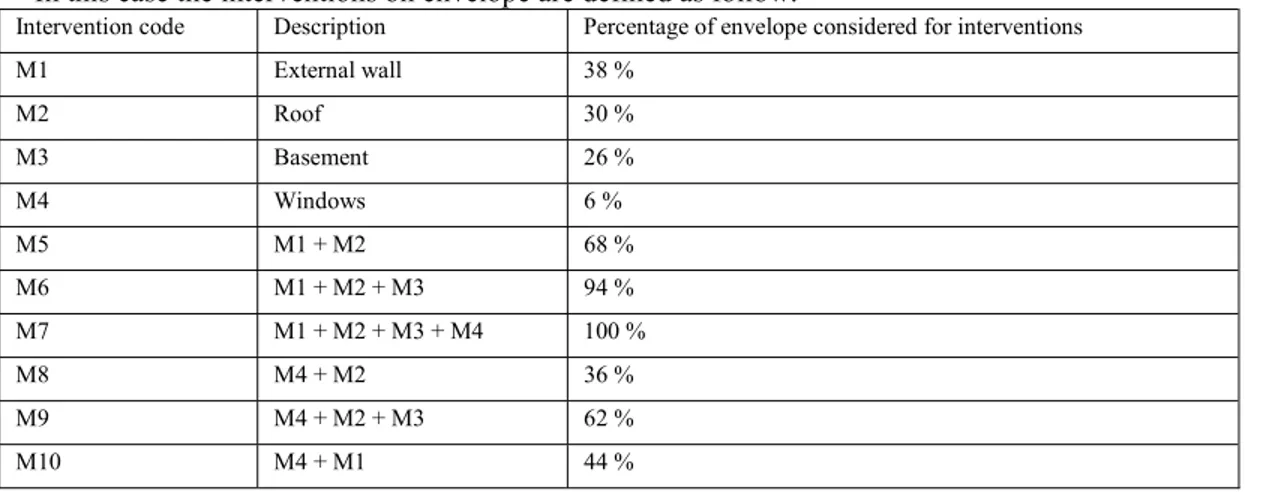
Table VIII - Area, thermal transmittance, thermal dispersion and percentage distribution of the envelope elements In this case the interventions on envelope are defined as follow:
Intervention code Description Percentage of envelope considered for interventions
M1 External wall 38 % M2 Roof 30 % M3 Basement 26 % M4 Windows 6 % M5 M1 + M2 68 % M6 M1 + M2 + M3 94 % M7 M1 + M2 + M3 + M4 100 % M8 M4 + M2 36 % M9 M4 + M2 + M3 62 % M10 M4 + M1 44 %
Table IX – Definition of EEMs for energy retrofitting on building envelope
The scheme in Table IX defines the different typologies of interventions and shows the percentage of the envelope interested to the retrofit according to the percentage subdivision by area. Table X describes the adopted characteristics for envelope and heating system taking into account the limits provided by the Conto Termico 2.0.
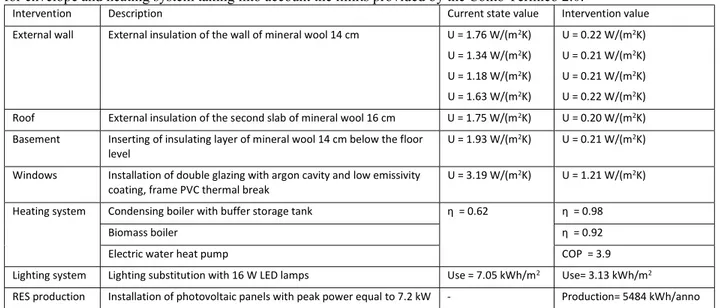
Intervention Description Current state value Intervention value
External wall External insulation of the wall of mineral wool 14 cm U = 1.76 W/(m2K)
U = 1.34 W/(m2K) U = 1.18 W/(m2K) U = 1.63 W/(m2K) U = 0.22 W/(m2K) U = 0.21 W/(m2K) U = 0.21 W/(m2K) U = 0.22 W/(m2K)
Roof External insulation of the second slab of mineral wool 16 cm U = 1.75 W/(m2K) U = 0.20 W/(m2K)
Basement Inserting of insulating layer of mineral wool 14 cm below the floor
level U = 1.93 W/(m
2K) U = 0.21 W/(m2K)
Windows Installation of double glazing with argon cavity and low emissivity
coating, frame PVC thermal break U = 3.19 W/(m
2K) U = 1.21 W/(m2K)
Heating system Condensing boiler with buffer storage tank η = 0.62 η = 0.98
Biomass boiler η = 0.92
Electric water heat pump COP = 3.9
Lighting system Lighting substitution with 16 W LED lamps Use = 7.05 kWh/m2 Use= 3.13 kWh/m2
RES production Installation of photovoltaic panels with peak power equal to 7.2 kW - Production= 5484 kWh/anno Table X – Description of proposed EEMs for the case study
As previously described, EEMs interventions have been combined in a same way (boiler, installation of photovoltaic system and LED lamps). The results are presented in a list referring to the different working phases. 3.2.1. Cost optimal among all the interventions
Figure 6 - Cost optimal concerning primary energy consumption and global cost for the proposed EEMs
The intervention M 31.1 (Figure 6) is the optimal solution: a condensing boiler is installed, an external insulation of mineral wool is adopted and LED lamps and PV panels are installed, resulting in a primary energy use of 49.97 kWh/m2 for years and an annualized global cost of 11.24 €/m2 during the lifecycle (Table XI).
Figure 5 – Cost optimal concerning primary energy consumption and global cost for the proposed EEMs achieving nZEB target and applying incentives calculation
3.2. Case study n.2
The second case study proposed is the Girardini school. This building is larger than previously analyzed and it present a thermal envelope surface of 5035.51 m2, a heated volume of 6533.40 m3. The S/V is equal to 0.77: the shape
is more irregular than Manzoni school. The first phase develops an analysis on the building envelope (Table VIII).
Element Area
(m2) Thermal transmittance (W/m2K) Thermal dispersion (W/K) % by surface (m2) % by thermal dispersion (W/K)
Wall bricks with 2 heads 844.43 1.76 1487.04 17 % 18 %
Wall bricks with 3 heads 422.22 1.34 565.77 8 % 7 %
Semi-solid brick wall double 211.28 1.18 249.31 4 % 3 %
Reinforced concrete wall 427.52 1.63 696.86 9 % 7 %
Total wal 1905.45 - 2998.14 38 % 35 %
Windows 300.26 3.19 957.83 6 % 18 %
Roof 1492.70 1.75 2612.23 30 % 28 %
Ground floor 1337.10 1.39 1858.57 26 % 19 %
Total 5035.51 - 8426.77 100 % 100 %
Table VIII - Area, thermal transmittance, thermal dispersion and percentage distribution of the envelope elements In this case the interventions on envelope are defined as follow:
Intervention code Description Percentage of envelope considered for interventions
M1 External wall 38 % M2 Roof 30 % M3 Basement 26 % M4 Windows 6 % M5 M1 + M2 68 % M6 M1 + M2 + M3 94 % M7 M1 + M2 + M3 + M4 100 % M8 M4 + M2 36 % M9 M4 + M2 + M3 62 % M10 M4 + M1 44 %
Table IX – Definition of EEMs for energy retrofitting on building envelope
The scheme in Table IX defines the different typologies of interventions and shows the percentage of the envelope interested to the retrofit according to the percentage subdivision by area. Table X describes the adopted characteristics for envelope and heating system taking into account the limits provided by the Conto Termico 2.0.
Intervention Description Current state value Intervention value
External wall External insulation of the wall of mineral wool 14 cm U = 1.76 W/(m2K)
U = 1.34 W/(m2K) U = 1.18 W/(m2K) U = 1.63 W/(m2K) U = 0.22 W/(m2K) U = 0.21 W/(m2K) U = 0.21 W/(m2K) U = 0.22 W/(m2K)
Roof External insulation of the second slab of mineral wool 16 cm U = 1.75 W/(m2K) U = 0.20 W/(m2K)
Basement Inserting of insulating layer of mineral wool 14 cm below the floor
level U = 1.93 W/(m
2K) U = 0.21 W/(m2K)
Windows Installation of double glazing with argon cavity and low emissivity
coating, frame PVC thermal break U = 3.19 W/(m
2K) U = 1.21 W/(m2K)
Heating system Condensing boiler with buffer storage tank η = 0.62 η = 0.98
Biomass boiler η = 0.92
Electric water heat pump COP = 3.9
Lighting system Lighting substitution with 16 W LED lamps Use = 7.05 kWh/m2 Use= 3.13 kWh/m2
RES production Installation of photovoltaic panels with peak power equal to 7.2 kW - Production= 5484 kWh/anno Table X – Description of proposed EEMs for the case study
As previously described, EEMs interventions have been combined in a same way (boiler, installation of photovoltaic system and LED lamps). The results are presented in a list referring to the different working phases. 3.2.1. Cost optimal among all the interventions
Figure 6 - Cost optimal concerning primary energy consumption and global cost for the proposed EEMs
The intervention M 31.1 (Figure 6) is the optimal solution: a condensing boiler is installed, an external insulation of mineral wool is adopted and LED lamps and PV panels are installed, resulting in a primary energy use of 49.97 kWh/m2 for years and an annualized global cost of 11.24 €/m2 during the lifecycle (Table XI).
Heating Primary energy use Total Primary Energy use Investment Cost Annualized Global Cost M 31.1 49,07 kWh/m2 49,97 kWh/m2 111,74 €/m2 11,24 €/m2
Table XI – Energy use and cost for the identified cost-optimal measure 3.2.2. Cost optimal among all the interventions achieving nZEB targets:
Figure 7 – Cost optimal concerning primary energy consumption and global cost for the proposed EEMs achieving nZEB targets According to nZEB benchmarks, the cost-optimal solution is M 40.2 (Figure 7); it includes the installation of biomass boiler and LED lamps, the realization of the external insulation, the substitution of external windows and, in addition, the installation of the photovoltaic system.
Heating Primary energy use Total Primary Energy need Investment Cost Annualized Global Cost M 40.2 8.91 kWh/ m2 9.09 kWh/ m2 172.25 €/m2 13.00 €/m2
Table XII – Energy use and cost for the identified cost-optimal measure 3.2.3. Cost optimal among all the interventions with incentives application
Figure 8 – Cost optimal concerning primary energy consumption and global cost for the proposed EEMs applying incentives calculation After the application of incentive calculation, the M 35.3 (Figure 8) represents the cost optimal solution, concerning the intervention on some elements of the envelope (insulation on external wall and roof), installation of electrical heat
pumps and PV panels, lighting substitution with LED lamps, saving the overall energy need and the global cost during the lifespan (Table XIII).
Heating Primary energy use Total Primary Energy use Investment Cost Annualized Global Cost
M 35.3 15.40 kWh/ m2 15.82 kWh/ m2 88.09 €/m2 6.92 €/m2
Table XIII – Energy use and cost for the identified cost-optimal measure 3.2.4. Cost optimal among all nZEB measures considering incentive application
The M 37.3 solution results as the best proposed solution (Figure 9) because of the complying with the nZEB parameters, concerning the intervention on all elements of the envelope (insulation on external wall, basement, roof and windows), installation of electrical heat pumps and PV panels, lighting substitution with LED lamps. Differently from the previous step, the total primary energy use is lower, in the face of an higher investment cost, but a very similar annualized global cost (Table XIV).
Heating Primary energy use Total Primary Energy use Investment Cost Annualized Global Cost M 37.3 10.27 kWh/ m2 10.69 kWh/ m2 108.56 €/m2 7.03 €/m2
Table XIV- Energy use and cost for the identified cost-optimal measure
Figure 9 – Cost optimal concerning primary energy consumption and global cost for the proposed EEMs achieving nZEB target and applying incentives calculation
The selection of three EEMs shows how the conversion on nZEB allows different possibilities and also need to consider different measures. The selected nZEB solutions allow an higher energy saving in comparison to the reference and current situation or to the cost optimal solution, also in the case with a similar annualised global cost (9.09 – 10.69 €/m2). The application of the current national subsidy program allows to halve the global cost during the 30 years life span (-50%), even if the renovation measure regards all the building elements of the envelope. A single intervention on external wall is proposed as the cost optimal solution.
4. Discussion
The results obtained from the possible retrofit of the two schools give the opportunity to consider some aspects about conversion into nZEB (Figure 10). The compactness ratio in Manzoni school (S/V = 0.46) allows intervention toward nZEB with lower investment costs than in Girardini school (S/V = 0.77): the second case study shows a
Heating Primary energy use Total Primary Energy use Investment Cost Annualized Global Cost M 31.1 49,07 kWh/m2 49,97 kWh/m2 111,74 €/m2 11,24 €/m2
Table XI – Energy use and cost for the identified cost-optimal measure 3.2.2. Cost optimal among all the interventions achieving nZEB targets:
Figure 7 – Cost optimal concerning primary energy consumption and global cost for the proposed EEMs achieving nZEB targets According to nZEB benchmarks, the cost-optimal solution is M 40.2 (Figure 7); it includes the installation of biomass boiler and LED lamps, the realization of the external insulation, the substitution of external windows and, in addition, the installation of the photovoltaic system.
Heating Primary energy use Total Primary Energy need Investment Cost Annualized Global Cost M 40.2 8.91 kWh/ m2 9.09 kWh/ m2 172.25 €/m2 13.00 €/m2
Table XII – Energy use and cost for the identified cost-optimal measure 3.2.3. Cost optimal among all the interventions with incentives application
Figure 8 – Cost optimal concerning primary energy consumption and global cost for the proposed EEMs applying incentives calculation After the application of incentive calculation, the M 35.3 (Figure 8) represents the cost optimal solution, concerning the intervention on some elements of the envelope (insulation on external wall and roof), installation of electrical heat
pumps and PV panels, lighting substitution with LED lamps, saving the overall energy need and the global cost during the lifespan (Table XIII).
Heating Primary energy use Total Primary Energy use Investment Cost Annualized Global Cost
M 35.3 15.40 kWh/ m2 15.82 kWh/ m2 88.09 €/m2 6.92 €/m2
Table XIII – Energy use and cost for the identified cost-optimal measure 3.2.4. Cost optimal among all nZEB measures considering incentive application
The M 37.3 solution results as the best proposed solution (Figure 9) because of the complying with the nZEB parameters, concerning the intervention on all elements of the envelope (insulation on external wall, basement, roof and windows), installation of electrical heat pumps and PV panels, lighting substitution with LED lamps. Differently from the previous step, the total primary energy use is lower, in the face of an higher investment cost, but a very similar annualized global cost (Table XIV).
Heating Primary energy use Total Primary Energy use Investment Cost Annualized Global Cost M 37.3 10.27 kWh/ m2 10.69 kWh/ m2 108.56 €/m2 7.03 €/m2
Table XIV- Energy use and cost for the identified cost-optimal measure
Figure 9 – Cost optimal concerning primary energy consumption and global cost for the proposed EEMs achieving nZEB target and applying incentives calculation
The selection of three EEMs shows how the conversion on nZEB allows different possibilities and also need to consider different measures. The selected nZEB solutions allow an higher energy saving in comparison to the reference and current situation or to the cost optimal solution, also in the case with a similar annualised global cost (9.09 – 10.69 €/m2). The application of the current national subsidy program allows to halve the global cost during the 30 years life span (-50%), even if the renovation measure regards all the building elements of the envelope. A single intervention on external wall is proposed as the cost optimal solution.
4. Discussion
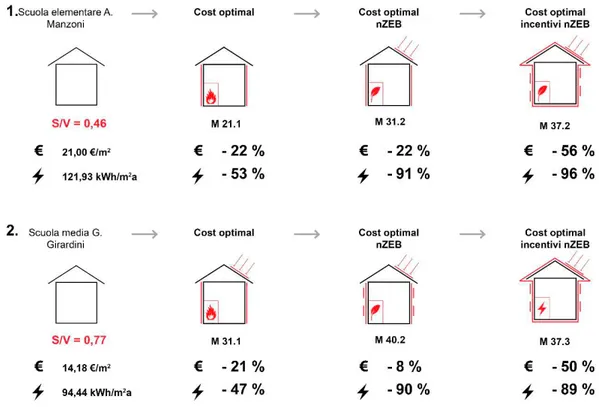
The results obtained from the possible retrofit of the two schools give the opportunity to consider some aspects about conversion into nZEB (Figure 10). The compactness ratio in Manzoni school (S/V = 0.46) allows intervention toward nZEB with lower investment costs than in Girardini school (S/V = 0.77): the second case study shows a
300 Author name / Energy Procedia 00 (2017) 000–000 T. Dalla Mora et al. / Energy Procedia 140 (2017) 288–302 13 perspective of similar energy saving in a 30 years against an higher investment cost and the global cost to convert into nZEB because of the highly fragmented geometrical volume.
The optimal intervention to transform the building into a Near Zero Energy Building in both cases presents the same configuration (M 37). This is achieved due to the high value of incentives, that derives from the high investment cost; moreover the performance as nZEB are achievable because the renovation regards all technological elements into the envelope, ensuring an economical saving given by the energy saving. Furthermore the installation of LED lamps and photovoltaic system for the production of energy from solar sources provide a high energy saving.
The latter factor is amplified as regards the Girardini school: the M 37.3 is the optimal measure for the transformation in nZEB, concerning interventions on each elements, a replacement the lighting system and the installation of a photovoltaic system; in comparison to Manzoni school, the Girardini school considers the installation of an electric heat pump instead of a biomass boiler: the difference is given because during the 30 years of lifecycle the investment costs for installing photovoltaic panels would be paid for itself thanks to the greater achievable energy benefits.
A similar consideration is also validated by the identification of simple optimal cost solution, that includes the installation of photovoltaic panels in the case of Girardini school, but not in the Manzoni school.
Figure 10 – comparison between the nZEB solution for the two school buildings 5. Acknowledgement
The authors would like to thank the Municipal Administration of Motta di Livenza (TV), for the availability of documents about the building, and Maria Pinamonti and Lorenzo Teso for the collaboration on the development of the methodology and the elaboration of energy simulations.
6. References
1 Directive 2002/91/EC of the European Parliament and of the Council of 16 December 2002 on the energy
performance of buildings (EPDB). Off. J. Eur. Communities 2003, p.L1/65–L1/71. [Available online: http://eur-lex.europa.eu/legal-content/EN/TXT/PDF/?uri=CELEX:32002L0091&from=IT]
2 Directive 2010/31/EU of the European parliament and of the council of 19 May 2010 on the energy performance
of buildings (EPBD recast). Off. J. Eur. Union 2010, 53. [Available online: http://eur-lex.europa.eu/LexUriServ/LexUriServ.do?uri=OJ:L:2010:153:FULL:EN:PDF]
3 Eurostat. Final Energy Consumption by Sector. 2014. Available online:
http://epp.eurostat.ec.europa.eu/portal/page/portal/statistics/search/database
4 JRC Science and Policy Report, Energy Renovation: The Trump Card for the New Start for Europe. 2015.
Available online: http://iet.jrc.ec.europa.eu/energyefficiency/system/tdf/eur26888_buildingreport_online.pdf?file=1&type=node&i
d=9069
5 De Santoli, L.; Fraticelli, F.; Fornari, F.; Calice, C. Energy performance assessment and retrofit strategies in public
school buildings in Rome. Energy Build. 2014, 68, 196–202. [Available online: http://dx.doi.org/10.1016/j.enbuild.2013.08.028]
6 http://www.school-of-the-future.eu/ 7 http://www.zemeds.eu/
8 https://www.renew-school.eu/ 9 http://www.veryschool.eu/
10 Energy Performance of Buildings, Economic Evaluation Procedure for Energy Systems in Buildings; UNI EN
15459; European Committee for Standardization: Brussels, Belgium, 2007.
11 Energy Performance of Buildings; Part 1 (2014): Evaluation of energy need for space heating and cooling. Part 2
(2014): Evaluation of primary energy need and of system efficiencies for space. Part 3 (2010): Evaluation of primary energy and system efficiencies for space cooling. Part 4 (2012): Renewable energy and other generation systems for space heating and domestic hot water production heating, domestic hot water production, ventilation and lighting for non-residential buildings; Technical regulation UNI/TS 11300; Ente Italiano di Normazione: Milano, Italy.
12 Commission Delegated Regulation (EU) No 244/2012 of 16 January 2012 Supplementing Directive 2010/31/EU of
the European Parliament and of the Council on the Energy Performance of Buildings by Establishing a Comparative Methodology Framework for Calculating Cost-Optimal Levels of Minimum Energy Performance Requirements for Buildings and Building Elements. Off. J. Eur. Union 2012, 55. [Available online: http://eur-lex.europa.eu/LexUriServ/LexUriServ.do?uri=OJ:L:2012:081:FULL:EN:PDF]
13 Guidelines Accompanying Commission Delegated Regulation (EU) No 244/2012 of 16 January 2012
supplementing Directive 2010/31/EU of the European Parliament and of the Council on the energy performance of buildings by establishing a comparative methodology framework for calculating cost-optimal levels of minimum energy performance requirements for buildings and building elements. Off. J. Eur. Union 2012, 55. [Available online: http://eur-lex.europa.eu/LexUriServ/LexUriServ.do?uri=OJ:C:2012:115:FULL:EN:PDF]
14 W. Ott, R. Bolliger, V. Ritter, S. Citherlet, D. Favre, B. Perriset, M. Almeida, M.Ferreira, (2014). Methodology for
Cost-Effective Energy and Carbon Emissions Optimization in Building Renovation (Annex 56) - Methodology and Assessment of Renovation Measures by Parametric Calculations. Energy in Buildings and Communities Programme of the International Energy Agency,Edited by University of Minho; Guimarães, Portugal, ISBN:978-989-95961-6-0.
15 IEA, I. E. (s.d.). EBC Energy in Buildings and Communities Programme. [Available online:
http://www.iea-annex56.org/]