Aircraft engine exhaust emissions and other
airport-related contributions to ambient air pollution
Masiol, Mauro; Harrison, Roy DOI:
10.1016/j.atmosenv.2014.05.070
License:
None: All rights reserved
Document Version
Peer reviewed version
Citation for published version (Harvard):
Masiol, M & Harrison, RM 2014, 'Aircraft engine exhaust emissions and other airport-related contributions to ambient air pollution: A review', Atmospheric Environment, vol. 95, pp. 409-455.
https://doi.org/10.1016/j.atmosenv.2014.05.070
Link to publication on Research at Birmingham portal
Publisher Rights Statement:
NOTICE: this is the author’s version of a work that was accepted for publication in the journal cited above. Changes resulting from the publishing process, such as peer review, editing, corrections, structural formatting, and other quality control mechanisms may not be reflected in this document. Changes may have been made to this work since it was submitted for publication. A definitive version was subsequently published as cited above.
Eligibility checked for repository: September 2014
General rights
Unless a licence is specified above, all rights (including copyright and moral rights) in this document are retained by the authors and/or the copyright holders. The express permission of the copyright holder must be obtained for any use of this material other than for purposes permitted by law.
•Users may freely distribute the URL that is used to identify this publication.
•Users may download and/or print one copy of the publication from the University of Birmingham research portal for the purpose of private study or non-commercial research.
•User may use extracts from the document in line with the concept of ‘fair dealing’ under the Copyright, Designs and Patents Act 1988 (?) •Users may not further distribute the material nor use it for the purposes of commercial gain.
Where a licence is displayed above, please note the terms and conditions of the licence govern your use of this document. When citing, please reference the published version.
Take down policy
While the University of Birmingham exercises care and attention in making items available there are rare occasions when an item has been uploaded in error or has been deemed to be commercially or otherwise sensitive.
If you believe that this is the case for this document, please contact [email protected] providing details and we will remove access to the work immediately and investigate.
1 1 2 3 4 5
AIRCRAFT ENGINE EXHAUST EMISSIONS
6
AND OTHER AIRPORT-RELATED
7
CONTRIBUTIONS TO AMBIENT AIR
8
POLLUTION: A REVIEW
9 10
Mauro Masiol and
Roy M. Harrison
∗†11
12
Division of Environmental Health and Risk Management
13
School of Geography, Earth and Environmental Sciences
14
University of Birmingham
15Edgbaston, Birmingham B15 2TT
16United Kingdom
17 18 19 20 21 22 23∗ To whom correspondence should be addressed.
Tele: +44 121 414 3494; Fax: +44 121 414 3708; Email: [email protected]
†
Also at: Department of Environmental Sciences / Center of Excellence in Environmental Studies, King Abdulaziz University, PO Box 80203, Jeddah, 21589, Saudi Arabia
2
Highlights
24
Aviation is globally growing (+5% y‒1) mainly driven by developing countries 25
Airport operations cause an increase in ground-level pollution 26
Chemical and physical properties of the emitted gases and particles are reviewed 27
An overview of other additional sources within airports is provided 28
Future research needs on aircraft emissions are highlighted 29
3
ABSTRACT
31
Civil aviation is fast-growing (about +5% every year), mainly driven by the developing economies 32
and globalization. Its impact on the environment is heavily debated, particularly in relation to 33
climate forcing attributed to emissions at cruising altitudes and the noise and the deterioration of air 34
quality at ground-level due to airport operations. This latter environmental issue is of particular 35
interest to the scientific community and policymakers, especially in relation to the breach of limit 36
and target values for many air pollutants, mainly nitrogen oxides and particulate matter, near the 37
busiest airports and the resulting consequences for public health. Despite the increased attention 38
given to aircraft emissions at ground-level and air pollution in the vicinity of airports, many 39
research gaps remain. Sources relevant to air quality include not only engine exhaust and non-40
exhaust emissions from aircraft, but also emissions from the units providing power to the aircraft on 41
the ground, the traffic due to the airport ground service, maintenance work, heating facilities, 42
fugitive vapours from refuelling operations, kitchens and restaurants for passengers and operators, 43
intermodal transportation systems, and road traffic for transporting people and goods in and out to 44
the airport. Many of these sources have received inadequate attention, despite their high potential 45
for impact on air quality. This review aims to summarise the state-of-the-art research on aircraft 46
and airport emissions and attempts to synthesise the results of studies that have addressed this issue. 47
It also aims to describe the key characteristics of pollution, the impacts upon global and local air 48
quality and to address the future potential of research by highlighting research needs. 49
50
Keywords: Aviation; atmospheric pollution; emissions; LTO cycles; particulate matter; oxides
51
of nitrogen 52
4
List of abbreviations
54
AAFEX Alternative Aviation Fuel Experiment 55
AEs Airport emissions 56
APEX Aircraft Particle Emissions eXperiment 57
APU Auxliary power unit 58
BC Black carbon
59
C* Effective saturation concentration 60
CIs Chemi-ions
61
CIMS Chemical ionisation mass spectrometry 62
EC Elemental carbon
63
EI Emission index
64
EXCAVATE EXperiment to Characterise Aircraft Volatile Aerosol and Trace-species Emissions
65
F00 Engine thrust expressed as a percentage of maximum rated power
66
FGEP Fixed ground electrical power 67
FSC Fuel sulfur content 68
FT Fischer-Tropsch fuel 69
GMD Geometric number mean diameter 70
GPUs Ground power units 71
GRPs Ground running procedures 72
GSEs Ground service equipments 73
ICAO International Civil Aviation Organization 74
LTO Landing and take-off cycle 75
OC Organic carbon
76
NMHC Non-methane hydrocarbon 77
NOx Nitrogen oxides (NO+NO2) 78
NOy Reactive odd nitrogen (NOx and their oxidation products)
5
OA Organic aerosol
80
PAHs Polycyclic aromatic hydrocarbons 81
PM Particulate matter 82
PM1 Particulate matter (aerodynamic diameter less than 1 µm)
83
PM2.5 Particulate matter (aerodynamic diameter less than 2.5 µm)
84
PM10 Particulate matter (aerodynamic diameter less than 10 µm)
85
RF Radiative forcing 86
RPK Revenue passenger kilometres 87
RTK Revenue tonne kilometres 88
SARS Severe acute respiratory syndrome 89
SIA Secondary inorganic aerosol 90
SN Smoke number
91
SOA Secondary organic aerosol 92
SVOCs Semi-volatile organic compounds 93 TC Total carbon 94 TF Turbofan engine 95 TIM Time-in-mode 96 TJ Turbojet engine 97 TP Turboprop engine 98 TS Turboshaft engine 99
UFP Ultrafine particles (diameter <100 nm) 100
UHC Unburned hydrocarbons 101
VOCs Volatile organic compounds 102
ε Abundance ratio (( SO3+H2SO4) /total sulfur) 103
ξ Partitioning coefficient 104
6
1. INTRODUCTION
106
Among pollution issues, poor air quality attracts a high level of interest within the scientific 107
community and engages public opinion because of the known relationship between exposure to 108
many air pollutants and increased adverse short- and long-term effects on human health (e.g., 109
Schwartz, 1997; Ayres, 1998; Brunekreef and Holgate, 2002; Kampa and Castanas, 2008; Maynard, 110
2009; Yang and Omaye, 2009; Rückerl et al., 2011). In addition, air pollution can seriously impair 111
visibility (Hyslop, 2009), may damage materials in buildings and cultural heritage (Watt et al., 112
2009; Screpanti and De Marco, 2009) and has direct and indirect effects upon climate (Ramanathan 113
and Feng, 2009). While air pollution remains a major concern for developing countries (Fenger, 114
2009; Liaquat et al., 2010) as a result of the rapid growth of population, energy demand and 115
economic growth, developed countries have experienced a significant decline in the concentrations 116
of many air pollutants over the past decade. 117
118
Airport emissions (AEs) have received increasing attention in recent years because of the rapid 119
growth of air transport volumes and the expected expansion to meet capacity needs for future years 120
(Amato et al., 2010; Kurniawan and Khardi, 2011; Kinsey et al., 2011). Most studies highlight 121
knowledge gaps (e.g., Webb et al., 2008; Wood et al., 2008a; Lee et al., 2010) which are a matter of 122
concern as the literature indicates that aircraft emissions can significantly affect air quality near 123
airports (Unal et al., 2005; Carslaw et al., 2006; Herndon et al., 2008; Carslaw et al., 2008; 124
Mazaheri et al., 2009; Dodson et al., 2009) and in their surroundings (Farias and ApSimon, 2006; 125
Peace et al., 2006; Hu et al., 2009; Amato et al., 2010; Jung et al., 2011; Hsu et al., 2012). Emission 126
standards for new types of aircraft engines have been implemented since the late 1970s by the 127
International Civil Aviation Organization (ICAO) through the Committee on Aircraft Engine 128
Emissions (CAEE) and the subsequent Committee on Aviation Environmental Protection (CAEP). 129
One of the key actions of the ICAO committees was the provision on engine emissions in Volume 130
II of Annex 16 to the Convention on International Civil Aviation, the so-called “Chicago 131
7
Convention”, which recommended protocols for the measurement of carbon monoxide (CO), 132
nitrogen oxides (NO+NO2=NOx), unburned hydrocarbons (UHC) and smoke number (SN) for new 133
engines (ICAO, 2008). Standards were listed on a certification databank (EASA, 2013), which 134
represents a benchmark for engine emissions performance and is used in many regulatory 135
evaluations (ICAO, 2011). This regulation has produced significant improvements in engine and 136
fuel efficiency and technical progress to reduce emissions. However, although these efforts have led 137
to a substantial reduction in direct aircraft emissions over the past two decades, these gains may be 138
offset by the forecast growth of the aviation industry and the resulting increase in airport traffic 139
(ICAO, 2011). Furthermore, the ICAO regulation address only four main generic pollutants and a 140
more detailed chemical and physical characterization of exhausts is required to quantitatively and 141
qualitatively assess aircraft emissions. An increasing number of studies provide a detailed chemical 142
speciation for many exhaust compounds, including gases and airborne particulate matter (e.g., 143
Anderson et al., 2006; Herndon et al., 2008; Agrawal et al., 2008; Mazaheri et al., 2009; Onash et 144
al., 2009; Herndon et al., 2009; Kinsey et al., 2011; Mazaheri et al., 2011; Santoni et al., 2011). 145
However, the literature remains very sparse and many questions remain unresolved because of the 146
large differences in measurement strategies, technologies and methods, compounds analysed and 147
environments studied. 148
149
Aircraft exhausts are only one of several sources of emission at an airport (ICAO, 2011). Although 150
exhaust plumes from aircraft engines were conventionally considered to account for most of the 151
emissions, other sources are present within modern airports and contribute to air pollution at the 152
local scale. Among these, tyre, brake and asphalt wear and the re-suspension of particles due to the 153
turbulence created by the aircraft movements can account for large fractions of total particulate 154
matter mass (e.g., British Airports Authority, 2006), but their chemical and physical characteristics 155
have been investigated in only a few studies (Bennett and Christie, 2011; Bennett et al., 2011). 156
Moreover, the emissions of the units providing power to the aircraft on the ground have received 157
8
relatively little consideration despite their potentially high impact on the local air quality (Schäfer et 158
al., 2003; Ratliff et al., 2009; Mazaheri et al., 2011). These units include the auxiliary power units 159
(APUs), which are small on-board gas-turbine engines, and the ground power units (GPUs) 160
provided by airports. In addition, airport ground service equipment (GSEs) further impact the air 161
quality (e.g., Nambisan et al., 2000; Amin, 2001; Schäfer et al., 2003). GSEs include most of the 162
equipment that an airport offers as a service for flights and passengers and includes a large number 163
of vehicles, such as passenger buses, baggage and food carriers, container loader, refilling trucks, 164
cleaning, lavatory services and de/anti-icing vehicles, and tugs, which are used to move any 165
equipment or to push the aircraft between gates and taxiways. Only few studies are available on the 166
air traffic-related emissions produced by ground services such as GSEs, GPUs or APUs (e.g., Webb 167
et al., 2008; Ratliff et al., 2009; Mazaheri et al., 2011; Presto et al., 2011). 168
169
Additional sources may also be present at airports, including maintenance work, heating facilities, 170
fugitive vapours from refuelling operations, kitchens and restaurants for passengers and operators, 171
etc. Moreover, as many airports are located far from cities, their emission inventories should also 172
include sources not directly present within a terminal, but on which the airport has an influence. 173
These sources may include intermodal transportation systems or road traffic including private cars, 174
taxis, shuttle buses and trucks for transporting people and goods in and out of the airport. 175
176
As most large airports are located near heavily populated urban settlements, in combination they 177
have a potentially significant impact on the environment and health of people living in their 178
vicinity. For example, 150 airports in the USA are located in areas designated to be in non-179
attainment for one or more criteria air pollutants (Ratliff et al., 2009). In undertaking air quality 180
assessments and the development of successful mitigation strategies, it is therefore fundamental to 181
consider all the aspects associated with the entire “airport system”. However, current information 182
on many aspects of this polluting source is inadequate, including a detailed speciation of 183
9
hydrocarbons, physicochemical characteristics of particles, volatile and semi-volatile emissions and 184
especially the secondary transformations from the aging of aircraft exhausts and other airport-185
related emissions. Some of these gaps are well summarised in a US Transportation Research Board 186
report (Webb et al., 2008). 187
188
1.1 Aims and Outline of the Review
189
Since the scientific literature on AEs remains very sparse and many questions are still open, this 190
review aims to summarise the state-of-the-art of airport emissions research and attempts to 191
synthesise and analyse the published studies. An overview of current information on airport-related 192
emissions is presented and the key characteristics of the pollution and the impacts on the local and 193
global air quality are discussed. This review further summarises the various methodologies used for 194
measurements and attempts to critically interpret the data available in the literature. Finally, this 195
review will highlight priority areas for research. 196
197
The next section traces the main stages of the development of civil aviation, by focusing especially 198
on the changes and development strategies of modern airport systems. Recent traffic data and 199
statistics are presented and the trends are also discussed in order to understand the potential future 200
growth of air transport, which is fundamental to forecasting the impacts of aviation in future years. 201
The third section gives an overview of the operation of aircraft engines, briefly discusses the most 202
widely used technologies, describes some fuel characteristics, such as the sulfur content, and 203
analyses the current use and future jet fuel consumption scenarios. The fourth section reviews the 204
current information on aircraft engine exhaust: the landing and take-off cycles are described since 205
they are commonly used to assess aircraft emissions during the operational conditions within an 206
airport and within the atmospheric surface boundary layer; the main gaseous and particulate-phase 207
compounds emitted by aircraft are listed and their key chemical and physical characteristics are 208
described in separate subsections. A summary of data on the emission indices for many pollutants is 209
10
also provided. The fifth section describes the non-exhaust emissions related to aircraft operations, 210
such as the tyre and brake wear and the re-suspension of runway material, which have been little 211
investigated even though they may have serious impacts on local air quality. The sixth section 212
reviews data on the non-aircraft emissions potentially present within an airport, including the 213
ground service equipment emissions, the auxiliary/ground power units and others. The seventh 214
section presents the results of studies conducted indoors and outdoors at airports to directly assess 215
the impacts of AEs upon human health. Finally, this paper reviews the results of the recent literature 216
on aircraft emissions and other airport-related contributions to highlight the potential role of AEs 217
upon local air quality. 218
219
2. PRESENT SCENARIOS AND FUTURE PERSPECTIVES OF CIVIL AVIATION
220
AND AIRPORTS
221
The Airport Council International (ACI, 2013) has reported recent statistics on the air traffic 222
volumes for 2012: more than 79 million aircraft movements carried annually 5.7 billion passengers 223
between 1,598 airports located in 159 countries, and reported that the total cargo volume handled by 224
airports was 93 million tonnes. However, these numbers are expected to further increase in the 225
forthcoming decades: in the past half century, the aviation industry has experienced a strong and 226
rapid expansion as the world economy has grown and the technology of air transport has developed 227
(Baughcum et al., 1999). Generally, air traffic has been expressed as revenue passenger kilometres 228
(RPKs) by multiplying the number of revenue-paying passengers aboard the vehicle by the travelled 229
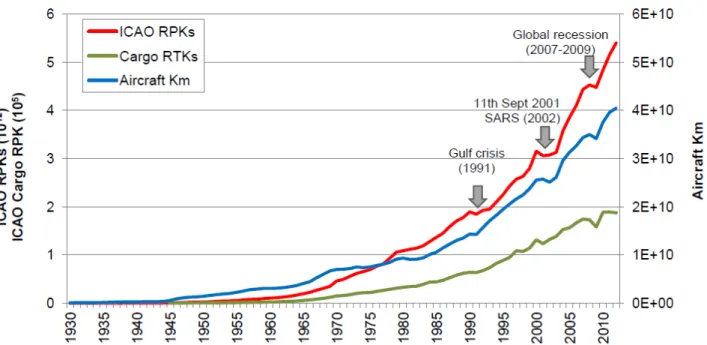
distance, or occasionally in revenue tonne kilometres (RTK). Figure 1 shows the absolute growth of 230
aviation recorded by ICAO in terms of RPK, RTK and aircraft kilometres from the 1930s to today 231
(ICAO, 2013; Airlines for America, 2013). Despite some global-scale events, such as the Gulf crisis 232
(1991), the terrorist attack of 11th September 2011, the outbreak of severe acute respiratory 233
syndrome (SARS) in 2002‒2003 and the recent global economic crisis (2008‒2009), an average 234
annual growth rate of 5% was observed and this trend is expected to continue over the next decades 235
11
mainly driven by the economic growth of emerging regions (ACI, 2007; 2008; Airbus, 2012; 236
Boeing, 2013). It is anticipated that there will be more than 9 billion passengers globally by 2025 237
and more than 214 million tonnes of total world freight traffic are forecast over almost 120 million 238
air traffic movements (ACI, 2007). The future growth of air transport will inevitably lead to the 239
growth of airline fleets and route networks and will therefore lead to an associated increase in 240
airport capacity in terms of both passengers and cargo. This poses questions as to the consequent 241
impact on air quality. 242
243
3. AIRCRAFT: CHARACTERISTICS AND IN-USE TECHNOLOGIES
244
Emissions from aircraft engines are recognised as a major source of pollutants at airports and have 245
been extensively investigated over the past 40 years. Initially, the main historical concern for 246
supersonic aircraft was over stratospheric ozone depletion (Johnston, 1971) and secondarily about 247
the formation of contrails at cruising heights (Murcray, 1970; Schumann, 2005) and indirect effect 248
on the Earth’s radiative budgets (Kuhn, 1970). Apart the development of the Concorde and the 249
Tupolev Tu-144, a supersonic fleet flying in the stratosphere was never developed and today all 250
commercial airliners are subsonic equipped with turbofan or turboprop engines. Therefore, the main 251
present issue arising from civil aviation has today shifted to the increased levels of ozone in the 252
upper troposphere and lower stratosphere resulting from the atmospheric chemistry of emitted NOx 253
(Lee et al., 2010 and reference therein). Furthermore, the development of increasingly restrictive 254
legislation on ambient air quality and the implementation of enhanced monitoring networks in many 255
developed countries has highlighted the effects of aircraft emissions at ground-level and the 256
deterioration of air quality near airports. 257
258
3.1 Engines
259
Engines for civil and general aviation are generally classified as gas turbine engines (turbofan and 260
turboprop) fuelled with aviation kerosene (also named jet fuel) and internal combustion piston 261
12
engines fuelled with aviation gasoline, often referred as avgas (ICAO, 2011). The majority of 262
modern airliners are equipped with turbofan engines. These engines are derived from predecessor 263
turbojet engines developed during World War II. A turbojet is composed of an inlet compressor, a 264
combustion section adding and igniting fuel, one or more turbines extracting energy from the 265
exhaust gas in expansion and driving the compressor. A final exhaust nozzle accelerates the exhaust 266
gas from the back of the engine to generate thrust. Turbofan engines use a turbojet as a core to 267
produce energy for thrust and for driving a large fan placed in front of the compressor. In modern 268
airliners, the fan provides most of the thrust. The “bypass ratio” refers to the ratio of mass flux 269
bypassing the combustor and turbine to the mass flux through the core: high-bypass ratios are 270
preferred for civil aviation for good fuel efficiency and low noise. Some small and regional airliners 271
are instead equipped with turboprop engines, which use a turbine engine core fitted with a reduction 272
gear to power propellers. A simplified diagram of a turbofan engine is provided in Figure 2. In 273
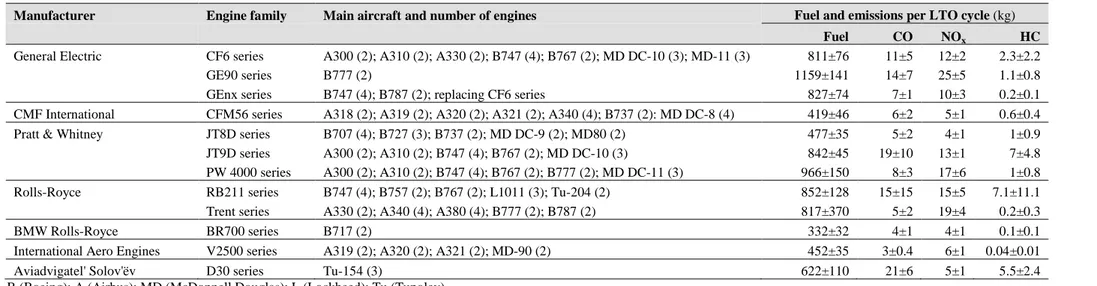
August 2013 the ICAO (EASA, 2013) listed a total of 487 in-use turbofan engines (including 274
packages): Table 1 provides a summary of the current engine families mounted in the most popular 275
airliners (75% of total in-use turbofan engines). 276
277
Reciprocating piston engines are predominately fitted in small-sized aircraft typically related to 278
private use, flying clubs, flight training, crop spraying and tourism. Internal piston engines run 279
under the same basic principles as spark ignition engines for cars, but generally require higher 280
performance. Four-stroke-cycle engines are commonly used, more rarely these can be two-stroke 281
and occasionally diesel. The principal difference between jet and piston engines is that combustion 282
is continuous in jet engines and intermittent in piston engines. Other flying vehicles may be present 283
within an airport, such as helicopters. These vehicles are usually less numerous than the airliners in 284
most terminals, but in some circumstances their contribution to the air quality cannot be 285
disregarded. Today, most modern helicopters are equipped with turboshaft engines, whose 286
13
functioning is similar to a turbojet but are optimised to generate shaft power instead of jet thrust. 287
This review abbreviates turbojet (TJ), turbofan (TF), turboprop (TP) and turboshaft (TS). 288
289
3.2 Fuel Characteristics
290
At the current time, almost all aviation fuel (jet fuel) is extracted from the middle distillates of crude 291
oil (kerosene fraction), which distils between the gasoline and the diesel fractions. The kerosene-292
type fuels most used worldwide in civil aviation are of Jet A and Jet A-1 grades: Jet A is used in 293
most of the world, except North America where Jet A-1 is used. An exhaustive review of jet fuel 294
production processes is given elsewhere (Liu et al., 2013). The specifications of such fuels are 295
addressed by two organizations, the American Society for Testing and Materials (ASTM) and the 296
United Kingdom Ministry of Defence (MOD). Jet A is used for almost all commercial aviation 297
flying within or from the USA and is supplied against the ASTM D1655 specification. It has a 298
flash point minimum of 38°C and a freeze point maximum of −40°C. Jet A-1 is widely used outside 299
the USA and follows the UK DEF STAN 91-91 (Jet A-1) and ASTM D 1655 (Jet A-1) 300
specifications. It has same flash point as Jet A but a lower freeze point (maximum of ‒47°C) and a 301
mean C/H ratio of C12H23 (Lewis et al., 1999; Chevron Corporation, 2006; Lee et al., 2010). Other 302
fuels can be used as an alternative to Jet A-1. Jet B is a wide-cut type fuel covering both the naphtha 303
and kerosene fractions of crude oil and is used in very cold climates, e.g. in northern Canada where 304
its thermodynamic characteristics (mainly lower freeze point and higher volatility) are suitable for 305
handling and cold starting. ASTM publishes a specification for Jet B, but in Canada it is supplied 306
against the Canadian specification CAN/CGSB 3.23. Other specifications also exist such as 307
DCSEA (France) and GHOST (Russia). TS-1 is the main jet fuel grade available in Russian and 308
CIS states, along with T-1, T-2 and RT; it is a kerosene-type fuel with slightly higher volatility 309
(flash point is 28°C minimum) and lower freeze point (<−50°C) compared to Jet A and A-1 fuels. 310
Various types of jet fuels are instead regulated by Chinese specifications: RP-1 and RP-2 are 311
kerosene-type fuels similar to Russian TS-1, while RP-4 to Jet B. Nowadays, virtually all jet fuel in 312
14
China is RP-3, which is quite comparable to Jet A-1 (Shell, 2013). Fuels for military purposes are 313
formulated for high-performances and are regulated separately by many governments; some of 314
these (JP grades for USA and NATO forces) were used in several studies (e.g., Anderson et al., 315
2006; Chen et al., 2006; Cowen et al., 2009; Cheng et al., 2009; Cheng and Corporan, 2010; 316
Santoni et al., 2011). The kerosene-based JP-8 grade is currently the primary fuel for NATO 317
aircraft. Corporan et al. (2011) reported some JP-8 characteristics. 318
319
Jet fuels are a mixture of thousands of different hydrocarbons. The range of their molecular weights 320
is restricted by the distillation: in kerosene-type fuels (e.g., Jet A and Jet A-1) the carbon number 321
ranges between about 8 and 16, while in wide-cut jet fuels (Jet B), between about 5 and 15. Spicer 322
et al. (1994) reported that jet fuel is primarily composed of species with five or more carbons and 323
70% of the compounds by weight contain 11–14 carbon atoms. Most of the hydrocarbons in jet fuel 324
are members of the normal parafins, iso-paraffin, cycloparaffin, aromatic and alkene classes: 20% 325
n-paraffins, 40% iso-paraffin, 20% naphthenes and 20% aromatics are typical (Lindstedt and
326
Maurice, 2000; Liu et al., 2013 and reference therein). Moreover, a series of different additives are 327
required or approved for use by ASTM and DEF STAN specifications to enhance or maintain some 328
fuel properties, improve performance or handling. Among those approved for Jet A and Jet A-1 329
fuels, some hindered phenols serve as antioxidants, the di-ethylene glycol monomethyl ether acts as 330
icing inhibitor, the N,N´-disalicylidene-1,2-propane diamine is added as chelating agent for many 331
metal ions. Other additives act as electrical conductivity/static dissipaters, corrosion inhibitor and 332
biocides: a summary is listed in Chevron Corporation (2006). 333
334
The aviation industry is nowadays investing significant effort towards the use of alternative fuels 335
(Blakey et al., 2011; Williams et al., 2012). Since aircraft emissions are recognised to be closely 336
linked to the fuel composition (Beyersdorf et al., 2013 and reference therein), recently the 337
introduction of synthetic fuels and bio-fuels instead of common oil-derivate jet fuels has been much 338
15
discussed in terms of beneficial effects upon exhaust emissions (e.g., Corporan et al., 2005; 2007; 339
DeWitt et al., 2008; Timko et al., 2010a; Corporan et al., 2011; Lobo et al., 2011; Williams et al., 340
2012; Cain et al., 2013). Among others, the Fischer-Tropsch (FT) fuel seems to be a potential 341
candidate for replacing, or mixing with, oil-derived conventional jet fuels. The FT reaction was 342
developed in the first half of twentieth century and uses a mixture of carbon monoxide and 343
hydrogen to produce a complex product stream of paraffins, olefins, and oxygenated compounds 344
such as alcohols and aldehydes via product upgrading (e.g., cracking, fractionation, and 345
isomerisation). The mechanism is explained in Liu et al. (2013). The FT process leads to a fuel with 346
low aromatic content and no sulfur, which are reported to be beneficial in reduction of emissions of 347
particulate matter and its precursors from aircraft engines (Corporan et al., 2007; Timko et al., 348
2010a; Lobo et al., 2011). Corporan et al. (2011) report gas chromatograms and hydrocarbon 349
content of JP-8 and various alternative jet fuels. To study the effects of FT fuel usage on aircraft 350
gaseous and particulate emissions the Alternative Aviation Fuel Experiment (AAFEX) was carried 351
out in 2009: results are spread across various papers (e.g., Lee et al., 2011; Santoni et al., 2011; 352
Anderson et al., 2011; Kinsey et al., 2012a,b; Beyersdorf et al., 2013). 353
354
Avgas for general aviation is distilled separately from the most common motor gasoline and is 355
formulated for stability, safety, and predictable performance under a wide range of environments. 356
Nowadays there are two main grades (100 and 100LL low lead) regulated by the ASTM D 910 and 357
UK DEF STAN 91-90 specifications. Tetraethyl Pb is added to avgas for increasing fuel octane and 358
avgas 100LL has a lead content up to 0.56 g Pb L‒1. The impact of general aviation is under 359
discussion, since it was reported as one of the largest remaining source of lead emissions to the air 360
in the USA (e.g., Carr et al., 2011). Avgas is principally composed of isoparaffinic and aromatic 361
hydrocarbons and their carbon numbers vary from about 4 (butane) to 10, with the most prevalent 362
carbon number being 8 (Chevron Corporation, 2006). It may include tetraethyl lead as antiknock 363
additive, icing inhibitors, antioxidants and others. 364
16
3.3 Sulfur Content in Fuels
365
Over the past decades there has been a worldwide trend to decrease sulfur content in fuels and many 366
jurisdictions, including the USA and the European Union, have recently required very low sulfur 367
levels in road and marine fuels to reduce the SOx and particulate matter emissions from the 368
transport sector. A similar reduction has not occurred for jet fuel although at the beginning of the 369
2000s the IPCC indicated that reducing the sulfur content of kerosene will reduce SOx emissions 370
and sulphate particle formation (IPCC, 1999). The maximum sulfur content of aviation fuel has 371
remained at 3 g S kg fuel‒1, or 3000 ppm by mass (Lewis et al., 1999; Ebbinghaus and Wiesen, 372
2001; Anderson et al., 2005; Barrett et al., 2012). However, lower values of fuel sulfur content 373
(FSC) have commonly been reported: Fahey et al.(1999) stated that in the world market at the 374
beginnings of the 2000s the FSC was near 400 ppm; Hileman et al. (2010) reported that average 375
FSC in commercial Jet A, Jet A-1 and military JP-8 fuel grades varied between 550 to 750 ppm; 376
Agrawal et al. (2008) reported that FSC in the fuel was 300 ppm. Popovicheva et al. (2004) and 377
Demirdjian et al. (2007) reported that the aviation kerosene TS-1 has a FSC of 1100 ppm and less 378
than 10−4 wt.% of metals. 379
380
FSC in jet fuels is directly related to the SO2 emissions in aircraft exhaust (e.g., Arnold et al., 381
1998a; Schumann et al., 1998; Hunton et al., 2000). Some research projects, such as APEX-1, were 382
designed to study the effects of FSC on aircraft engine emissions (e.g., Wey et al., 2006; 2007; 383
Kinsey, 2009; Onash et al., 2009). Generally the studies reported that the emissions of both SO2 and 384
sulphates are proportional to S levels in fuels, but no systematic difference between the low and 385
high sulfur fuels in terms of other emitted organic sulfur species (OCS and CS2) were reported 386
(Anderson et al., 2006). The conversion of S(IV) to S(VI) is amply discussed later in this review. 387
388
Recently, the impact of ultra-low sulfur jet fuel (15 ppm) upon public health, climate, and 389
economics was examined by Barrett et al. (2012). They reported that the use of ultra-low sulfur 390
17
fuels on a global-scale will cost 1−4 billion US $ per year, but may prevent 900−4000 air quality-391
related premature mortalities per year. Moreover, Barrett and co-authors also stated that the 392
radiative forcing (RF) associated with reductions in atmospheric sulphate, nitrate, and ammonium 393
loading can be estimated as +3.4 mW m‒2, i.e. equivalent to about 1/10th of the warming due to 394
CO2 emissions from aviation. 395
396
3.4 Current Use and Future Jet Fuel Consumption Scenarios
397
The availability of reliable information on fuel consumption is essential to make robust estimates of 398
aviation emissions at both global and regional scales. Various estimates of aviation fuel 399
consumption are available in the literature and generally refer only to jet fuel, since piston-powered 400
flights were estimated to account for approximately 2% of propeller (piston plus turboprops) and ~ 401
0.05% of total (propeller plus jet) fuel burn (Kim et al., 2007). Gauss et al. (2006) estimated a total 402
of 169 Tg fuel globally burned in 2000, of which 152 Tg is due to civil flights. The AERO2k global 403
aviation emissions inventories reported a total of 176 Tg of kerosene used in 2002 for both civil 404
(156 Tg) and military (19.5 Tg) aviation (Eyers et al., 2004); other studies of the 2000-2005 period 405
estimated that the global aviation industry consumed approximately 170-203 Tg of kerosene per 406
year with an evident decrease in 2001-2002 following the drop of aviation traffic due to the 11th 407
September 2001 and SARS events (Kim et al., 2007); Wilkerson et al. (2010), Whitt et al. (2011) 408
and Olsen et al. (2013) reported that the global commercial aircraft fleet burned 188 Tg of fuel in 409
2006; Chèze et al. (2011) reported a world consumption of 229 Mt of jet fuel in 2008. These 410
estimates accounted for approximately 3% of current annual fossil fuel energy usage (Barrett et al., 411
2010, and reference therein). Data from OPEC (Mazraati, 2010) stated that the aviation sector in 412
2006 was the second major consumer of total oil demand in the transportation sector ( 11.2%) and 413
accounted for 5.8% of total oil consumed in the world. Given the past and future growth of the 414
aviation industry, this consumption may rise further: AERO2k emission inventories estimated a 415
forecast scenario for 2025 in which the fuel demand for aviation will be 327 Tg y‒1 (Eyers et al., 416
18
2004); Chèze et al. (2011) reported that the world jet fuel demand is projected to grow by 38% 417
between 2008 and 2025, rising to more than 316 Mt in 2025 at a mean growth rate of 1.9% per year. 418
Owen et al. (2010) estimated the future global aviation emissions under four of the IPCC/SRES 419
(Intergovernmental Panel on Climate Change/Special Report on Emissions Scenarios) marker 420
scenarios and reported a fuel use of 336 Tg in 2020 and varying from 426 and 766 Tg for 2050. 421
This study also reported an estimate of 325 Tg for 2050 if the ambitious technology targets of the 422
Advisory Council for Aeronautical Research in Europe (ACARE, 2002) were to be achieved. Table 423
2 summarises the yearly global fuel consumption reported in recent studies. However, aviation 424
traffic growth and jet fuel demand have been shown not to be strictly correlated, since the 425
efficiencies of aircraft engines and air traffic management are improving and modern airliners are 426
75% quieter with consequent fuel consumption reduced by 70% with respect to the 1960s 427
(Baughum et al., 1999; Nygren et al., 2009, and references therein). In particular, the current 428
average fuel consumption of in-use fleets was estimated to be less than 5 L fuel every 100 RPK, 429
while in most modern aircraft it drops to approximately 3.5 L / 100 RPK: Nygren et al. (2009) 430
reported the historical world fleet of aircraft average fuel consumption and found an exponential 431
trend in fuel consumption reduction from 1987 to the present day. Oil prices have driven investment 432
in more efficient aircraft models. Fuel costs exceed those of labour costs for airlines. Fuel costs 433
accounted for ~13% of total costs in 2002, but today they are closer to 34% (Boeing, 2013). 434
435
4. AIRCRAFT EXHAUST EMISSIONS
436
Emissions from aircraft engines are generally considered to be the dominant source at airports and 437
the large majority of studies available in the literature focus on aircraft emissions. Common 438
airliners burning kerosene-type fuels primarily produce carbon dioxide and water (Wahner et al., 439
1995; Lewis et al.,1999; Anderson et al., 2006; Lee et al., 2010), which are directly related to the 440
burned fuel, with minor variations due to the carbon-hydrogen ratio of the fuel. In this context, it is 441
19
reported that the fuel flow of common airliner engines is approximately linearly proportional to 442
engine thrust setting (e.g., Anderson et al., 2005; Wey et al., 2006). 443
444
The oxidation of atmospheric nitrogen at the very high temperatures in engine combustors drives 445
the formation of nitrogen oxides, while the presence of trace amounts of sulfur, nitrogen and some 446
metals (e.g., Fe, Cu, Zn) in fuels (Lewis et al., 1999) and non-ideal combustion conditions within 447
engines may lead to the production of by-products, including sulfur oxides, additional nitrogen 448
oxides, unburned hydrocarbons and particulate soot. Furthermore, exhausts can also contain species 449
from the combustion and release of lubricant oils (Dakhel et al., 2007; Timko et al., 2010b; Yu et 450
al., 2010; Kinsey et al., 2011; Yu et al., 2012) and from mechanical component wear (Petzold et al., 451
1998; Demirdjian et al., 2007). Therefore a more realistic, but simplified, combustion scheme in 452
aircraft engines can be summarised as (Lee et al., 2009): 453
CnHm+N2+O2+S→CO2+N2+H2O+O2+CO+SOx+NOx+HC+soot 454
IPCC reported that approximately 99.5-99.9% of the molar content of typical commercial engine 455
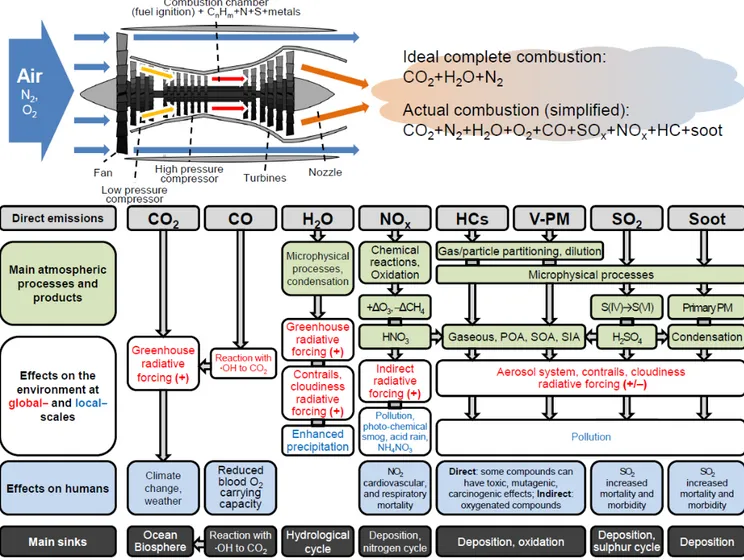
exhaust consists of N2, O2, CO2, and H2O (Lewis et al., 1999). Figure 3 reports a more detailed 456
breakdown of combustion products for a core engine mass flow: the combustion products in aircraft 457
exhausts are mainly made up of CO2 (~72%), H2O (~27.6%), while residual products account for 458
less than 1%. Figure 2 summarises the main exhaust components of aircraft engines and their 459
potential effects on the environment and human health. It is estimated that roughly 90% of aircraft 460
emissions, except hydrocarbons and CO (~70%), are produced while cruising at altitude, while the 461
remainder is emitted during landing, take-off, and ground level operations (e.g., FAA, 2005). 462
463
Aircraft emissions have been studied extensively since the late-1960s and initially the interest was 464
mainly driven by their direct and indirect effects on climate and the generation of contrails. For this 465
reason, many early studies focused on emissions at high cruise altitudes (e.g., Reinking, 1968; 466
Kuhn, 1970; Arnold et al., 1992; Fahey et al., 1995a,b; Wahner et al., 1995; Brasseur et al., 1996; 467
20
Schumann, 1996;1997; Anderson et al., 1998a,b). The interest in aviation emissions at airports also 468
dates back many years (e.g., Daley and Naugle, 1979; Naugle and Fox, 1981), but only recently was 469
there an increasing awareness of the effects of aircraft emissions at ground level, or at least within 470
the planetary boundary layer. The recent interest in aircraft emissions at ground-level was initially 471
motivated by public concern, given that more and more often airports are held responsible for air 472
pollution and noise in nearby residential areas (e.g., Mahashabde et al., 2011). Since aircraft 473
emissions are related to engine thrust (e.g., Anderson et al., 2006; Lobo et al., 2007; Whitefield et 474
al., 2008; Timko et al., 2010b; Kinsey et al., 2010; Kinsey et al., 2011) and engines are designed for 475
high performance while cruising at high altitudes, some aircraft operations within airports require 476
that engines operate outside of their optimal regimes, ranging from maximum thrust during take-off 477
to low power settings during operations on the ground. This fact was clearly highlighted during the 478
APEX-1 campaign by Onash et al. (2009), who reported that a CFM56 engine is less efficient at the 479
low thrust levels usually used at airports. This may result in potentially higher emissions on the 480
ground than that during cruising for those pollutants mainly emitted at low power, such as CO and 481
hydrocarbons. 482
483
Early reports of nitrogen oxides, carbon monoxide, hydrocarbons and particulate matter from jet 484
aircraft turbine engines were made by Spicer et al. (1984). Subsequent studies (Spicer et al., 1992; 485
1994) added further information and provided detailed information on the organic component of 486
turbine engine emissions. Following from these pioneering studies, the scientific literature now 487
comprises a large number of studies and most have concluded that aircraft exhausts are responsible 488
for significant emissions of a series of gaseous, semi-volatile and non-volatile species. Non-volatile 489
emissions are produced in the combustor and are made up of refractory material such as soot (e.g., 490
Agrawal et al., 2008; Kinsey, 2009; Dodson et al., 2009; Lee et al., 2010; Presto et al., 2011), which 491
is emitted into the atmosphere as particulate matter even at the high engine exit temperatures, but 492
also contains many organic compounds (e.g., Herndon et al., 2006; Anderson et al., 2006; Webb et 493
21
al., 2008; Wood et al., 2008a; Agrawal et al., 2008; Herndon et al., 2009; Lee et al., 2010; Mazaheri 494
et al., 2011; Presto et al., 2011; Kinsey et al, 2011; Mazaheri et al., 2013). 495
496
Volatile emissions include compounds that exists as vapour at engine exit temperature and pressure 497
(Presto et al., 2011) and are made up of gaseous and vapour-phase pollutants, such as CO2, CO, 498
NOx, SO2, O3 and many organic compounds, including alkanes, alkenes, carbonyls, aromatic 499
compounds and a number of other volatile organic species. The least volatile fraction has been 500
shown to range from 10 to 20% of the total organic emissions (Presto et al., 2011) and its presence 501
is particularly challenging, because it can react in the atmosphere and may undergo condensation in 502
the exhaust plumes leading to aerosol particles or volatile coating of pre-existing particles (Lee et 503
al., 2010; Miracolo et al., 2011). This latter component is named volatile PM, however there is 504
today a considerable controversy about its definition (Kinsey, 2009). Such particles may act as 505
condensation nuclei or may interact with soot to form condensation nuclei and thus may have 506
effects on cloud formation, precipitation and climate. In addition, additional compounds may 507
subsequently originate from the aging of exhausts following a chain of oxidation with atmospheric 508
oxidants and gases. 509
510
The relative amount of exhaust emissions depends upon combustor temperature and pressure, fuel 511
to air ratio and the extent to which fuel is atomised and mixed with inlet air (Anderson et al., 2006). 512
It is well recognised that the amounts of many pollutants may vary considerably with the engine 513
technology, model and especially with the thrust. For example Slemr et al. (1998, 2001) and Spicer 514
et al. (1992; 1994) reported that hydrocarbon emissions can be dependent upon engine type, use and 515
maintenance history as well as fuel composition. 516
517 518 519
22
4.1 Geographical and Vertical Distributions of Flights
520
Based upon the main air traffic routes, a series of studies have discussed the geographical and 521
vertical distributions of fuel consumption, which can be used to further assess the relative 522
emissions from aviation (e.g., Kim et al., 2007; Wilkerson et al., 2010; DeWitt et al., 2011; Olsen et 523
al., 2013; Simone et al., 2013). Due to the geographical distribution of civil aviation in the 2000s, 524
the global fuel burn by domestic flights is dominated by the North America and Caribbean regions, 525
while fuel consumed by international flights is dominated by Asia, North America and the 526
Caribbean, and Western Europe and North Atlantic (Kim et al., 2007). Using the Aviation 527
Emissions Inventory Code (AEIC, Stettler et al., 2011) Simone et al. (2013) estimated the fuel burn 528
by country of origin/destination in 2005 and reported that the USA was the most important (59.1 529
Tg), followed by Japan (9.7 Tg), UK (9.4 Tg), China (8.5 Tg, excluding Hong Kong), Germany (6.7 530
Tg) and France (5.4 Tg). A map showing the column sum of global fuel burn from scheduled civil 531
aviation in 2005 is provided in Figure 4a. Other studies have been carried out to estimate annual 532
fuel consumption and pollutant emissions more locally: for example Fan et al. (2012) assessed the 533
fuel consumption and emissions for each airline in China in 2010. 534
535
Kim et al. (2007) and Lee et al. (2007) used the System for assessing Aviation’s Global Emissions 536
(SAGE) model to estimate the vertical profiles of commercial aviation and pointed out that the 537
highest fuel burn and emissions are between 9 and 12 km, which corresponds to typical cruise 538
altitude. Generally, most studies also reported that about 5−7% of total jet fuel is consumed within 539
1 km above ground level during airport operations (Kim et al., 2007; Simone et al., 2013), and 540
Olsen et al. (2013) reported a comparison of the annual global vertical distribution of fuel burn by 541
the commercial aviation deriving from different estimates (Figure 4b). Although most studies have 542
concluded that 5-10% of fuel is burned below 1000 m, aircraft operations within airports may 543
further increase fuel consumption due to the acceleration and deceleration of the engines following 544
23
airport congestion (Anderson et al., 2005; Nikoleris et al., 2011) or due the unaccounted use of fuel 545
for APUs (Ratliff et al., 2009). 546
547
4.2 Emissions at Ground
548
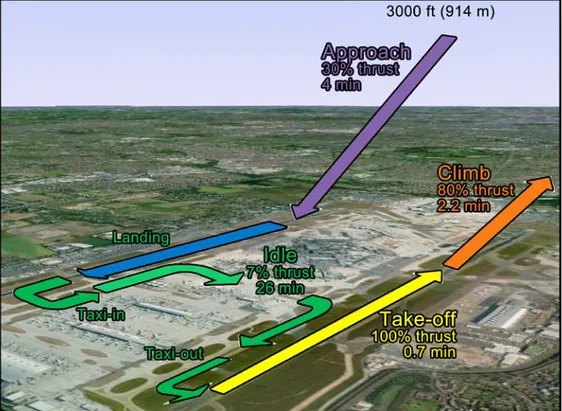
4.2.1 Landing and take-off (LTO) cycles
549
The emissions of all aircraft engine must comply with applicable standards promulgated by the 550
International Civil Aviation Organization (ICAO, 2008) and measured upon the landing and take-551
off (LTO) cycles. A LTO cycle refers to all the operations the aircraft carry out below 3000 ft above 552
field elevation (equivalent to 914 m) over a specific range of certifiable operating conditions and 553
includes four stages in terms of both engine thrust settings (expressed as a percentage of maximum 554
rated thrust, or F00) and typical time in each specific mode of operation (time-in-mode, TIM). The 555
3000 ft height roughly corresponds to the atmospheric mixing height, i.e. the lower part of the 556
troposphere within which pollutants emitted at ground-level mix rapidly (e.g., Schäfer et al., 2006). 557
The LTO cycles are designed for aircraft engines manufactured after 1985 whose rated output is 558
greater than 26.7 kN and aim to guarantee they not exceed certain regulatory environmental limits 559
for a series of pollutants, namely unburned total hydrocarbons, carbon monoxide, nitrogen oxides 560
and smoke number (SN). This latter parameter is roughly representative of the amount of soot an 561
engine generates (e.g., Wayson et al., 2009; Stettler et al., 2013a,b). In the first LTO phase the 562
aircraft descends from cruising altitude toward the runway and lands at the airport. This phase is 563
named “approach” and is estimated as lasting for 4 min with engines at 30% F00. After landing, the 564
aircraft enters in the “idle” phase which include all the ground-based operations: it proceeds at a 565
low speed to the gate (taxi-in), remains on stand-by for the loading and unloading operations and 566
again prepares for take-off proceeding towards the runway (taxi-out). Idle lasts 26 min and the 567
engines are required to be at 7% F00. The subsequent operating modes include the “take-off” with 568
engines stressed to the full thrust (100% F00) for 0.7 min, and the “climb” (85% F00 for 2.2 min) up 569
to 3000 ft height. A standardised LTO cycle is shown in Figure 5. 570
24
4.2.2 Engine ground running procedures
571
In addition to the operations falling within LTO cycles, the ground running procedures (GRPs) may 572
lead to further emission loads from aircraft engines at airports. GRPs refer to the operation of some 573
or all engines carried out on the ground for the purpose of functionally checking the operation of 574
either engines or aircraft systems. GRPs are therefore an essential part of the operation of any 575
airliner prior to the release to service of an aircraft from maintenance. The main reasons for running 576
the engines on the ground are (Buttress and Morris, 2005): (i) check starts after minor maintenance 577
actions; (ii) runs at no more than ground idle to ensure that the engine operates correctly after 578
maintenance action, these include thrust reverser function checks, etc.; (iii) runs at powers greater 579
than ground idle to check the correct operation of certain valves, leak checks, etc. To date, only few 580
studies take into account the emissions from GRPs, but their importance for the atmospheric loads 581
of some pollutants cannot be neglected. For example, Buttress and Morris (2005) showed that GRPs 582
at London Heathrow airport release approximately 15.6 Mg y‒1 NOx. Mazaheri et al. (2011) 583
investigated the annual emissions of particle number, particle mass and NOx throughout the LTO 584
cycles and GRP at the Brisbane Airport and showed that annual emissions account for less than 3%. 585
Despite the evidence that GRPs may have a substantial impact on local air quality at airports, up to 586
now they have received only minor consideration. GRPs are not yet regulated internationally and 587
must comply only with local regulatory requirements imposing limitations on the locations, times 588
and engine thrust levels employed during ground running which may differ from one airport to 589
another. 590
591
4.2.3 Limitations in the use of standard LTO cycles
592
The use of standard LTO cycles as a surrogate for typical aircraft operations close to the ground 593
represents an approximation and is not always representative of operations at airports. One 594
limitation is that the ICAO engine emissions standards are applied through national and multi-595
national certification processes to turbojet and turbofan engines, but not turboprop, turboshaft and 596
25
piston engines (ICAO, 2011). This limitation may be negligible at large airports, where most traffic 597
is due to common airliners equipped with TF engines, but may represent a major approximation for 598
small and medium-sized airports where small, private, business and regional aircraft account for a 599
large portion of flight traffic. In addition, despite LTO cycles having been designed to model 600
optimally all the operational procedures of aircraft in the vicinity of airports, sometimes they are not 601
well adapted to engine settings and actual TIM, which depend upon pilot’ technique, fleets, airport 602
layouts and flight traffic. In fact, default ICAO TIM are not representative of real operations and are 603
for certification purposes. Consequently,although some inventories account for the deviations from 604
the ICAO default TIMs and thrust settings, some deviations from the standardised LTO procedures 605
may occur during actual LTO cycles. This inevitably leads to some differences between actual 606
airport operations and emission inventories used in modelling studies. The main 607
deviations/limitations are: 608
609
• reduced thrust during take-off. This practice is often carried out for performance and cost-610
efficiency reasons (ICAO, 2011) and has been widely observed on operational runways 611
(Carslaw et al., 2008; Herndon et al., 2008); it may depend on aircraft weight and weather 612
factors (Morris, 2002) and is often largely unknown (Carslaw et al., 2008). Since the 613
emissions of some pollutants increase monotonically with the thrust (e.g., NOx), this could 614
lead to an overestimation of emissions from airports; 615
• lower thrust at idle/taxi mode. It has been reported that most aircraft use a thrust of 3%‒4% 616
F00 instead of 7% (Morris, 2005a,b; Nikoleris et al., 2011 and reference therein) during idle 617
operations. Since most pollutants emitted in exhaust plumes are strongly increased at 618
decreased power settings (CO and generally all hydrocarbons), this may lead to 619
underestimation of emissions at airports. In this context, Wood et al. (2008b) suggested that 620
the thrust used in taxi operations can be split in two modes, i.e. ‘ground idle’ carried out at 621
26
4% F00 and ‘taxiway acceleration’ with thrust settings up to 17%. Moreover, higher thrust 622
levels are sometimes used for turning; 623
• acceleration and deceleration of the engines or stop-and-go situations. This is mainly the 624
result of congestion on taxiways and is known to be responsible for significant increases in 625
fuel consumption and increased emissions (Anderson et al., 2005; Nikoleris et al., 2011). For 626
example Morris (2005a) reported that instant accelerations up to 10% F00 and lasting ~10 s 627
may occur at London Heathrow airport when aircraft cross an active runway or make a sharp 628
turn. Due to this, the entire taxiway phase of operation using a uniform engine thrust level 629
have been also recognised as problematic for emission inventory estimates because of the 630
nonlinear emission rate of many compounds at low power (Herndon et al., 2009); 631
• use of a reverse thrust phase during landing. Reverse thrust is applied to assist mechanical 632
brakes in slowing down the landing aircraft and is not generally required for normal 633
operations onto a dry runway (ICAO, 2011). However, it generally occurs with idle thrust 634
power as a prudent safety precaution, and under some circumstances it may also occur at 635
power higher than 10% F00 (Morris and Easey, 2005; Stettler et al., 2011). Generally, reverse 636
thrust is applied for 10‒20 s (Fanning et al., 2007; Stettler et al., 2011), but may vary as a 637
function of the landing velocity, runway length and aircraft weight; 638
• the evident differences between the standard TIM, which is used as part of the ICAO engine 639
emissions certification processes, and the actual TIM used at airports (e.g., Unique, 2004; 640
Watterson et al., 2004; Patterson et al., 2009; Stettler et al., 2011; Mazaheri et al., 2011; 641
Khadilkar and Balakrishnan, 2012). For example, Patterson et al. (2009) and Khadilkar and 642
Balakrishnan (2012) observed that total fuel burn during departures and arrivals at airports is 643
generally overestimated by the ICAO method with respect to emissions computed from real-644
time aircraft flight data. Other studies have also reported measured TIM at airports: Unique 645
(2004) reported TIM in Zurich airport and detected differences in all the LTO phases: idle (-646
43%), approach (+10%), climb (-77%) and take-off (+129%) which have been estimated to 647
27
have a strong impact on the calculation of emissions, resulting in reduced fuel flow (‒38%) 648
and NOxemissions (‒31%); 649
• the composition of the fleet that serves an airport and the weight of the aircraft. Since the 650
ICAO certifies the engines and not the full aircraft, some airplane characteristics, mainly the 651
aircraft weight, may have a key role in determining the emissions. Furthermore, in addition to 652
the mass of the aircraft, its load of fuel, passengers and goods affect the overall weight: it is 653
reported that passengers, crew and luggage usually add 6-15% to aircraft weight (Hu et al., 654
2009). Most of those factors vary from flight to flight, are largely unknown and may have 655
direct implications for reduced thrust during take-off. In fact, it should be inferred that the 656
increase of the aircraft weight has direct effects upon the thrust levels needed for carrying out 657
usual LTO operations. For example, Carslaw et al. (2008) studied the NOx emissions at 658
London Heathrow and found evidence for statistically significant differences in the emissions 659
from the same engine type used on the same aircraft frame. Among other factors, they 660
speculated that the aircraft weight could be a cause. In a study conducted in eight major busy 661
airports, Turgut and Rosen (2010) detected significant differences in the emissions of some 662
pollutants and concluded that every airport has LTO cycles carried out by aircraft with 663
different characteristics and, consequently, emissions. Another recent study by Turgut et al. 664
(2013) showed a good relationship between aircraft mass and the NOx emission during take-665
off and climb, which supports the concept of an explicit relationship between the aircraft 666
weight and emissions. There is a general lack of knowledge about the relationships between 667
aircraft mass and emissions, although some recent studies have indicated that heavier aircraft 668
also emit more particles (Zhu et al., 2011). 669
670
Recent studies assessing airport emissions have proposed and used LTO cycles which are much 671
more complex than those standardised by the ICAO. For example, in a study of the air quality and 672
public health impacts of UK airports, Stettler et al. (2011) used specific TIMs derived from 673
28
Watterson et al. (2004) and Underwood et al. (2004) composed of 12 phases, namely approach, 674
landing roll, reverse thrust, taxi-in, taxiway acceleration, APU, taxi-out, taxiway acceleration, hold, 675
take-off, initial climb and climb-out. Proposed TIMs were developed by analysing the common 676
procedures of an A320 aircraft at London Heathrow, but may vary by aircraft size category. Other 677
studies (e.g., Ratliff et al., 2009), used models, such as the Emissions and Dispersion Modelling 678
System (EDMS), which also requires jet fuel quality data, main engine and APU specifications, 679
aircraft weight and ground operating time to generate more reliable emission estimates. 680
681
4.2.4 The emission indices (EIs)
682
The emissions during standardised LTO cycles are then reported as emission indices (EIs) 683
expressed as mass of pollutant emitted per unit mass of fuel burned. Fuel-based emission indices for 684
the compound X are calculated according to: 685
EI(X)=Fc∙(MX/MCO2)∙(ΔX/ΔCO2) 686
where Fc represents the stoichiometric calculation of CO2 produced per kilogram of fuel consumed 687
(with units g CO2 kg Fuel‒1) assuming complete combustion and given a particular hydrogen to 688
carbon ratio (e.g., Herndon et al., 2004). MX and MCO2 are the molecular weights of the compound 689
X and CO2, respectively, and ΔX and ΔCO2 are the enhancements of compound X and CO2 within 690
the plume, respectively (e.g., Anderson et al., 2006). Unless specified differently, by convention 691
EI(NOx) is defined in terms of NO2 and therefore the mass of NOx emissions is: 692
NOx as NO2 = NO2 emissions + NO emissions · M(NO2)/M(NO) 693
where M(NO2) and M(NO) are the molecular weights of NO2 and NO, respectively. In a similar 694
way it should be specified that EI(hydrocarbons) is often referenced to methane (Wahner et al., 695
1995). ICAO maintains a databank of engine certification data for commercial aviation reporting 696
EIs for the four selected pollutants (EASA, 2013). Emissions of a pollutant X from an engine can 697
be therefore calculated using three parameters: the first two are provided by the ICAO databank and 698
are the main engine EI(X) and the engine fuel flow, i.e., the burned fuel at a defined power setting 699
29
(expressed as kg s‒1); the third parameter is the time-in-mode (TIM), i.e. the time the engines spend 700
at an identified power setting (ICAO, 2011): 701
Emission(X)=EI(X)∙TIM∙fuel flow 702
Analogous to the EI for the emitted pollutant, emission indices for the number of particles have 703
been commonly reported in the literature. For convention, they are here reported as EI(#). 704
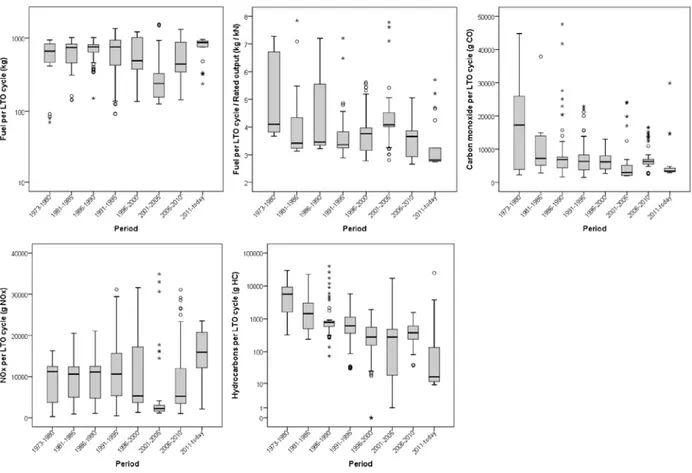
Using ICAO EIs and standardised LTO TIMs, Figure 6, 7 and 8 report a reprocessing of the data 705
included in the ICAO databank. In particular, Figure 6 shows the total burned fuel and the mass of 706
emitted pollutants (CO, NOx and hydrocarbons) during a complete LTO cycle, i.e. the sum of 707
standardised time in each mode per fuel flow per average EI at each of the four power settings 708
(ICAO, 2013); data are organised to show the changes in the ICAO emission data for in-use engines 709
certified from 1973 to present (five year steps). Since different engines have different 710
characteristics, including the thrust force, Figure 6 also shows the ratios between the fuel burned 711
during complete LTO cycles and the engine maximum rated thrust (in kN) to normalise the fuel 712
consumption of the engine power. Figure 7 summarises the ICAO EI data (all in-use engines 713
certified from 1976 to today) per each LTO stage, expressed as g pollutant emitted per kg fuel 714
burned. Figure 8 shows the total burned fuel and emissions per each LTO phase, i.e. the product of 715
EIs per standardised time in each phase per fuel flow. The reprocessing of ICAO data does not take 716
into account the number of units produced for each engine model, but only the different models 717
produced and still in service in April 2013 (and included in the ICAO databank), regardless of 718
manufacturer, type and technology. Moreover, data refer to single engines, and generally 719
conventional aircraft are equipped with 1 to 4 engines. Therefore the sole purpose of the 720
reprocessing of ICAO data is to report qualitatively the trends in fuel consumption and emissions 721
for in-use TF engines. 722
723
Currently, the scientific literature includes several studies aiming to give EIs for comparison with 724
reported ICAO databank certification data and for many other components, including particulate 725
30
matter, elements, ions and speciated hydrocarbons. However, such data are often sparse and results 726
poorly comparable. Most studies were carried out using single or a few engine types, under certain 727
environmental conditions, without a standardised thrust and/or often using different measurement 728
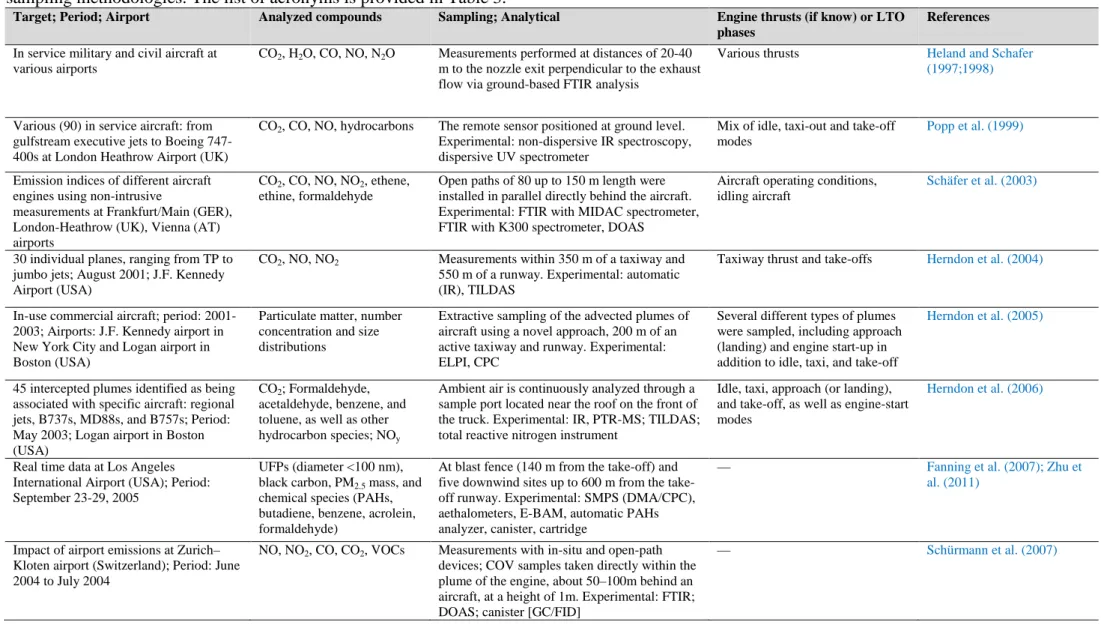
techniques and instrumental set-up. Table 3 lists the most recent studies available in the literature 729
reporting EIs for various engines in aircraft and helicopters. The table also shows some information 730
(if available) about tested aircraft, engine models, selected thrust, type of fuel, sampling 731
methodologies and analytical techniques. Table 4 provides a list of recent studies which measured 732
EIs during real aircraft operations at airports. Most of the data in such studies (both engine tests and 733
real world operations) are summarised in the Supplemental Information Tables SI1, SI2, SI3 and 734
SI4, which provide detailed information about the EIs for many gaseous pollutants, speciated 735
hydrocarbons, particle number, particle mass (including soot) and species/ions in particulate matter, 736
respectively. Note that specific thrust levels provided in the tables are derived from the literature 737
and are categorised in five groups, named idle, approach, cruise, climb and take-off, on the basis of 738
the engine type. The thrust, expressed as F00, is always provided along with the EIs. Additional 739
tested thrust levels (if available) are also reported, along with fuel and analytical methodologies. 740
741
4.2.5 Considerations about the EIs
742
As indicated by the large number of studies in Tables 3 and 4, most of the literature provides results 743
through the calculation of EIs. When applied to the specific testing studies on engines or airplanes, 744
such methodology has the advantage of giving data easily comparable with EIs reported in the 745
ICAO databank. This may allow a better evaluation of the differences amongst tested engines and 746
technologies or, in case of the use of innovative analytical devices, allows a check the agreement 747
between data obtained and certified values. In contrast, expressing the results as EIs from studies 748
conducted during real-world operations at airports has both advantages and limitations. An 749
advantage of the specific studies may be comparison of the results with the ICAO data to detect 750
changes due to evolution of the exhaust plume, e.g. aging and gas-to-particle partitioning. Carslaw 751