ScienceDirect
Available online at Available online at www.sciencedirect.comwww.sciencedirect.com
ScienceDirect
Structural Integrity Procedia 00 (2016) 000–000
www.elsevier.com/locate/procedia
2452-3216 © 2016 The Authors. Published by Elsevier B.V.
Peer-review under responsibility of the Scientific Committee of PCF 2016.
XV Portuguese Conference on Fracture, PCF 2016, 10-12 February 2016, Paço de Arcos, Portugal
Thermo-mechanical modeling of a high pressure turbine blade of an
airplane gas turbine engine
P. Brandão
a, V. Infante
b, A.M. Deus
c*
aDepartment of Mechanical Engineering, Instituto Superior Técnico, Universidade de Lisboa, Av. Rovisco Pais, 1, 1049-001 Lisboa,
Portugal
bIDMEC, Department of Mechanical Engineering, Instituto Superior Técnico, Universidade de Lisboa, Av. Rovisco Pais, 1, 1049-001 Lisboa,
Portugal
cCeFEMA, Department of Mechanical Engineering, Instituto Superior Técnico, Universidade de Lisboa, Av. Rovisco Pais, 1, 1049-001 Lisboa,
Portugal
Abstract
During their operation, modern aircraft engine components are subjected to increasingly demanding operating conditions, especially the high pressure turbine (HPT) blades. Such conditions cause these parts to undergo different types of time-dependent degradation, one of which is creep. A model using the finite element method (FEM) was developed, in order to be able to predict the creep behaviour of HPT blades. Flight data records (FDR) for a specific aircraft, provided by a commercial aviation company, were used to obtain thermal and mechanical data for three different flight cycles. In order to create the 3D model needed for the FEM analysis, a HPT blade scrap was scanned, and its chemical composition and material properties were obtained. The data that was gathered was fed into the FEM model and different simulations were run, first with a simplified 3D rectangular block shape, in order to better establish the model, and then with the real 3D mesh obtained from the blade scrap. The overall expected behaviour in terms of displacement was observed, in particular at the trailing edge of the blade. Therefore such a model can be useful in the goal of predicting turbine blade life, given a set of FDR data.
© 2016 The Authors. Published by Elsevier B.V.
Peer-review under responsibility of the Scientific Committee of PCF 2016.
Keywords: High Pressure Turbine Blade; Creep; Finite Element Method; 3D Model; Simulation.
* Corresponding author. Tel.: +351 218419991.
E-mail address: [email protected]
Procedia Structural Integrity 7 (2017) 521–529
2452-3216 Copyright 2017 The Authors. Published by Elsevier B.V.
Peer-review under responsibility of the Scientific Committee of the 3rd International Symposium on Fatigue Design and Material Defects. 10.1016/j.prostr.2017.11.121
10.1016/j.prostr.2017.11.121 2452-3216
Copyright © 2017 The Authors. Published by Elsevier B.V.
Peer-review under responsibility of the Scientific Committee of the 3rd International Symposium on Fatigue Design and Material Defects.
ScienceDirect
Structural Integrity Procedia 00 (2017) 000–000
www.elsevier.com/locate/procedia
2452-3216 © 2017 The Authors. Published by Elsevier B.V.
Peer-review under responsibility of the Scientific Committee of the 3rd International Symposium on Fatigue Design and Material Defects.
3rd International Symposium on Fatigue Design and Material Defects, FDMD 2017, 19-22
September 2017, Lecco, Italy
Estimation of Fatigue Limit of a A356-T6 Automotive Wheel in
Presence of Defects
M. Tebaldini
a, b*, C. Petrogalli
b, G. Donzella
b, G. M. La Vecchia
baCromodora Wheels S.p.A., via Montichiari 20, Ghedi (BS), Italy
bDepartement of Mechanical and Industrial Engineering, University of Brescia, via Branze 38, 25123, Brescia (BS), Italy
Abstract
The automotive wheel is a critical safety component in the vehicle and, for such a reason, it has also to meet strict requirements about technological properties. Aluminum wheels are produced by low pressure die casting technique and the casting defects related to the process have to be properly considered having a high effect in decreasing both static and cyclic resistance of the component. Effectively, casting defects as porosities influence the fatigue crack initiation and strongly affect the fatigue life too. One of the most common problem in the real component is the mismatch between the experimental and literature data about fatigue life. In fact, many scientific researches are usually carried out on small samples produced in a controlled condition and therefore it is difficult to direct transfer the laboratory results to a real cast component with a well-defined shape and different thicknesses. In the present study, an aluminum alloy A356-T6 wheel was analyzed in order to assess its fatigue performance, taking into account the casting defects.
The fatigue limit of the component was calculated by rotating bending fatigue tests executed on the whole wheels. Microfractographic analyses on the broken wheels were carried out on the fracture surfaces using a Scanning Electron Microscope in order to identify the crack initiation zone: it was recognized that the crack always started from shrinkage porosities. The statistical population of these defects was therefore investigated on samples taken from the wheel in crack nucleation positions of the spoke and the maximum expected defect size on the component was estimated by the statistics of extreme values. The experimental fatigue limit was finally compared with the theoretical value predicted with the Murakami’s method.
© 2017 The Authors. Published by Elsevier B.V.
* Corresponding author.
E-mail address: [email protected]
ScienceDirect
Structural Integrity Procedia 00 (2017) 000–000
www.elsevier.com/locate/procedia
2452-3216 © 2017 The Authors. Published by Elsevier B.V.
Peer-review under responsibility of the Scientific Committee of the 3rd International Symposium on Fatigue Design and Material Defects.
3rd International Symposium on Fatigue Design and Material Defects, FDMD 2017, 19-22
September 2017, Lecco, Italy
Estimation of Fatigue Limit of a A356-T6 Automotive Wheel in
Presence of Defects
M. Tebaldini
a, b*, C. Petrogalli
b, G. Donzella
b, G. M. La Vecchia
baCromodora Wheels S.p.A., via Montichiari 20, Ghedi (BS), Italy
bDepartement of Mechanical and Industrial Engineering, University of Brescia, via Branze 38, 25123, Brescia (BS), Italy
Abstract
The automotive wheel is a critical safety component in the vehicle and, for such a reason, it has also to meet strict requirements about technological properties. Aluminum wheels are produced by low pressure die casting technique and the casting defects related to the process have to be properly considered having a high effect in decreasing both static and cyclic resistance of the component. Effectively, casting defects as porosities influence the fatigue crack initiation and strongly affect the fatigue life too. One of the most common problem in the real component is the mismatch between the experimental and literature data about fatigue life. In fact, many scientific researches are usually carried out on small samples produced in a controlled condition and therefore it is difficult to direct transfer the laboratory results to a real cast component with a well-defined shape and different thicknesses. In the present study, an aluminum alloy A356-T6 wheel was analyzed in order to assess its fatigue performance, taking into account the casting defects.
The fatigue limit of the component was calculated by rotating bending fatigue tests executed on the whole wheels. Microfractographic analyses on the broken wheels were carried out on the fracture surfaces using a Scanning Electron Microscope in order to identify the crack initiation zone: it was recognized that the crack always started from shrinkage porosities. The statistical population of these defects was therefore investigated on samples taken from the wheel in crack nucleation positions of the spoke and the maximum expected defect size on the component was estimated by the statistics of extreme values. The experimental fatigue limit was finally compared with the theoretical value predicted with the Murakami’s method.
© 2017 The Authors. Published by Elsevier B.V.
* Corresponding author.
Peer-review under responsibility of the Scientific Committee of the 3rd International Symposium on Fatigue Design and Material Defects.
Keywords: Aluminum wheel, Fatigue life, Casting defects
1. Introduction
The wheel represents an engineering component playing an important role for the safety and comfort of a vehicle. It represents the fundamental unsprung rotating component and, for this reason, lightweight wheel is required both to reduce the fuel consumption (Li P. et al, 2007) and the emissions, and to improve the car performance. As a safety part, very strictly properties in terms of tensile, impact and fatigue resistance are therefore required for the wheel. At the same time, the aesthetic appearance is very important because the wheel is also a design element. In order to certify technological performances (e.g. impact resistance and fatigue endurance) peculiar tests are carried out on the real components with the aim of simulating different kinds of applied stress to the wheel during its standard use.
A356 alloy is the most common alloy used for wheel manufacturing due to its good castability, high corrosion resistance, good mechanical and fatigue resistance (Dwivedi S. P. et al, 2014) in order to fulfill the costumers’ requirements.
The typical cycle process to produce a wheel is characterized by the sequence of low pressure die casting (LPDC), T6 heat treatment, machining, and painting. Each step of the manufacturing process can heavily influences the wheel’s in-service performance. In fact, during the solidification the initial microstructure of the wheel in terms of the Secondary Dendrite Arm Spacing (SDAS), size and distribution of the casting defects is defined (Li P. et al, 2007). Furthermore, the T6 heat treatment is responsible of the precipitation kinetics and therefore it is strongly related with the final mechanical properties of the material. In fact T6 heat treatment, which is the sequence of solution treatment, quenching and artificial aging, is involving diffusion phenomena due to the quite high holding temperatures and fast cooling during the quenching. For such a reason the heat treatment, along with the design of the wheel, is considered responsible for the residual stress distribution partially relieved during the artificial aging and redistributed by the machining. LPDC process is widely used to produce this engineering cast because of the advantages in productivity, mechanical performance and good surface finishing. It is important to consider that, using a traditional LPDC casting, defects like shrinkage or gas porosities, and oxide inclusions are inevitable in an industrial cast process.
Many published works on casting fatigue behavior point out the influence of the casting defects as the origin of the failure (Wang Q. G. et al 2001, Roy M.J. et al 2011, Nicoletto G. et al 2012) whereas other microstructural characteristics like SDAS, size and morphology of secondary eutectic phase are considered have smaller effect (Roy M.J. et al 2011).
The fatigue life estimation of defective materials has already been studied (Murakami Y. 1999, Wang Q. G. et al 2001, Roy M. J. et al 2011, Nicoletto G. et al 2012, Nadot Y. 2015, Le V. 2016) using different approaches: the Linear Elastic Fracture Mechanics (LEFM) used only in presence of long cracks (homogeneous stress distribution and local plasticity negligible); the Murakami’s relationship applied to estimate the fatigue limit considering the √area parameter as the defect size and the hardness measurements to obtain a local plasticity assessment; the Critical Distance Method (CDM) and the Gradient Criterion (GR) that represent advanced computational and analytical procedures able to determine the effective stress distribution around a defect.
However, in the published papers considering the fatigue behavior of cast parts the Authors did not carried out the fatigue testing on the real component, but, on the contrary, implemented fatigue test on samples cut from the casting dictating “simple” stress configuration e. g. tension or torsion.
Starting from these considerations the present research was focused on the fatigue behavior of an A356-T6 automotive car wheel in order to investigate the fatigue life of the real component related to the size and position of casting defects through bending fatigue test. The main goals of the activity were the estimation of the maximum defect size in order to evaluate the theoretical fatigue limit, the measurement of the fatigue endurance limit, and the investigation, from the microstructural point of view, of the fatigue crack initiation point.
The wheel was tested using a multiaxial stress condition, simulating the standard loading state. The use of the whole wheel allows taking into account the production process in terms of microstructure, casting defects, mechanical
properties and residual stress distribution in different stressed area of the component. The final goal of the research work is therefore to outline a procedure useful to analyze the cast component in terms of fatigue endurance considering the defect sensitivity as a parameter directly transferable to the design step of the wheel to improve its quality.
2. Experimental investigation
2.1. Material and methods
The A356-T6 wheels used in this research were sourced by Cromodora Wheels S.p.A. The nominal chemical composition (wt. %) of the tested alloy is given in Table 1.
Table 1: Chemical composition of the tested Sr-modified A356 alloy.
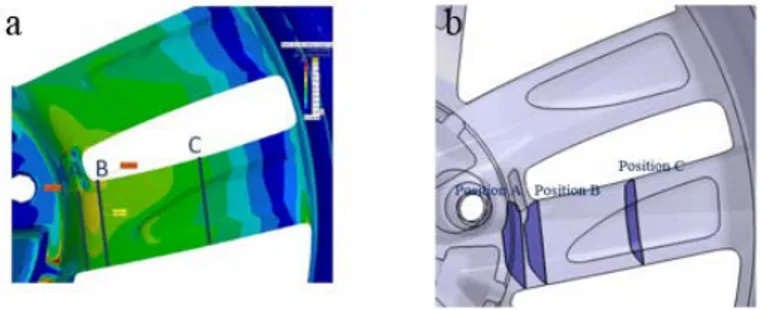
Fig. 1 shows the results of a Finite Element Analysis (FEA) of the wheel simulating the bending fatigue test and the three positions of the sections A, B, C defined in the back of the spoke and chosen for the mechanical and microstructural evaluations. The most stressed areas are the spoke-hub junction, close to the stress diverter that represents section A and the section in correspondence of the edge radius (position B). The third area (position C) is in the middle of the spoke where, for this particular wheel design, the stress is lower. Therefore, only in presence of quite large defects position C can be considered critical.
Fig. 1. (a) FEA output (Von Mises stress map), with the position of the sections A, B and C; (b) wheel design with the profile of the sections A, B and C.
For the experimental activities, a batch of this particular wheel design was cast in order to have a large number of wheels with the same chemical composition and produced in the same process condition. Statistical analyses of porosity population for the positions A, B and C were performed by extracting specimens from wheels of this batch in the sections (Fig. 1b) above defined and the estimation of the fatigue endurance limit was made by means of bending fatigue tests executed on the whole wheels.
2.2. Statistical analysis of porosities
Statistical analysis of porosities of the cast sections were analysed with the purpose of estimating the maximum defect size in three different area of the wheel’s spoke. Standard metallographic techniques, according to the ASTM E 3-11 standard (2003) were used for the preparation of the samples. Quantitative metallographic evaluations were performed on the polish sections by an optical microscope using an image analysis software package (Axiovision Zeiss software) which allow to calculate the geometrical parameters e.g. Maximum Feret Diameter or the √area. The magnification was chosen with the aim of being able to distinguish the different kinds of casting defects (e.g. shrinkage porosities, gas porosities and oxide films) and include whole porosity cluster in each micrograph. For each sample one hundred micrographs were made in random direction covering an inspection area, S0 of 500 mm2 according to ASTM E 2283-03 standard and the maximum Feret diameter was measured. The analysis of the casting defects in the wheel outlined
Alloy Si Mg Sr Ti Fe Cu, Zn, Mn Al
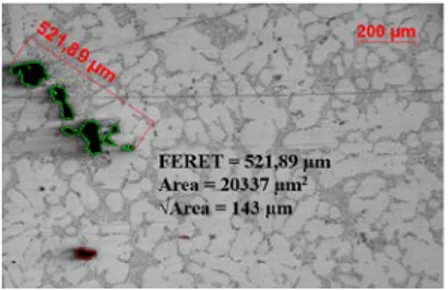
that the most widespread defect is shrinkage porosity. Shrinkage porosity consists in interdendritic cavities with branches that can show complexity forms in a metallographic section. For this reason in all micrograph the Feret Diameter was considerably larger than the corresponding √area value. The study showed that the estimated critical pore size according to the Feret Diameter has a better correlation with the experimental long life fatigue strength than √area parameter.
Fig. 2: metallographic analysis. Comparison between Feret diameter and √area for the same shrinkage porosity cluster.
Gumbel’s extreme value distribution was used to obtain a statistical description of the largest pore size measured by metallographic 2D inspection as defined in Standard procedure (ASTM E 2283-03). The experimental values obtained considering the sections A, B and C respectively, were analyzed using the maximum likelihood method together with approximate 95% confidence intervals.
2.3. Fatigue tests
Fatigue tests of the wheel were performed by subjecting them to a rotating moment to simulate the process of turning corner. All fatigue tests were carried out in load controlled mode and fully reverse load (R=-1) using a cornering fatigue test machine following SAEJ 328 standard. The wheel is fixedly constrained on the frame, while an eccentric element linked to a rotary support causes a bending moment depending on the rotating speed. Taking into account the Finite Elements Analysis of the wheel, a relationship between bending moment and applied stress on the most stressed region was determined. The stress levels were applied to the 15 wheels according to the stair-case method (UNI 3964 standard) in order to obtain the endurance limit. The gap d between each level was chosen equal to 5 MPa. The required duration was set to 500,000 cycles; this value was chosen by considering the most restrictive specification of the costumers. The failure criterion was the appearance of a macro cracks, visible by eye. For this aim, the casting wheels were prepared in advance by applying in their critical zones a coating based on a mixture of zinc oxide and glycerol, that is useful to highlight the crack presence. The mean value of the endurance limit (50% of probability of failure) and the corresponding standard deviation were then determined according to the test method.
Microfractographics were performed on the fracture surface of all wheels failed before the required target of 500,000 cycles, using a scanning electron microscope in order to investigate the fatigue crack nucleation points.
3. Results
3.1. Statistical analysis of porosities
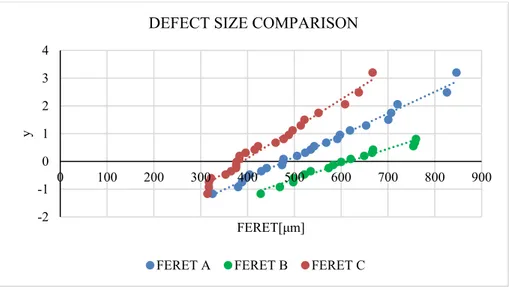
Fig. 3 shows the population of the defects, with the corresponding interpolation distribution for the sections A, B and C, well described by the double exponential Gumbel’s law (1958). The results are summarized in Table 2.
The period of return (T=A⁄A0) was considered. Where A0 is the area of the metallographic investigation, whereas regarding the quantity A, different proposals have been adopted in the past, Beretta et al. (1999, 2001). In a general case of non-uniform stress distribution, the basic principle is to consider only the most stressed area of the component, where fatigue cracks can initiate. This most stressed area has been often defined as that subjected to level of stresses between the 90% and 100% of the maximum stress evaluated in the component, Beretta and Donzella et al. (2013, 2011). Nevertheless, if this area is too small with respect to the area of control A0, some authors suggested considering
wider regions of the specimen where the stress is lower than 0.9 σmax. Following the “most stressed area” method, the identification of A was realized analysing the FEA results performed on the three sections of interest with CATIA solver. The FEA simulation of the bending fatigue test shows that the area where the stress ranges from 0.9σmax to σmax is very limited, so also 0.8σmax and 0.7σmax were considered as lower limits. In Table 2 the largest defect size estimation detected for these considered area is summarized.
Fig. 3: statistical defect population for the position A, B and C. Table 2: Statistical parameters, larger defect size estimation and fatigue limit evaluation.
LIKELIHOOD METHOD Statistical
parameters Largest defect estimation Fatigue limit estimation δML λML 𝑇𝑇𝑇𝑇 𝑦𝑦𝑦𝑦 = 𝑙𝑙𝑙𝑙𝑙𝑙𝑙𝑙 (𝑇𝑇𝑇𝑇) 𝐹𝐹𝐹𝐹𝐹𝐹𝐹𝐹𝐹𝐹𝐹𝐹𝐹𝐹𝐹𝐹𝐹𝐹𝐹𝐹𝑚𝑚𝑚𝑚𝑚𝑚𝑚𝑚𝑚𝑚𝑚𝑚 [µm] (19) σw’ (1) σ(2) w’’ A Sample area (100%) 113.012 482.065 35.76 3.57 886 71 78 80 % 0.1458 -1.92 264 87 95 70 % 1.256 0.228 507 78 85 B Sample area (100%) 173.895 631.036 26.3 3.27 364 68 74 80 % 0.182 -1.703 334 84 92 70 % 0.9164 -0.087 615 76 83 C Sample area (100%) 76.907 392.776 22.08 3.09 630 77 84 90 % 1.428 0.356 420 83 90
3.2. Fatigue limit prediction
Considering the material hardness values (94 HV, 95 HV and 97 HV for the position A, B and C respectively) and the maximum Feret diameter predicted by the extreme value analysis (Table 2) it is possible to predict the fatigue limit of the A356 alloy using equation (1) proposed by Noguchi (2007) and equation (2) presented by Ueno and reported by Tajiri et al. (2014). Murakami modified: Surface defects 𝜎𝜎𝜎𝜎𝑤𝑤𝑤𝑤′= 1.43 (𝐻𝐻𝐻𝐻𝑉𝑉𝑉𝑉+ 120 × 𝐸𝐸𝐸𝐸𝐸𝐸𝐸𝐸𝐴𝐴𝐴𝐴𝐴𝐴𝐴𝐴𝑆𝑆𝑆𝑆𝑆𝑆𝑆𝑆) �√𝑎𝑎𝑎𝑎𝐹𝐹𝐹𝐹𝐹𝐹𝐹𝐹𝑎𝑎𝑎𝑎�1/6 (1) -2 -1 0 1 2 3 4 0 100 200 300 400 500 600 700 800 900 y FERET[μm]
DEFECT SIZE COMPARISON
Ueno: Feret < 1400µm 𝜎𝜎𝜎𝜎𝑤𝑤𝑤𝑤′′=1.43 (𝐻𝐻𝐻𝐻𝑉𝑉𝑉𝑉+ 75)
�√𝑎𝑎𝑎𝑎𝐹𝐹𝐹𝐹𝐹𝐹𝐹𝐹𝑎𝑎𝑎𝑎�1/6 (2)
Table 2 shows the results of the fatigue limit estimation for the position A, B and C. It is comprised between 70 and 90 MPa, according to the results available in literature, relating to the S-N of specimens machined from a A356-T6 spoke wheel, obtained by Ramamurty Raju et al. (2007).
3.3. A356-T6 wheel fatigue behavior: Stair-case method
The fatigue endurance limit is reported in Table 3. Using equations (5) and (6) it is possible to estimate the endurance limit with the 10% and the 90% of probability, which ranges between 99 and 118 MPa.
Table 3: results of fatigue endurance limit.
Eq. (3) 𝜎𝜎𝜎𝜎𝐷𝐷𝐷𝐷 (50%)= 𝜎𝜎𝜎𝜎0+ 𝑑𝑑𝑑𝑑 �𝑁𝑁𝑁𝑁𝐴𝐴𝐴𝐴 ± 0.5� 𝜎𝜎𝜎𝜎𝐷𝐷𝐷𝐷(50%)= 117.5 𝑀𝑀𝑀𝑀𝑀𝑀𝑀𝑀𝑎𝑎𝑎𝑎
Eq. (4) 𝑠𝑠𝑠𝑠 = 1.62 𝑑𝑑𝑑𝑑 �𝑁𝑁𝑁𝑁 𝐵𝐵𝐵𝐵 − 𝐴𝐴𝐴𝐴𝑁𝑁𝑁𝑁2 2+ 0.029� 𝑠𝑠𝑠𝑠 = 14.12 𝑀𝑀𝑀𝑀𝑀𝑀𝑀𝑀𝑎𝑎𝑎𝑎 Eq. (5) 𝜎𝜎𝜎𝜎𝐷𝐷𝐷𝐷(10%)= 𝜎𝜎𝜎𝜎𝐷𝐷𝐷𝐷(50%)+ 1,28 𝑠𝑠𝑠𝑠 𝜎𝜎𝜎𝜎𝐷𝐷𝐷𝐷(10%)= 135.27 𝑀𝑀𝑀𝑀𝑀𝑀𝑀𝑀𝑎𝑎𝑎𝑎
Eq. (6) 𝜎𝜎𝜎𝜎𝐷𝐷𝐷𝐷(90%)= 𝜎𝜎𝜎𝜎𝐷𝐷𝐷𝐷(50%)− 1,28 𝑠𝑠𝑠𝑠 𝜎𝜎𝜎𝜎𝐷𝐷𝐷𝐷(90%)= 99.42 𝑀𝑀𝑀𝑀𝑀𝑀𝑀𝑀𝑎𝑎𝑎𝑎
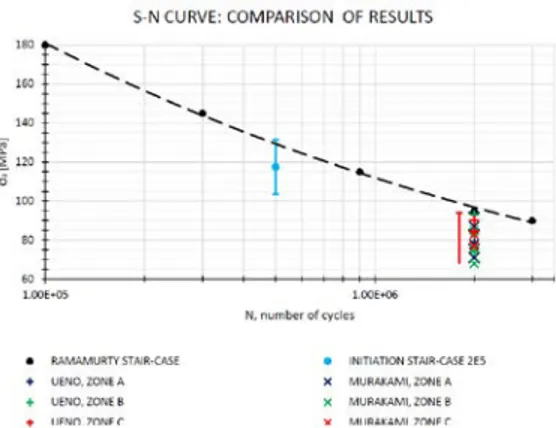
The difference of values obtained by the “short Cracks” approach and the “stair case” method can be justified considering that the stair case refers to the condition of “no crack presence” and to a relatively low number of cycles (500,000). A comparison of the two approaches appears more effective if superimposed, as reported in Fig. 4, to the experimental results the S-N curve of Ramamurty Raju et al. (2007), obtained testing 43 samples machined from
spokes of A356-T6 wheels (comparable applications and same cast alloy and heat treatment with respect to the present research work).
Fig. 4: Comparison with the S-N curve founded in literature, the stair case result referred to initiation and the fatigue threshold foreseen by the fracture mechanics approach.
3.4. Microfractographic observation
Table 4 reports the characteristics of six wheels failed before 500,000 cycles: applied stress, position of the crack and the number of cycles to crack initiation. Five wheels failed in zone A and one wheel failed in zone B.
Table 4: crack position and number of cycles to crack initiation of the wheels that failed before 500,000 cycles.
Wheels failed INITIATION ZONE
N°
σ
a [MPa] A B C 3 120 X 380,000 X 4 115 120,000 X X 11 130 50,000 X X 12 120 360,000 X X 13 125 45,000 X X 14 115 40,000 X XSEM microfractographic analyses allowed to explore the fracture surface of these wheels, and to find the crack initiation point. Fig. 5 represents some significant fracture surfaces useful to understand the scattering about the number of cycles considering the same stress applied condition.
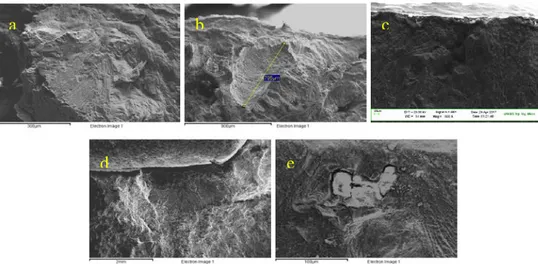
Fig. 5: SEM micrographic of fracture initiation area; (a) wheel n.3 failed in position B; (b) wheel n.12; (c) wheel n. 4; (d) wheel n.14; (e) wheel n. 14 magnification of the initiation area.
Fig. 5a and Fig. 5b represent wheels N° 3 and N° 12 respectively, characterized by an applied stress in the most stressed area around 120 MPa. Wheel 3 failed in B position after 380,000 cycles while wheel N° 12 failed in A after 360,000 cycles, having therefore a comparable performance. The micrographs show the fatigue fractured area, which in both cases presents clear fatigue marks. In the initiation area of wheel N° 3 there were not casting defects, while in the wheel N° 12, the crack initiation is related to a porosity with Feret diameter approximately of 800 µm.
Fig. 5c is related to wheel N° 4 while either Fig. 5d and Fig. 5e correspond to the fractured surface of wheel N° 14. Both wheels were tested with an applied stress of 115 MPa but the endurance were clearly different, in fact in wheel N° 4 the crack nucleation appeared after 120,000 cycles, while in the wheel N°14 after 40,000. SEM analysis for wheel N° 4 highlights that the crack initiation is a porosity located near the surface, the casting defect size being approximately 550 µm. Fig. 5d represents a fractography of the fatigue area and Fig. 5e shows the defect individuated as the crack initiation point. The chemical composition obtained by means of EDS spectra shows the presence of a cluster in form of non-metallic inclusions (alumina oxide) and the dimension of such a defect was around 150 µm.
Comparing the performance of wheels N° 12 and N° 4, both failed in A position; bending fatigue test indicated a higher endurance in wheel N° 12 although the applied stress was higher and the fractography analysis showed a larger porosity than that in the wheel N° 4. The main differences of the casting defects are related to their distance from the free surface and their morphology. Fig. 5c shows a shrinkage porosity with complex shape and very close to the surface (approximately 20 µm) whereas Fig. 5b shows a larger porosity characterized by a rounder shape and 250 µm far from the surface.
a
d
e
4. Conclusions
The main goal of the research activity was a better understanding of the fatigue behavior and the influence of casting defects on the fatigue strength of an A356-T6 wheel, in terms of their type, morphology and distance from the surface. The expected result of the research is to check a procedure useful for industrial application, able to predict the fatigue limit of wheels having different design, based on FEA analyses and the statistical analyses of defects.
For this aim, a statistical analysis of porosity population was performed in the most critical regions of the wheel and the maximum defect was estimated with the likelihood method. Fatigue limit with the Murakami and Ueno methods were then determined. Bending fatigue tests were also carried out following stair case procedure in order to evaluate the fatigue strength at 500,000 cycles. The results obtained with the two approaches are in agreement considering the short life target and failure condition of the stair case tests.
Fractured surface of the wheels that failed before this target life were analyzed using SEM, usually showed the presence of sup-superficial porosities; only one fracture surface highlight the presence of oxide at the crack nucleation point. Therefore further investigations have to be carried out to better understanding the effect of this casting defects on the fatigue behaviour.
Acknowledgements:
Autors would like to thank C. Sorlini, R. Frizzi and G. Benini, Cromodora Wheels S.p.A. for bending fatigue testing availability and useful discussions.
References
Li, P., Maijer, D.M., Lindley, T.C., Lee, P.D., 2007. Simulating the residual stress in an A356 automotive wheel and its impact on fatigue life. Metallurgical and Materials Transaction B 38B, 505–515.
Roy, M.J., Nadot, Y., Nadot-Martin, C., Bardin, P.G., Maijer, D.M., 2011. Multiaxial Kitagawa analysis of A356-T6. Internation Journal of fatigue 33, 823-832.
Wang, Q.G., Apelian, D., Lados, D.A., 2001. Fatigue behaviour of A356-T6 aluminum cast alloy. Part I. Effect of casting defects. Journal of light metals 1, 73-84.
Dwivedi, S.P., Sharma, S., Mishra, R. K., 2014. A356 aluminum alloy and applications –a review. Advance material manufacturing & characterization 4, issue 2.
ASTM E 3-11, 2003. Standard Guide for preparation of metallographic specimens, Book of standards.
ASTM E 2283-03, 2003. Standard practice for extreme value analysis of nonmetallic inclusion in steel and other microstructural features, Book of standards.
Merkus H. G., 2009. Particle size measurements: fundamentals, practise, quality, Springer Ed.: 15
Fintova S., Konec ̌ná R., Nicoletto G., 2009. Statistical description of largest pore size in modified Al-Si alloys. Materials engineering 16, 24-28. Nicoletto G., Konec ̌ná R., Fintova S., 2012. Characterization of microshrinkage casting defects of Al-Si alloys by X-ray computed tomography
and metallography. International journal of fatigue 41, 39-46.
Murakami Y., 2002. Metal fatigue: effects of small defects and nonmetallic inclusions. Oxford: Elsevier science & technology 35-71, 321-342 Bonollo F., Tovo R., 1999. Fatigue in Al casting alloys: metallurgical aspects. TALAT Lecture 1254.
Beretta S., Ghidini A., Lombardo F., 2003. Fracture mechanics and scale effects in the fatigue of railway axles. Engineering fracture mechanics 72, 195-208.
Anderson C.W., Beretta S., De Maré J., Svensson T., 2002. ESIS P11-02: technical recommendations for the extreme value analysis of data on large nonmetallic inclusions in steel, ESIS procedures and documents.
Gumbel E.J., 1958. Statistics of extremes, New York: Columbia University Press.
Murakami Y., Beretta S., 1999. Small defects and inhomogeneites in fatigue strength: experiments, models and statistical implications. Extremes 2-2, 123-147.
Beretta S., 2001. Metodi per la valutazione della resistenza a fatica dei componenti meccanici: la fatica ad alto numero di cicli di componenti contenenti difetti, Corso di aggiornamento POLIMI, 13-15.
Scho ̈nbauer M.B., Yanase K., Endo M., 2017. The influence of various types of small defects on the fatigue limit of precipitation-hardened 14-4PH stainless steel. Theoretical and applied fracture mechanics 87, 35-49.
Beretta S., 2013. Application of multiaxial fatigue criteria to materials containing defects, Fatigue fracture engineering material structure 26, 551-559.
Donzella G., Faccoli M., Mazzù A., Petrogalli C., Desimone H., 2011. Influence of inclusion content on rolling contact fatigue in a gear steel: experimental analysis and predictive modelling. Engineering fracture mechanics 78, 2761-2774.
Noguchi H., Morishige K., Fujii T., Kawazoe T., Hamada S., 2007. Proposal of method for estimation stress intensity factor range on small crack for light metals. Proc. 56th JSMS annual meetings 197-138
Tajiri A., Nozaki T., Uematsu Y., Kaiuchi T., Nakajima M., Nakamura Y., Tanaka H., Fatigue limit prediction of large scale cast aluminum alloy A356, Procedia materials science 3 (2014): pp. 924-929.
Ramamurty Raju, P., Satyanarayana B., Ramji K., Suresh B.K., 2007. Evaluation of fatigue life of aluminium alloy wheels under radial loads. Engineering failure analysis 14, 791-800.