General Index
General Index ... 2
PART ONE: Scientific Motivations, S/U Analysis, Benchmark Possibilities ... 3
1. Introduction ... 4
2. Scientific motivations ... 5
3. Sensitivity and Uncertainty theory ... 14
3.1 Sensitivity ... 14
3.2 Uncertainty ... 16
4. Calculation tools ... 16
5. Calculation models ... 18
6. Results and discussions ... 19
7. Conclusions ... 23
References to Part One ... 23
PART TWO: Preliminary Set-ups for the production of an EMPIRE evaluation ... 25
PART ONE
1. Introduction
Fuel assemblies (FAs) of Light Water Reactors (such as PWRs, BWRs, or VVERs) of 2nd and 3rd Generations make extensive recourse to s.c. “burnable neutron poisons” in various forms and technical solutions. These burnable poisons are chosen among those isotopes having thermal neutron capture cross sections comparable or higher than the thermal neutron fission cross section of 235U; they are in fact used as competitors to 235U in the absorption of thermal neutrons, in such a way that, being their absorption parasitic for the neutron chain reaction, they can compensate an initial higher fuel enrichment that, for safety reasons, could not be inserted in the fuel pins. As soon as the fuel in the FAs is burnt during the operation of a given reactor, both 235U and burnable poisons are depleted so that the compensating effect of the poisons is neutralized at a point in the cycle of the fuel at which the remaining amount of fissile material can be controlled easily and safely by other available means. This idea can naturally increase the overall length of the fuel cycle by allowing higher amounts of fissile material, which correspond to higher enrichments in 235U, loaded in FAs and then in reactor cores. This, of course, means in turn better economy of both the nuclear fuel and of the management of reactors: fuel reloading into cores can be done after longer periods of uninterrupted operation [1].
Several types and forms of burnable poisons have been successfully tested over the past decades; the most common one being gadolinia (Gd2O3) mixed directly within the UO2 fuel matrix; this
assures that the burnable poison is never separated from the active material it must control. Gadolinium oxide is, therefore, a kind of dopant within the UO2 material itself. The absorption of
thermal neutrons is of course provided by the odd isotopes 157Gd and, to a far lesser extent, 155Gd. Gadolinium is used, for the sake of simplicity, in its natural isotopic composition. Its first use in a commercial reactor dates back to 1973.
To give an example, gadolinia as burnable poison is used presently, and since 2002, in the s.c. Cyclades and Gemmes core managements schemes by Electricité de France in its CP0 and 1300 MWe PWR reactors respectively [2,3]. Not all FAs in a core contain fuel pins doped with Gadolinium; the Gemmes scheme, for instance, foresees a reload of 64 FAs (corresponding to 1/3 of the whole core), 24 of which contain some pins with Gd2O3 mixed to UO2 [2]. The choice of the
position within a core where FAs with gadolinium fuel pins are placed is also dictated by an optimization of the power density distribution; such an optimization also favors the achievement of higher thermal safety margins for these reactors.
Gadolinium isotopes cross sections are therefore crucial in assessing the neutronic performances and safety features of FAs and whole cores. The proper knowledge of these cross sections is not only relevant at the Beginning of Life (BOL) of a FA but also during its life cycle; in fact, accurate predictions of the burning rate of odd isotopes is fundamental in the prediction of the appearance of the FA reactivity peak and its intensity. In turn, these two parameters are of utmost importance in the assessment of the criticality safety margins for the storage of partially burnt fuel inside Spent Fuel Pools (SFP) of reactors, especially during postulated loss-of-coolant or loss-of-cooling accidents at these storage facilities [4]. The correct prediction of the 3D spatial distribution of the Gadolinium isotopes remaining within a partially burnt FA that has been put in interim storage in an
SFP, possibly during a refueling outage of the reactor, is fundamental for a correct estimate of the criticality safety margins of SFPs. It must be remembered in fact that the neutron flux distribution inside a core is far from uniform, with both axial and radial gradients, which produce a non-uniform burning of both fissile isotopes and Gadolinium isotopes.
A good prediction of the depletion of Gadolinium isotopes is also necessary to estimate the s.c. “residual reactivity penalty” that is essentially the value of anti-reactivity associated to the high-burnup, equilibrium concentrations of odd and even isotopes; this value is important because if it is too high it can induce a limitation on the total amount of time a given FA can be used at full power. This effect is unavoidable but should be well predictable to foresee a good fuel management scheme. To give just a rough example, the reactivity penalty due to 16 gadolinium fuel pins with initial 8.0 w% of gadolinia in UO2 for a 17x17 PWR FA (average 235U enrichment of 4.5 w%)
corresponds roughly to the “loss” of 5 full-power days per year [5]. In the electricity energy market of France, 5 full-power days of an III-Generation EPR reactor tally roughly to 8 M€ [6].
A more accurate assessment of Gadolinium isotopes cross sections is also essential for CANDU reactors. In fact, in the case of severe accidents due to or leading to criticality excursions, one of the safety systems provides that Gadolinium nitrate is injected into the heavy water moderator, to reduce/eliminate criticality risk or excursions. Figure 1 shows the two CANDU independent fast-acting safety shutdown systems. Shutdown system 2 consists of a set of poison tanks filled with gadolinium nitrate solutions that, using a high-pressure helium tank as driver, can be quickly diluted, through proper injections nozzles, into the low-pressure moderator. The amount of negative reactivity injected into the core, and therefore the safety margins against overcriticality, depend of course on the Gd (n,γ) cross sections.
Figure 1: Candu reactor safety systems
Finally, it should be remembered that Gadolinium isotopes are also fission products and are produced by the nuclear fuel as its burnup increases; they, therefore, act as neutron poisons also in their role of fission products and they must be accounted for in burnup and depletion calculations of FAs.
The necessity of an updating in the gadolinium odd isotopes cross sections evaluations is based on a series of quantitative scientific considerations. First of all, as it is shown in Fig. 2, the current gadolinium odd isotopes (n,γ) cross sections (i.e. ENDF/B-VII.1) present, in the high sensitivity thermal energy range, not negligible (5-10%) uncertainty values.
Figure 2: Relative standard deviation of 155Gd and 157Gd capture cross sections
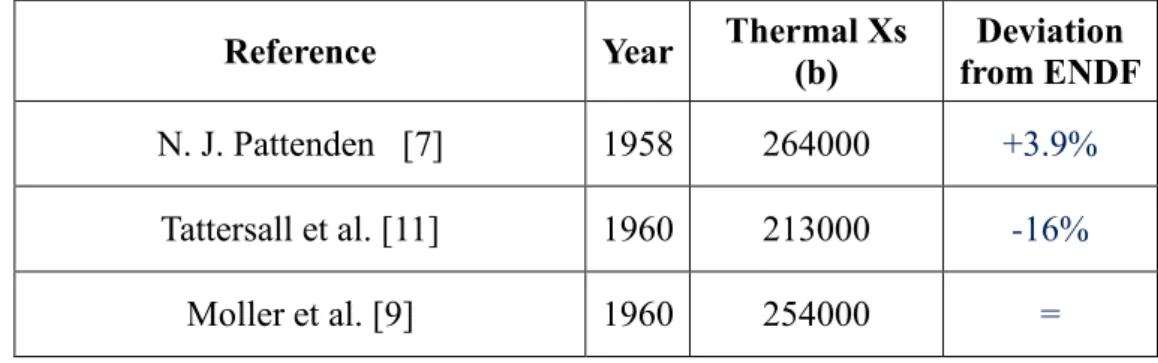
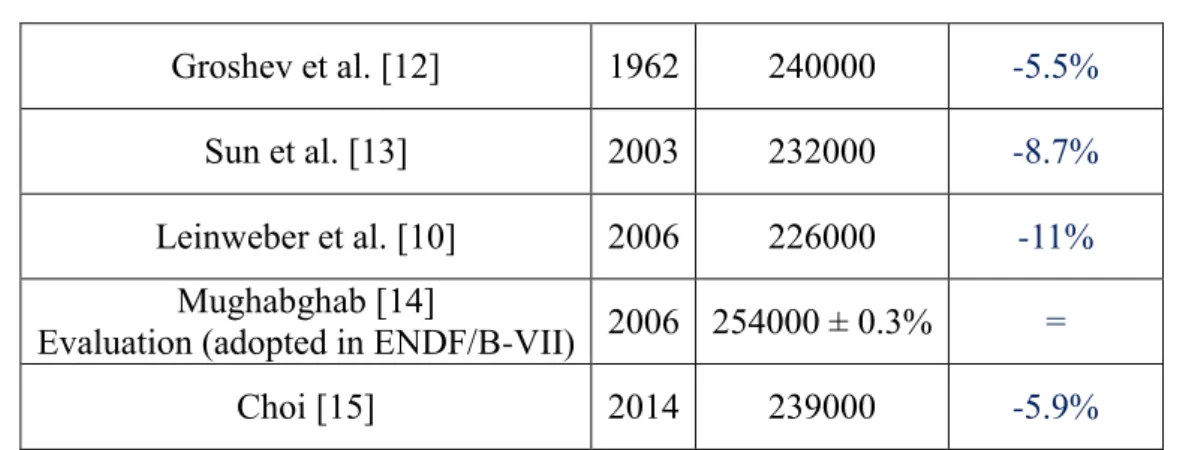
Furthermore, the capture cross section of the odd Gadolinium isotopes has not been extensively studied and is not known with the accuracy typically required by the nuclear industry. Looking at the EXFOR database, there seems to be available only one experimental point for 157Gd(n,) in the energy region below the resolved resonances, namely at 2200 m/s, which was determined to be roughly 264000 b. This single data-point was published in 1958 and no uncertainty was associated with it [7]. Again in 1958, the BNL-325 Report instead gave a value of 240000 b [8]. In 1960, a second set of data was extracted from total cross section measurements [9], which gave a value of 254000 b. One has then to wait 2006 before having another measurement at 2200 m/s [10]: 226000 b, about 11% lower with respect to the value assumed for the ENDF/B-VI.8 evaluation (254000 b). Tab. 1 shows a summary of the scientific literature historical progression in the 157Gd neutron capture thermal cross sections evaluation as described above.
Table 1: Evaluations of 157Gd thermal capture cross sections as reported in scientific literature
Reference Year Thermal Xs
(b) Deviation from ENDF N. J. Pattenden [7] 1958 264000 +3.9% Tattersall et al. [11] 1960 213000 -16% Moller et al. [9] 1960 254000 =
Groshev et al. [12] 1962 240000 -5.5%
Sun et al. [13] 2003 232000 -8.7%
Leinweber et al. [10] 2006 226000 -11%
Mughabghab [14]
Evaluation (adopted in ENDF/B-VII) 2006 254000 ± 0.3% =
Choi [15] 2014 239000 -5.9%
Table 1 shows that even if considering only the recent (2003-2014) odd isotopes gadolinium capture cross sections evaluations there is a significative (6-11%) deviation with respect to ENDF/B-VII reference (2006) data. For this reason, the uncertainty (0.3%) associated with the reference data cannot be considered a safe estimate for evaluating the actual range of values that could take the thermal cross section.
Another scientific circumstance that suggests a necessity for an improvement of the gadolinium odd isotopes cross sections are the results of the French Commissariat à l’Energie Atomique et aux énergies Alternatives (CEA) qualification program for French LWR using the Melusine research reactor in Grenoble, before its shutdown and decommissioning. Fig. 3 shows containment and pool core of the Melusine research reactor.
Figure 3: Containment (left) and pool core (right) of the Melusine research reactor
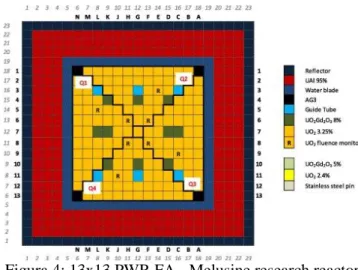
The latest of this experimental campaign, called Gedeon-II (1985-88), consisted in the irradiation of a dedicated special 13x13 PWR FA containing gadolinia pins, up to about 13 GWd/MTU, followed by a very accurate post-irradiation examination in order to make it possible to compare experimental results to calculation predictions [16,17].
Figura 4: 13x13 PWR FA - Melusine research reactor
A total of 123 radiochemical data from the post-irradiation examinations is specifically dedicated to gadolinium isotopic content. The most recent experiment-to-calculation comparison is that of 2014 by Bernard and Santamarina [17] who used the Apollo2.8 reference deterministic code with multigroup cross section libraries based on the JEFF 3.1.1 evaluated library to simulate the Gedeon-II experiment. While the overall predictions on Gadolinium isotopics look quite good, still some non-negligible biases are found for 157Gd. In detail and as Tab. 2 shows, the 157Gd relative error (C/E-1) between calculated and experimental concentration data was found to be roughly between 2% and 25%, depending on the specific level of burnup and intra-assembly positions.
Table 2: Calculate and experimental values (C/E-1) of gadolinium isotopes
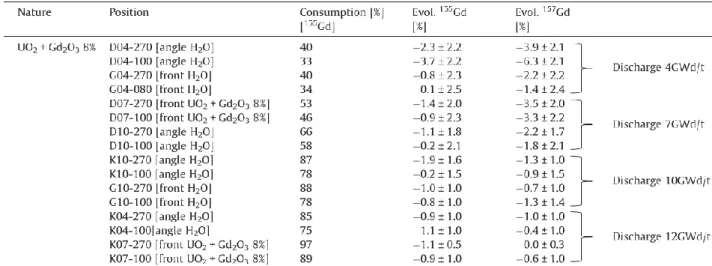
This circumstance just described is confirmed by the results provided in Tab. 3 that report the ratio between calculated and experimental consumption relative values (NGd(0)-NGd(BU)/NGd(0)) of 155 and 157 gadolinium odd isotopes.
Table 3: Calculated and experimental comparison for Gd consumptions
This non-negligible bias (the ratio between calculated and experimental gadolinium odd isotopes concentrations has always a negative sign in each FA position and at every burnup level) probably points to the fact that the JEFF-3.1.1/ 157Gd(n,) evaluation in the experiment energy range is incorrect.
The impact of a recent measurement of the neutron capture and total cross sections and resonance parameters of gadolinium-isotope in the range 1 to 300 eV [10] has also been tested on BWR reactor physical parameters. In particular, a comparison between computational and experimental values of rod-by-rod total fission rate (C/E) and modified conversion ratio prediction was performed. The measured values have been produced in the framework of the LWR-PROTEUS, a joint research program between the Paul Scherrer Institut (PSI) and an association of the Swiss nuclear operators (Swissnuclear), experiments in Switzerland. The calculation values were obtained using CASMO-4 with the real Gd vector and the JEF-2.2 and ENDF/B-VI libraries, and with the Gd effective vector, developed to take into account the newly-measured cross sections, with the ENDF/B-VI library. This preliminary study showed that the effect of the newly-measured gadolinium cross-sections seems to have the potential to resolve some of the different trends observed between calculated and experimental values for the gadolinium-containing rods [18]. In the context of the LWR-PROTEUS program (Phase I and III), a radial distribution of the total fission rate (Ftot) and the 238U-capture-to-total-fission (C8/Ftot) ratio was measured in BWR
assemblies of the type of SVEA-96+ , SVEA-96 Optima2. Fig. 5 shows the PROTEUS reactor core.
The comparison of measured values with an MCNPX calculation have shown an underprediction of Ftot and an overprediction of C8/Ftot in the UO2-Gd2O3 pins when using cross sections obtained from
ENDF/B-VI, JEFF-3.0, or JEFF-3.1. Predictions using the new set of gadolinium cross section have been found to increase the calculated fission rates in the UO2-Gd2O3 pins and a much better
agreement with the experimental values of the normalized Ftot radial distributions. No change was
observed on the 238U captures because the flux change in the UO2-Gd2O3 pins above 0.625 eV is
<0.1% [19].
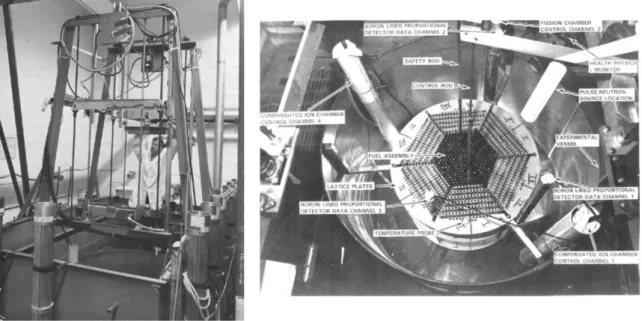
Despite the circumstances previously described [18,19], the goodness of the newly evaluated data is not confirmed by tests performed on a set of the International Criticality Safety Benchmark Evaluation Project (ICSBEP) [20]. The ICSBEP comparison results reported in this technical reports are referred to three experimental facilities: COM-THERM-005 (LCT-005), LEU-COM-THERM-014 (014) and HEU-SOL-THERM-014 (HST-014). Fig. 6 displays the LCT-005 system.
Figure 6: Experimental Critical Facility LCT-005
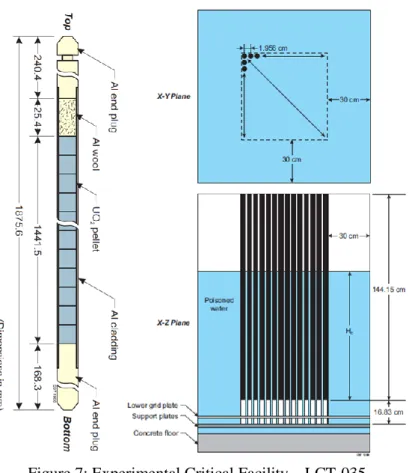
Essentially, LCT-005 is a single array of low-uranium dioxide fuel rods fully submerged in, and reflected by, either water or water containing dissolved gadolinium nitrate. Fig. 7 shows the geometrical dimensions of the LCT-035 experimental facility. This system is constituted by a 21x21 array of low-enriched UO2 fuel rods in water with soluble gadolinium or boron poison.
Experimental critical sizes are reported for light-water-moderated and reflected UO2 fuel-rod cores with soluble poisons, natural boron and natural gadolinium (nitrate).
Figure 7: Experimental Critical Facility – LCT-035
HST-004 critical experimental facility consists of a nitrate solution (70 g/l) with Gadolinium. Fig. 8 presents an axial view of the facility and the experimental conditions used to perform some calculations in the International Criticality Safety Benchmark Evaluation Project.
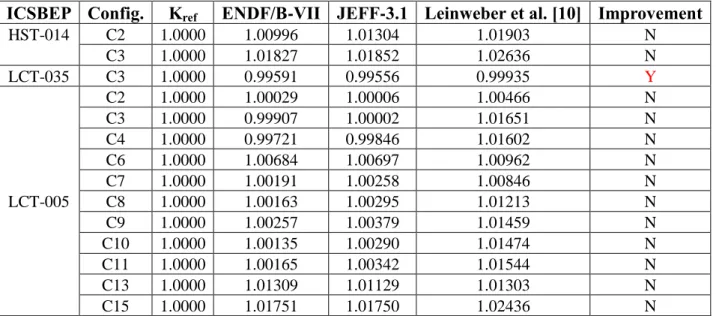
Tab. 4 is a comparison between the reference and the evaluated criticality coefficient (Keff) ‒ for a
serious of cases ‒ that represent specific physical conditions imposed on the previous described experimental facility ‒ as results from calculations with ENDF/B-VII, JEFF-3.1, and Leinweber et al. [10] cross sections data.
Table 4: Keff comparison values of a series of ICSBEP experiments
ICSBEP Config. Kref ENDF/B-VII JEFF-3.1 Leinweber et al. [10] Improvement
HST-014 C2 1.0000 1.00996 1.01304 1.01903 N C3 1.0000 1.01827 1.01852 1.02636 N LCT-035 C3 1.0000 0.99591 0.99556 0.99935 Y LCT-005 C2 1.0000 1.00029 1.00006 1.00466 N C3 1.0000 0.99907 1.00002 1.01651 N C4 1.0000 0.99721 0.99846 1.01602 N C6 1.0000 1.00684 1.00697 1.00962 N C7 1.0000 1.00191 1.00258 1.00846 N C8 1.0000 1.00163 1.00295 1.01213 N C9 1.0000 1.00257 1.00379 1.01459 N C10 1.0000 1.00135 1.00290 1.01474 N C11 1.0000 1.00165 1.00342 1.01544 N C13 1.0000 1.01309 1.01129 1.01303 N C15 1.0000 1.01751 1.01750 1.02436 N
As results from Table 4, the use of the Leinweber et al. gadolinium cross sections evaluated data does not involve any improvement (except for the LCT-035 C3 system) in the criticality coefficient evaluation.
Possible mistakes in the evaluation of the gadolinium cross sections data are also confirmed by some simulations that have recently been made in ZED-2 (Zero Energy Deuterium) critical facility at the Chalk River Laboratories, AECL, to study the reactivity effect up to 1.5 ppm of gadolinium in the moderator. The experiments at ZED-2 and their comparison with simulations were conducted just because the most recent evaluation provided by Leinweber et al. [10] could have posed serious safety concerns to CANDU reactors in case it was confirmed Fig. 9 is a schematic representaiton of an axial view of the ZED-2 research reactor.
Figure 9: Axial section of ZED-2 Research Reactor
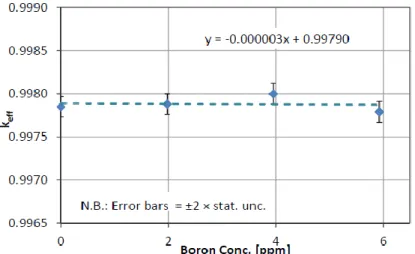
Monte Carlo calculations (Fig. 10) have confirmed the capacity of boron cross sections evaluated data to correctly predict the ZED-2 almost criticality configuration with a two-sigma uncertainty over a 0-6 ppm range of the boron concentration.
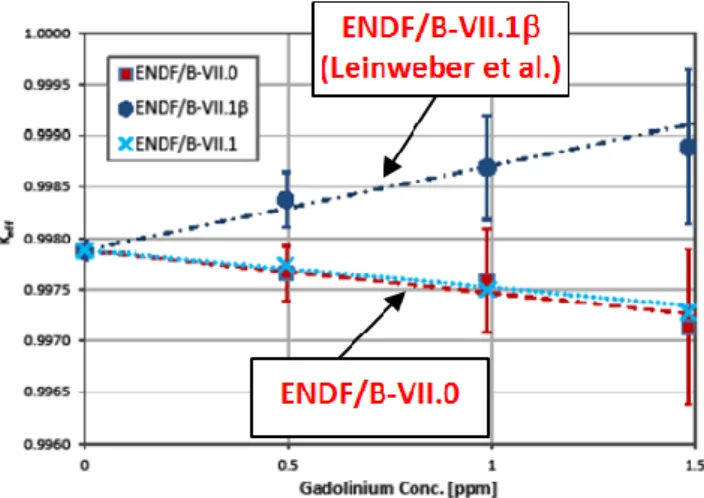
Figure 10: Monte Carlo keff evaluated values vs. boron concentration ‒ ZED-2 research reactor This was however not the case for gadolinium cross sections; in fact, another result of the study was the investigation of the quantitative effect on the k-effective value using various sources of gadolinium neutron capture cross sections in an MCNP simulation of the reactor system. In detail, the gadolinium cross sections adopted have been the ENDF/B-VII.0, the ENDF/B-VII.1 based on the Leinweber et al. data, and the ENDF/B-VII.1[21]. As reported in Fig. 11, the multiplication coefficient evaluation of the ZED-2 facility obtained by means of an MCNP simulation has shown, with respect to the experimental values, an eigenvalue overestimation using the ENDF/B-VII.1 (Leinweber et al.) data and an underestimation using the ENDF/B-VII.0 data, the experimental configurations having always been such that keff=0.998 at each gadolinium concentration level. Moreover the error introduced by the Gd cross sections was higher the higher the Gd concentration in the reactor.
Figure 11: Comparison of keff values with different ENDF evaluated data
The comparison of simulations vs. experiments confirmed that both the ENDF/B-VII.0 data and those by Leinweber et al. [10] are wrong, that the correct cross sections lie somewhat in between the two evaluated sets, and that CANDU reactors still have adequate safety shutdown margins. The obtained results show, once again, the need for a re-evaluation of the gadolinium odd isotopes capture cross sections data.
All in all, there seems to be space and justification for newer and improved experimental cross section determinations in the low energy range, especially targeted to 157Gd(n,), to which very accurate uncertainty and covariance values should be also added in order to improve the neutronic analyses of nuclear fuels.
3. Sensitivity and Uncertainty theory
In this paragraph, a short presentation of the theoretical background of sensitivity and uncertainty analysis is reported. A more detailed discussion of the sensitivity and uncertainty theory is reported in [22].
3.1 Sensitivity
An integral reactor parameter Q (i.e., fundamental eigenvalue, reaction rate, reactivity coefficient) is a complex mathematical function of its independent cross sections data parameters:
𝑄 = 𝑓(𝜎1, 𝜎2, … , 𝜎𝑛) (1) Uncertainty in the evaluation of the independent parameters involves a deviation of the integral parameter with respect to its nominal value. A possible mathematical evaluation of such deviation can be performed by developing relationship (1) in a Taylor series around a nominal value:
𝑄(𝜎1, … , 𝜎𝑛) = 𝑄(𝜎10, … , 𝜎𝑛0) + ∑ 𝜕𝑄 𝜕𝜎𝑖 | 𝑛 𝑖=1 𝜎 𝑖0, (𝜎𝑖− 𝜎𝑖0) + ∑ ∑ 𝜕2𝑄 𝜕𝜎𝑖𝜕𝜎𝑗 | 𝜎𝑖0,𝜎𝑗0 (𝜎𝑖− 𝜎𝑖0)2 2! + ⋯ + 𝑅𝑛(𝜎) 𝑛 𝑗=1 𝑛 𝑖=1 (2)
If the variations of all independent cross sections variables with respect to the nominal value are such that in (2) the second order term can be neglected (i.e. if it appears that (∆𝜎𝑖 )2 ≪ 1 ∀𝑖 ), it’s reasonable to truncate the Taylor series at first order:
𝑑𝑄 = ∑𝜕𝑄 𝜕𝜎𝑖|
𝑛
𝑖=1 𝜎𝑖0
𝜕𝜎𝑖 (3)
Relationship (3) can be expressed in a more general form by introducing the relative difference of the integral and physical parameters:
𝑑𝑄 𝑄0 = ∑𝜕𝑄 𝜕𝜎𝑖 | 𝑛 𝑖=1 𝜎𝑖0 𝜕𝜎𝑖 𝜎𝑖0 ∙𝜎𝑖0 𝑄0 (4)
Relative variation of Q due to the change of an independent cross-section data parameters can be expressed in terms of a sensitivity coefficient as follow:
𝑑𝑄 𝑄0 = ∑𝑆𝑖|𝜎𝑖0 ∙ 𝑛 𝑖=1 𝜕𝜎𝑖 𝜎𝑖0 (5) where the sensitivity coefficient are formally given by:
𝑆𝑖 =
𝜕𝑄 𝑄⁄ 𝜕𝜎𝑖⁄𝜎𝑖
(6)
Relationship (6) assesses how a given cross section is important in the estimation process of Q, as a function of the incident neutron energy; it is capable of estimating how much, and in which energy region, an error in the cross-section propagates to an error in Q. A complete sensitivity coefficient is characterized by two components as follows:
𝑑𝑄 𝑄0 = ∑ 𝑆𝑗 𝑛 𝑗=1 ∙𝜕𝜎𝑗 𝜎𝑗0 + (𝜕𝑄 𝜕𝜎𝑒∙ 𝜎𝑒 𝑄) ∙ 𝜕𝜎𝑒 𝜎𝑒 (7)
where the first and second terms on the right side of (7) are generally denoted as indirect (I) and direct (D) effects, respectively. The D term is the contribution to the variation of the integral parameter Q only due to a variation of the energy dependent cross-section 𝜎𝑒. On the contrary, the I
term is an indirect contribution to Q due to flux perturbation. The indirect term consists also of two components, namely, the explicit and implicit ones. The explicit component comes from the flux perturbation caused by perturbing any multi-group cross-section appearing explicitly in the transport equation. The implicit component is associated with a flux perturbation due to a change of the self-shielding of a nuclide by means of a perturbation of the cross sections of another nuclide. For example, if one considers hydrogen, perturbing the H elastic value has an explicit effect because the flux is perturbed due to change in H moderation. However there is also an implicit
effect because changing the H data causes another flux perturbation because of a perturbation in the absorption cross section of 238U due to a change in self-shielding [23].
3.2 Uncertainty
The uncertainties are associated to the cross-sections and can be expressed, for a generic number of nuclides, in a mathematical formulation defining a variance-covariance matrix that, with respect to a nuclear reaction r, takes the following form:
𝐶𝜎,𝑟 = [
𝑐11 … 𝑐1𝑛
⋮ ⋱
𝑐1𝑛 𝑐𝑛𝑛
] (8)
where the generic element 𝑐𝑖𝑗 of (8) represents the variance (𝜎𝑖,𝑟2 ; 𝑖 = 𝑗) and covariance (𝜎𝑖,𝑟𝜎𝑗,𝑟; 𝑖 ≠ 𝑗) of the nuclear data. The cross sections uncertainty (𝑐𝑖𝑗), convoluted with the
sensitivity (𝑆𝑗), gives the related uncertainty to be associated in the evaluation of Q. The uncertainty of the Q integral parameter can be expressed as:
𝜎𝑄,𝑟2 = ∑ 𝑆𝑖,𝑟𝑆,𝑟𝑗𝑐𝑖𝑗,𝑟
𝑛
𝑖,𝑗
(9)
Relationship (9) can also be expressed in terms of a vector-matrix formulation as follow:
𝜎𝑄,𝑟2 = 𝑆𝑄,𝑟∙ 𝐶𝜎,𝑟∙ 𝑆𝑄,𝑟𝑇 (10) The introduction of a sensitivity matrix defined as a dyadic product of the sensitivity vector (𝑆𝑖) and its transposed (𝑆𝑖𝑇):
𝑆𝑄,𝑟 = 𝑆𝑄,𝑟𝑆𝑄,𝑟𝑇 = [
𝑠11 … 𝑠1𝑛
⋮ ⋱
𝑠1𝑛 𝑠𝑛𝑛
] (11)
allows to represent the relative variance of the integral parameter Q in a more compact form as a dyadic product between two matrices [24]:
𝜎𝑄,𝑟2 = 𝑆𝑄,𝑟 ∶ 𝐶𝑄,𝑟 (12) where 𝑆𝑄,𝑟 is the sensitivity matrix and 𝐶𝑄,𝑟 is the variance-covariance matrix.
4. Calculation tools
The Sensitivity and Uncertainty (S/U) codes in SCALE 6.1 are collectively referred to as TSUNAMI (Tools for Sensitivity and Uncertainty Analysis Methodology Implementation) [25]. The S/U analysis results presented in this paper have been performed using TSUNAMI-2D a functional module of the SCALE 6.1 control module TRITON (Transport Rigor Implemented with Time-dependent Operation for Neutronic depletion) carried out to determine response sensitivity and uncertainty. The S/U calculations are completely automated to perform: (a) cross sections
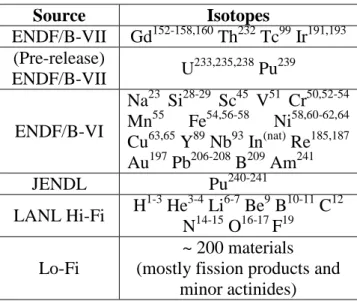
self-shielding operations, (b) forward and adjoint transport calculations, (c) computation of sensitivity coefficients, and (d) calculation of the response uncertainty [26]. The calculation procedure for the (a) step is based on a rigorous mechanism using the continuous energy solvers BONAMIST and CENTRM for self-shielding in the unresolved and resolved resonance regions, respectively, for appropriately weighting multi-group cross-sections using a continuous energy spectrum. The CENTRM module performs transport calculations using ENDF-based point data on an ultrafine energy grid (typically 30.000-70.000 energy points) to generate effectively continuous energy flux solutions in the resonance and thermal ranges. This is used to weight the multi-group cross sections to be utilized in the subsequent transport calculations. After the cross-sections are processed, the TSUNAMI-2D sequence performs two criticality calculations, solving the forward and adjoint forms of the Boltzmann equation, respectively, using the NEWT bidimensional discrete ordinate code. In this step, an energy discretization based on a 238-groups structure is adopted. The sequence then calls the SAMS module in order to compute the sensitivity coefficients. Once the sensitivities are available, the uncertainty on the integral parameters of interest due to the uncertainty in the basic nuclear data are evaluated according to (12) using the so-called 44 GROUPCOV covariance matrix. The 44GROUPCOV matrix comprehends a total of 401 isotopes in a 44-group energy structure. The library includes “low fidelity” (lo-fi) covariances spanning the full energy range that consists of ORNL covariances based on the integral approximation in the thermal and epithermal ranges, combined with approximate uncertainties generated by the Brookhaven National Laboratory (BNL) and Los Alamos National Laboratory (LANL) in the high energy range above 5.5 keV. The high energy covariance data were generated with nuclear model codes and included uncertainties for inelastic (n,2n), capture, fission, and elastic reactions. In addition to lo-fi covariances, LANL has provided full range “high fidelity” evaluations for elements lighter than fluorine. This is a significant benefit for addressing moderator materials. Tab. 5 summarize the sources of covariance data in the SCALE-6 covariance library [27].
Table 5: Sources of covariance data in the SCALE 6.1.3 covariance library
Source Isotopes ENDF/B-VII Gd152-158,160 Th232 Tc99 Ir191,193 (Pre-release) ENDF/B-VII U 233,235,238 Pu239 ENDF/B-VI Na23 Si28-29 Sc45 V51 Cr50,52-54 Mn55 Fe54,56-58 Ni58,60-62,64 Cu63,65 Y89 Nb93 In(nat) Re185,187 Au197 Pb206-208 B209 Am241 JENDL Pu240-241 LANL Hi-Fi H 1-3 He3-4 Li6-7 Be9 B10-11 C12 N14-15 O16-17 F19 Lo-Fi ~ 200 materials (mostly fission products and
minor actinides)
TSUNAMI-2D simulations have been executed using the v7-238 SCALE cross sections libraries based on the ENDF/B-VII (release 0) library. The adjoint and forward transport calculations have
been performed with the following convergence numerical criteria: 10-6 for the critical eigenvalue and 10-4 for the inner and outer spatial convergence iterations. The quadrature and scattering orders (Sn and Pn) respectively have been set to 16 and 1 (2 only for the moderator material). The iterative transport solutions have been accelerated using a coarse-mesh finite-difference approach (CMFD).
5. Calculation models
In order to quantify the maximum impact of the uncertainty of the gadolinium isotopes cross sections on the criticality of a LWR system, calculations have been performed on two types of PWR fuel assemblies - that present the highest number of gadolinium fuel pins among the17x17 EPR™ FA configurations [28,29] - and on three types of BWR FA systems containing gadolinium fuel pins. In particular, the FAs studied are: the UK-EPR FA (UK-EPR-A, UK-EPR-B), the US-EPR FA (US-EPR-C3), the 7x7 BWR FA (GE7x7) used at the Peach Bottom USA reactor, the General Electric 9x9-7 BWR FA (GE9x9-7), the General Electric 10x10-8 BWR FA (GE10x10-8). The details of physical parameters used for the FAs analyzed are reported in Tab. 6.
Table 6: Technical specifications of PWR fuel assembly FA Type 235U enr.
(w%) Nr. of Gd pins, Gd2O3 enr. (w%) Moderator Density (g/cm3) Boron content in moderator (pcm) GE7x7 2.93 4, 3.0 0.45 0 GE9x9-7 3.61 14, 5.0 0.45 0 GE10x10-8 4.12 14, 5.0 0.25 0 0.35 0.45 0.55 0.65 0.75 UK-EPR-A 3.20 20, 8.0 0.75 0 UK-EPR-B 5.00 24, 8.0 US-EPR-C3 3.25 12, 8.0 + 4, 2.0 0.75 0 3.25 12, 8.0 + 4, 2.0 600
Fig. 12 and 13 show a material and geometrical representation of the PWR and BWR assemblies configurations as described above.
Figure 12: U.K. EPR FA, enr 5.0% @ 24 Gd fuel pins (left); U.K. EPR FA, enr 3.2% @ 20 Gd fuel pins (right); U.S. EPR FA, enr 3.25% @ 16 Gd fuel pins (center)
Figure 13: GE BWR FA 9x9-7 @ 12 Gd fuel pins (left); GE BWR 10x10-8 @ 14 Gd fuel pins (center); GE BWR 7x7 @ 6 Gd fuel pins (right)
Sensitivity and uncertainty analyses have been performed for the various cases listed in the previous table to compute the contribution of the gadolinium odd isotopes to the overall uncertainty in criticality eigenvalue evaluations and to investigate the effect of moderator density and the number of the gadolinium fuel pins to the global gadolinium odd isotope sensitivity in the FAs systems.
6. Results and discussions
A series of NEWT/TSUNAMI-2D and SAMS5 calculations have been executed for each FA configuration listed in Table 6 to quantify the gadolinium odd isotopes sensitivities and uncertainties for the neutron multiplication factor k. In details, the SU analysis has provided the uncertainty contributions, in decreasing importance order, to k of any nuclear reaction involved. In Table 7 the first 26 most significant contributors to the uncertainty of k for the GE 10x10-8 FA at moderator density of 0.45 g/cm3 is given. The choice of the GE 10x10-8 FA is due to the fact that this is the BWR configuration that contains the highest number of gadolinium fuel pins. It can be seen from the reported data that the (n,) reaction of odd isotopes 157Gd and 155Gd rank between 0.26 and 0.20 with respect to the most significant contributor which, therefore, has always rank set to one. Rank is defined as the ratio between the contribution to uncertainty in keff of a particular
couple of Nuclide-Reaction and the value of the maximum contribution to the uncertainty in keff. Table 7: Contribution to overall uncertainty in criticality eigenvalue for the GE 10x10-8 FA
Covariance Matrix
Contributions to Uncertainty in keff
(% Δk/k)
Rank
Nuclide-Reaction Nuclide-Reaction Due to this Matrix 235
U nubar 235U nubar 2.62E-01 1.00 238
U n,gamma 238U n,gamma 2.11E-01 0.80 238
U n,n' 238U n,n' 1.66E-01 0.63 235
235
U fission 235U fission 1.41E-01 0.54 235
U chi 235U chi 1.33E-01 0.51
235
U fission 235U n,gamma 1.18E-01 0.45 238
U nubar 238U nubar 8.35E-02 0.32 157
Gd n,gamma 157Gd n,gamma 6.72E-02 0.26 155
Gd n,gamma 155Gd n,gamma 5.15E-02 0.20 92
Zr n,gamma 92Zr n,gamma 4.12E-02 0.16 91
Zr n,gamma 91Zr n,gamma 3.55E-02 0.14 1
H elastic 1H elastic 3.31E-02 0.13 1
H n,gamma 1H n,gamma 3.08E-02 0.12 90
Zr n,gamma 90Zr n,gamma 2.74E-02 0.10 238
U fission 238U fission 2.25E-02 0.09 238
U elastic 238U n,gamma 1.96E-02 0.07 238
U elastic 238U elastic 1.82E-02 0.07 156
Gd n,gamma 156Gd n,gamma 1.77E-02 0.07 238
U n,2n 238U n,2n 1.26E-02 0.05 238
U chi 238U chi 1.23E-02 0.05
90
Zr n,n' 90Zr n,n' 1.13E-02 0.04 235
U elastic 235U fission -9.77E-03 -0.04 94
Zr n,gamma 94Zr n,gamma 8.24E-03 0.03 16
O n,alpha 16O n,alpha 7.43E-03 0.03 238
U elastic 238U n,n' 7.23E-03 0.03
It can be seen that 157Gd and 155Gd play the most important role immediately after that of 235U and
238
U, whose data are either not measurable at present at the n_TOF facility or already under experimental investigation.
The results of the SU analysis of k with respect to 157Gd(n,) cross sections is presented in Fig. 15. From Fig. 14, it can be seen that the energy range of highest sensitivity to the 157Gd(n,) reaction is between about 0.1 and 1 eV. In the same figure, two profiles at two different moderator densities are given; it can be seen that the overall shape of the sensitivity is little affected by this parameter. It can be concluded that any amelioration of 157Gd(n,) cross section in the 1/v energy range, particularly in the 0.1 – 1 eV range and especially if associated to low uncertainty values, represent a real improvement in the overall assessment of the neutronic properties of the FAs here analyzed.
Figure 14: Profiles of sensitivity per unit lethargy to 157Gd (n,g) cross section as a function of incident neutron energy for GE 10x10-8 FA; the two curves refer to different moderator densities. Fig. 14 also shows that the impact of 157Gd(n,) is slightly higher for BWR FAs at lower moderator densities. Finally, a sensitivity analysis of the effect of a different number (2,4,6) of gadolinium fuel pins on the k-effective in the BWR Peach Bottom 7x7 configuration has been performed. Fig. 16v shows the obtained results.
Figure 15: Effect of number of gadolinium fuel pins on the sensitivity profile
From the previous figure, it can be concluded that the value of the sensitivity on the overall energy range is significantly influenced by the number of gadolinium fuel pins (roughly an average factor two every two fuel pins).
An analysis of a different boron concentration has furthermore been performed on the US-EPR-C3 configuration. The results are presented in Table 8.
-2.50E-02 -2.00E-02 -1.50E-02 -1.00E-02 -5.00E-03 0.00E+00
1.00E-05 1.00E-03 1.00E-01 1.00E+01 1.00E+03 1.00E+05 1.00E+07
Se n si tiv ity/l e tar gy [ -] Energy [Me] ro=0.25 g/cc ro=0.75 g/cc -2.0E-02 -1.5E-02 -1.0E-02 -5.0E-03 0.0E+00
1.0E-05 1.0E-03 1.0E-01 1.0E+01 1.0E+03 1.0E+05 1.0E+07
Se n si tiv ity/l e tar gy [ -] Energy [MeV] Gd-157 Capture- 2 pin Gd-157 capture - 4 pin Ge-157 Capture - 6 pin
Table 8: Effect of boron concentration on Sensitivity and Uncertainty data FA Type Total k uncertainty (% Δk/k) 157 Gd(n,g) Rank (-) 155 Gd(n,g) Rank (-) Energy integrated Sensitivity to 157 Gd(n,g) (-) Energy integrated Sensitivity to 155 Gd(n,g) (-) US-EPR- C3 Boron (600 ppm) 0.5241 0.116 0.095 -1.520E-02 -8.595E-03 No-Boron 0.5203 0.116 0.094 -1.568E-02 -8.696E-03
The total energy integrated sensitivity of the gadolinium odd isotopes is slightly higher in the no-boron configuration. This condition is in agreement with the physical circumstance that the configuration with boron presents a harder neutronic spectrum on which the high sensitivity thermal region of the gadolinium odd isotopes has less influence. The rank of the odd isotopes is virtually unaffected by the boron concentration.
In order to make a comparison between the different FAs analyzed the total energy integrated sensitivity of 155Gd and 157Gd have also been evaluated; the results are reported in Tab. 9.
Table 9: Energy integrated Sensitivity and Uncertainty values for the FAs analyzed
FA Type Total k uncertainty (% Δk/k) 157 Gd(n,g) Rank (-) 155 Gd(n,g) Rank (-) Energy integrated Sensitivity to 157Gd(n,g) (-) Energy integrated Sensitivity to 155 Gd(n,g) (-) GE7x7 0.5426 0.12 0.08 -1.827E-02 -7.840E-03 GE9x9-7 0.4912 0.25 0.19 -2.971E-02 -1.573E-02
GE10x10-8 0.25 0.5153 0.28 0.22 -3.176E-02 -1.744E-02 0.35 0.499 0.27 0.21 -3.089E-02 -1.661E-02 0.45 0.4863 0.26 0.2 -3.001E-02 -1.584E-02 0.55 0.4763 0.25 0.19 -2.915E-02 -1.512E-02 0.65 0.4683 0.23 0.18 -2.832E-02 -1.444E-02 0.75 0.4618 0.22 0.17 -2.752E-02 -1.382E-02 UK-EPR 0.4913 0.21 0.18 -2.147E-02 -1.413E-02 US-EPR-C3 0.5241 0.12 0.09 -1.520E-02 -8.535E-03
From the data of Tab. 9 it can be seen that, excluding the configuration which has only four gadolinium fuel pins, the impact of 155Gd(n,) and 157Gd(n,) is highest for BWR FAs at low moderator densities. The rank for 157Gd(n,) ranges from 0.12 to 0.28, while that for 155Gd(n,) ranges from 0.08 to 0.22. The impact on the k values due to Gadolinium odd isotopes (n,) reactions may be from some tens to two or three hundred pcm at most. However, any gain in the precision over the estimates of k is more than welcome to the nuclear industry and the nuclear safety authorities. Any improvement in cross section knowledge is therefore desired.
7. Conclusions
A series of scientific results reported in the open literature shows that the use of gadolinium odd isotopes (157Gd and 155Gd) cross sections, currently implemented in the JEFF and ENDF/B-VII cross sections libraries, determines non-negligible differences in the evaluation of a system criticality with respect to experimental values. Even the most recent gadolinium odd isotopes cross sections evaluations don’t produce an improvement in the criticality value predictions. An S/U analysis on commercial PWR and BWR assembly configurations has shown that gadolinium capture cross sections are among the most significant nuclide-reaction contributors to the uncertainty in the k-effective evaluation. For these reasons and starting from all the scientific arguments presented in this paper, a series of measurements to re-evaluate with high accuracy and high resolution the 157Gd and 155Gd neutron capture cross sections between thermal and 20 MeV neutron energy is currently in place at the n_TOF facility of the European Council for Nuclear Research (CERN) [30] and scheduled for completion before the end of the Summer.
References to Part One
[1] K. W. Hesketh, Enc. of Mat.: Science and Tech. Elsevier, 252, 1 (2002). [2] H. Grand, in Génie Atomique. (EDP Science, 2014).
[3] N. Kerkar, P. Paulin, in Génie Atomique. (EDP Sciences, 2008).
[4] M. Adormi et al., Nuclear Energy Agency Report NEA/CSNI/R(2015)2, 2015.
[5] J. P. A. Renier et alt., Oak Ridge National Laboratory Report ORNL/TM-2001/38, 2001. [6] French Law 1488, 2010: Nouvelle Organisation du Marché de l’Electricité.
[7] N. J. Pattenden, in Proceedings of the Second International Conference on the Peaceful Uses of Atomic Energy, Neutron Cross Sections, Session A-11, P/11, 16, 44, 1958.
[8] D. J. Hughes, R. B. Schwartz, US Government Printing Office, Neutron Cross Sections, BNL-325, 1958.
[9] H. Bjerrum Moller, F. J. Shore, V. L. Sailor, Nucl. Science and Eng., 8, 3 (1960). [10] G. Leinweber et al., Nucl. Science and Eng., 154, 3 (2006).
[11] R. B. Tattersall, H. Rose, et al., Jour. Of Nuc. Energy Part A, 12, 1 (1960).
[12] L.V. Groshev, et al., IZv.Akad.Nauk SSSR, Ser.Fiz. 26, 1119 (1962); Bull.Acad.Sci.USSR, Phys.Ser., 26, 1127 (1963).
[13] G. M. Sun, S. H. Byun, H. D. Choi, Jour. of Rad. and Nucl. Chem., 256, 3 (2003).
[14] S. F. Mughabghab, Atlas of Neutrons resonance parameters and thermal cross sections Z=1-100, Nationa Data Center Brookhaen National Laboratory Upton, (Elsivier, 2006).
[16] M. Bruet et al., Analytical out-of-pile experiments on gadolinia bearing fuels, in Proceedings of the Four European Conference ENC 86, Geneva, 1986.
[17] D. Bernard, A. Santamarina, Ann. of Nucl. Eng., 87, 1 (2016).
[18] F. Jatuff, G. Perret, M. Murphy, P. Grimm, R. Seiler, R. Chawla, Impact of newly-measured gadolinium cross sections on BWR fuel rod reaction rate distribution, in Proceedings of International Conference on the Physics of Reactors, Casino-Kursaal Conference Center, Interlaken, Switzerland, 2008.
[19] G. Perret, M.F. Murphy, and F. Jatuff, Nucl. Sci. and Eng., 163, 1 (2009).
[20] J-Ch Sublet, et al., Nuclear Energy Agency Document No. JEF/DOC-1210, 2007. [21] J.C. Chow, F.P. Adams, et al., CNL Nuclear Review, 1, 1 (2012).
[22] Gabriel Cacuci, in Energy Technology, edited by Cacuci Dan Gabriel. (Springer, 2010). [23] L. Mercatali, K. Ivanov, V. H. Sanchez, Science and Tech. of Nucl. Install., vol. 2013, Article
ID 573697, 2013.
[24] A. Guglielmelli, Master thesis in Design and Management of Advanced Nuclear System, Italian National Agency for New Technologies, Energy and Sustainable Economic Development (ENEA) and University of Bologna (UNIBO), 2009.
[25] B.T. Rearden and M.A. Jessee, Eds., SCALE Code System, ORNL/TM-2005/39, Version 6.2, Oak Ridge National Laboratory, Oak Ridge, Tennessee, 2016.
[26] B. T. Rearden, L. M. Petrie, M. A. Jessee, and M. L. Williams, SAMS: Sensitivity Analysis Module for SCALE, ORNL/TM-2005/39, 2011.
[27] M. L. Williams, B. T. Rearden, “SCALE-6 Sensitivity/Uncertainty Methods and Covariance Data”, Nuclear Science and Technology Division, Oak Ridge National Laboratory, Oak Ridge, TN 37831, USA.
[28] U.S. EPR Final Safety Analysis Report, Cap. 4.3 – Nuclear Design.
[29] U.K. EPR Pre-Construction Safety Report (PCSR), Cap. 4 - Reactor and Core Design, Subchapter 4.3 Nuclear Design.
[30] S. Lo Meo, C. Massimi, et al., Measurement of the neutron capture cross section for 155Gd and
157
Gd for Nuclear Technology, European Organization For Nuclear Research (CERN), Proposal to the ISOLDE and Neutron Time-of-Flight Committee, 2015.
PART TWO
EMPIRE [1] is a nuclear reaction code, comprising various nuclear models, designed for calculations over a broad range of energies and incident particles. The system can be used for theoretical investigations of nuclear reactions as well as for nuclear data evaluation work. Photons, nucleons, deuterons, tritons, 3He, alphas, and light or heavy ions can be selected as projectiles. The energy range starts just above the resonance region in the case of a neutron projectile, and extends up to few hundred MeV for heavy ion induced reactions. The first version of EMPIRE code was released in 1980 and now the current version, EMPIRE-3.2, is named “Malta”. EMPIRE makes use of several codes, written by different authors, which were converted into subroutines and adapted for the present use. In most cases, the modifications concerned input/output interface and never affected the physical model contained in the original source. Some different codes are incorporated in the present version of EMPIRE, furthermore, the package includes stand-alone codes and utilities. Evaluation of nuclear data has been a major driving force in evolution of the EMPIRE code. EMPIRE-2.19 was extensively used in the development of the ENDF/B-VII.0 library for which it produced 78 full evaluations (nearly 20% of the whole neutron sub-library). This major exercise was also a most thorough test and validation of the system. EMPIRE can be executed either with the included Graphical User Interface (GUI), or from the command-line using scripts. We start by describing the GUI mode of EMPIRE, that is the way used for this preparatory work on the use of EMPIRE.
EMPIRE can be freely downloaded [1] and easily installed for Linux/Unix, OSX and Windows platforms. In the latter case EMPIRE can be downloaded from [2]. During installation on Windows, the C:/Empire322zv2win is created and a “work” directory (for example: C:/wrk) where all files produce by EMPIRE’s calculations will be stored.
This short summary describes the use of the EMPIRE installed in a PC running Windows 10 as Operating System (OS). The GUI mode is the most convenient way of running EMPIRE. The sketch of the GUI is described in the Figure 1.
Figure 1: GUI of EMPIRE nuclear code
The “Main 1” panel provides for essential control of calculations. It allows to create a new input file by clicking on the “Create" button. This action copies the standard (default) input file and opens it for editing and selecting parts of the system: physics calculations, formatting, verification, preprocessing and plotting. “Main1” panel gives also access to output/input files produced by
EMPIRE in the first run. “Main 2” panel provides additional four features not includedin the “Main1” panel. These features were not used for this preliminary study.
EMPIRE is set up to read as much data as possible from the RIPL input directory empire/RIPL/ [3] and the local input parameter library (empire/data). The user has to supply only those input parameters that the code can’t know. These are the incident energy, the projectile, the target and the number of emitted particles to be followed. With the default library of input parameters it is possible to execute a “first-shot” calculation with minimal effort. In the second step, the user may wish to regain control over the input in order to make appropriate adjustments to the parameters. This can be done in a selective way in the optional part of the EMPIRE input, or directly in local project files produced by EMPIRE during its first run. It should be noted that there is a difference in the way EMPIRE accesses general input library in the first and subsequent runs of a given project. Input to EMPIRE consists of two parts. The first is mandatory and contains basic data necessary to specify the case, and the structure is illustrated by the following lines:
14.8 ;INCIDENT ENERGY (IN LAB) 157 64 ;TARGET A , Z
1 0 ;PROJECTILE A, Z
2 ;NUMBER OF NEUTRONS TO BE EMITTED 1 ;NUMBER OF PROTONS TO BE EMITTED 1 ;NUMBER OF ALPHAS TO BE EMITTED 1 ;NUMBER OF DEUTERONS TO BE EMITTED 0 ;NUMBER OF TRITONS TO BE EMITTED
0 ;NUMBER OF HELIONS (3He) TO BE EMITTED
0 0. 0. ;NUMBER OF L.I. TO BE EMITTED, AND ITS A AND Z
The first line specifies the incident energy (MeV) in the laboratory system. The second and third are used to specify the mass and atomic numbers of a target and a projectile respectively. The next seven lines define the number of emissions to be followed for each particle. The code automatically sums over all possible decay sequences to reach the given residual nucleus.
The mandatory input is followed by optional input, which allows modifications to the default model parameters. Optional input consists of an arbitrary number of records, entered in any order and closed with the GO record, which indicates the end of the input. In the simplest case (all defaults), only the GO record must be entered. If the first character of the line is *, # or !, then this line contains comments and is ignored by the code. If the first character of the line is @, then this line contains a title, which will be printed in EMPIRE outputs; obviously the title is not used in any calculations. Multiple titles are allowed.
The general structure of the output (.OUT) can be summarized as follows (depending on input options some items might be missing in an output):
Code banner Optional input
Matrix of models usage 1st incident energy Compound Nucleus
Input parameters
Elastic, reaction and total cross sections Inelastic scattering to collective levels Pre-equilibrium models' results Fusion cross section
Population and decay of discrete levels Residue production cross section Fission cross section
Emission spectra 1st residue Model parameters
Discrete level population before their -de-excitation Population and decay of discrete levels in
Residue production cross section Fission cross section
Emission spectra 2nd residue . . .
last residue . . .
inclusive emission spectra …
2nd incident energy …
and so on.
This EMPIRE output is used by EMPEND Module [1] for creating the ENDF-6 formatted file, that is the main goal of this study.
Optional input allows modifications to the default model parameters and consists of an arbitrary number of records, entered in any order and closed with the GO record, which indicates the end of the input. The GO record indicates the end of the optional input and starts calculations. It may be followed by an unlimited list of incident energies (and titles or comments) (one per record) terminated with a record containing a negative value (for example: -1). Anything below this line will be ignored by the code.
In this preliminary study, we focused on 157Gd Evaluation, trying to reproduce ENDFB-6 data. The optional lines of input file used for the 157Gd evaluation test are illustrated by the following lines:
@ TITLE: Test Evaluation Gd-157 IOUT 3.
NEX 080. !Number of points in the outgoing energy grid ENDF 2. !ENDF formatting
FITLEV 0. !FITLEV>0 is recommended for 1st run to compare vs NLD exp.data LEVDEN 0. !EMPIRE NLD (EGSM RIPL-3) as default
HRTW 3. !Width fluctuations considered up to 3 MeV (for neutron induced) GSTRFN 1. !Default gamma ray strength function (Plujko MLO RIPL-2) OMPOT -581. 1 !OMP for the inverse neutron channel (see below)
OMPOT -5405. 2 !OMP for the inverse proton channel - Koning & Delaroche OMPOT -9600. 3 !OMP for the inverse alpha channel - Avrigeanu et al MSD 0. !Quantum statistical Multi-Step-Direct model
MSC 0. !Quantum statistical Multi-Step-Compound model PCROSS 1.5 !Exciton model with default 1.5 MFP parameter HMS 0. !Monte Carlo Hybrid (DDHMS) pre-equilibrium model GO ! Starting Calculations
@ List of Energies (MeV) 0.002 0.005 0.007 0.01 0.02 0.05 0.07 0.1 0.2 0.3 0.4 0.5 0.7 0.85 1. 1.3 1.5 1.8 2. 2.25 2.5 2.75 3. 3.2 3.4 3.6 3.8 4. 4.2 4.4 4.6 4.8 5. 5.5 6. 7.
8. 9. 10. 11. 12. 13. 14. 15. 16. 17. 18. 19. 20. -1. ! close
* END of INPUT FILE
All the parameters, used in the input file above are taken from a “typical” default input provided by EMPIRE. Only the choice of OMP 581 (above and below highlighted in yellow) for neutrons came from https://www-nds.iaea.org/RIPL-3/. By this URL, selecting the OPTICAL MODEL (OM) panel and inserting the values of A = 157 and Z = 64 for 157Gd, we obtained:
--- Lib. Inc. Model Disp Rel Z-Range A-Range E-Range Ref. No. Part. Type Pot Pot [MeV] No. --- 100 n spher. no no 20 - 92 40 - 238 10.0 - 50.0 14 101 n spher. no no 12 - 83 24 - 209 11.0 - 11.0 15 116 n spher. no no 20 - 83 40 - 209 0.0 - 5.0 18 222 n spher. no no 64 - 64 133 - 171 0.0 - 20.0 30 401 n spher. no no 20 - 92 40 - 238 0.0 - 25.0 35 430 n spher. no no 13 - 82 27 - 208 0.1 - 24.0 47 581 n spher. no no 64 - 64 157 - 157 0.1 - 20.0 58 800 n spher. no no 20 - 83 40 - 210 0.0 - 155.0 69 2001 n spher. no yes 6 - 82 12 - 208 50.0 - 400.0 76 2100 n spher. no no 20 - 83 40 - 209 10.0 - 26.0 86 2101 n spher. no no 26 - 82 54 - 208 10.0 - 80.0 87 2405 n spher. no yes 13 - 83 27 - 209 0.0 - 200.0 93 2407 n spher. yes yes 27 - 83 59 - 209 0.0 - 200.0 71 2410 n spher. yes yes 13 - 83 27 - 209 0.0 - 200.0 95 2411 n spher. yes yes 13 - 83 27 - 209 0.0 - 200.0 95 2700 n spher. no no 20 - 83 40 - 210 0.0 - 155.0 98
The free version of EMPIRE does not contain the resonance module that retrieves data from the electronic version of the Atlas of Neutron Resonances by Mughabghab [4] needed to produce resonance section and related co-variances for the ENDF-6 formatted files. However, even if there are not Digital Atlas data, it is possible to enter “manually” the resonance parameters in the final .endf file. We need to copy C:\Empire322zv2win\EMPIRE-3.2.2\data\resonances.endf in the directory C:/wrk, (where the gd157.inp is present) and rename it as resonances-res.endf and starting calculation with EMPIRE. The module ENDRES [1] of the EMPIRE Calculation will properly insert the resonance parameters into the ENDF-6 file.
To start EMPIRE, in the “Main 1” (see Figure 1) panel of the GUI we selected all options (EMPIRE, Formatting, Verification, Plotting, Adding Resonances), we wrote “6440” (157
Gd, see ENDF Manual [5]) as MAT and then it was possible to “Run Selected”.
After EMPIRE calculation was ended, the final gd157.endf file has to be processed, for example by, by PREPRO2015 [6], to assess its content. PREPRO must be previously downloaded in a given directory (for example C:\PREPRO2015). This directory contains some executable files, called in sequence by a properly prepared batch file of Windows (VERIFY.BAT) written as follow:
endf2c linear recent sigma1 activate legend fixup dictin groupie mixer virgin evalplot complot
These are different modules of the PREPRO2015 program. VERIFY.BAT must be executed as “administrator”. Before running VERIFY.BAT, it is necessary to rename gd157.end as ENDFB.IN, as required by the input structure of the endf2c module. For our preliminary studies, the file SIGMA1.OUT is all we need.
The final ENDF-6 (SIGMA1.OUT) file was successfully processed, at least formally, by the NJOY[7] processing system through the following modules: MODER, RECONR, BROADR, HEATR, THERMR, PURR, GASPR, GROUPR, ACER. Both a file in ACE format (through ACER module) for the MCNP code and a file in GENDF format (through GROUPR module) for deterministic codes were produced.
Once we have verified that EMPIRE produce suitable files for NJOY, we need to check total, elastic, inelastic, capture and (n, 2n) cross sections in order to assess the evaluation. We used a Java-based Nuclear Data Information System (JANIS 4), free downloaded from http://www.oecd-nea.org/janis/, to perform cross checks among different types of data. In subsequent figures the results of the comparison, between our SIGMA1.OUT and EXFOR and Evaluation Data, by using JANIS4 System.
Figure 2: Total Cross Section of 157Gd: Test Evaluation (red line) vs EXFOR Data and ENDF Evaluation (green line)
Figure 3: “Zoom view” of Total Cross Section of 157Gd: Test Evaluation (red line) vs EXFOR Data and ENDF Evaluation (green line)
Figures 2 and 3 show a good agreement between our test-evaluation and other data that permits to conclude that the choice of OM seems to be reasonable. But OM = 581 is only the main choice for our test-evaluation, but it is not the unique choice to be done for a complete evaluation. The following figures show elastic, inelastic, capture and (n,2n) cross sections and it is evident that
many other physical parameters, in the EMPIRE code, have to be better tuned. This will be the future job/study for the next months.
Figure 4: Elastic Cross Section of 157Gd: Test Evaluation (red line) vs ENDF Evaluation (green line)
Figure 6: “Zoom View” Capture Cross Section of 157Gd: Test Evaluation (red line) vs EXFOR Data and ENDF Evaluation (green line)
Figure 8: (n, 2n) Cross Section of 157Gd: Test Evaluation (red line) vs EXFOR Data and ENDF Evaluation (green line)
References to Part Two
[1] http://www.nndc.bnl.gov/empire/
[2] https://www-nds.iaea.org/index-meeting-crp/EmpireWorkshop2013/downloadEmpire322win.htm
[3] IAEA-CRP, Reference Input Parameter Library (RIPL), IAEA-TECDOC-1034, Vienna (1998),
http://www-nds.iaea.org/ripl/
[4] S. F. Mughabghab, Atlas of Neutron Resonances: Thermal Cross Sections and Resonance Parameters (Elsevier, Amsterdam, 2006).
[5] https://www.oecd-nea.org/dbdata/data/manual-endf/endf102.pdf
[6] https://www-nds.iaea.org/public/endf/prepro/
[7] R.E MacFarlene, D. W. Muir, R.M. Boicourt, A. C. Kahler, “The NJOY Nuclear Data Processing System”, Version 2012, LA-UR-12-27079 Rev, Updated for NJOY2012.50, February 12, 2015