Simone Pasinetti , M. Muneeb Hassan, Jörg Eberhardt, Matteo Lancini, Franco Docchio, and Giovanna Sansoni
Abstract— The PMD Camboard Picoflexx Time-of-Flight (ToF)
camera is evaluated against the Microsoft Kinect V2 to assess its performance in the context of markerless motion capture system for human body kinematics measurements. Various error sources such as the warm-up time, the depth distortion, the amplitude related error, the signal-to-noise ratio, and limitations such as their dependence on the illumination pattern and on the target distance, are studied and compared. The Picoflexx device is also compared to the Kinect V2 in relation to the quality of shape reconstructions, to assess its adequateness in modeling human body segments, and human body kinematics measure-ments. The final result of this paper is definitely useful to the research community, demonstrating that, even if the Picoflexx performs lower than the Kinect concerning the measurement performances, its behavior in estimating the volume of the body segments, the angles at the joints for human body kinematics, and the angle at the ankle in assisted walking applications is definitely satisfactory. These results are extremely significant to obtain accurate estimates of the parameters of the human body models in markerless motion capture applications, especially in laboratory-free environments, where compactness, lightweight, wireless connection, and low-power consumption are of outmost importance.
Index Terms— 3-D shape measurement, error analysis, kinematics, sensor phenomena and characterization, time-of-flight (ToF) cameras.
I. INTRODUCTION
D
UE to recent advances in medicine, life expectancy has dramatically increased and the number of elderly people (aged 60 and above) is expected to rise at a rate of 3% per year [1]. This demographic change has its inherent obstacles and poses a challenge on our society as more high-quality long-term care facilities and 50%–150% more geriatric nurses are needed in the coming future [2]. In addition to this, geriatric nurses commonly suffer from physical stressManuscript received May 25, 2018; revised October 10, 2018; accepted December 03, 2018. This work was supported in part by the German Federal Ministry of Education and Research (BMBF) under Project Virtueller ERgonomieTRainer in der pflegeAusbildunG (ERTRAG). The Associate Editor coordinating the review process for this paper was Eduardo Cabal-Yepez. (Corresponding author: Simone Pasinetti.)
S. Pasinetti, M. Lancini, F. Docchio, and G. Sansoni are with the Department of Mechanical and Industrial Engineering, University of Brescia, 25121 Brescia, Italy (e-mail: [email protected]).
M. M. Hassan and J. Eberhardt are with the Department of Technology and Management, University of Applied Sciences Ravensburg-Weingarten, 88250 Weingarten, Germany.
Color versions of one or more of the figures in this paper are available online at http://ieeexplore.ieee.org.
Digital Object Identifier 10.1109/TIM.2018.2889233
due to heavy lifting and incorrect ergonomics resulting in musculoskeletal disorders such as lower back pain [3]. These can be minimized early in the training phase of the caregivers by monitoring ergonomics and giving feedback to trainees on their performance. This entails a need for a system, which is readily available, works in real time and is inexpensive.
The research project Virtueller ERgonomieTRainer in der pflegeAusbildunG (ERTRAG) intends to fill this gap by pro-viding faster, more efficient means of training future care-takers. The project is funded by the German Ministry of Education and Research and is supported by a consortium of research institutes and industrial partners, working to develop a virtual trainer able to teach ergonomics to health care students, monitor their performance during training, and give them feedback [4].
In designing such a system, one of the core tasks is to implement human motion and skeleton tracking. The system has to be markerless to avoid any preparation such as wearing a special suit with external markers, which could hinder natural movements of the trainee. The system is intended to be used in schools which do not necessarily have controlled dedicated lab spaces, while relying on inexpensive consumer-grade hardware.
3-D acquisition of the human body is the first step of a very complex elaboration chain, which should lead to mapping 3-D point clouds to virtual skeleton models immediately visible to the trainee. The acquisition task should be per-formed in real time, providing multiview point cloud capturing and registering; in addition, it should be implemented using eye-safe, low-power, and compact devices. Medium-low measurement accuracies are required in a depth range of 1.7–3.5 m.
Depth image sensors have been the subjects of research for decades with various techniques having been introduced [5]. Among these, triangulation-based systems, either based on active or passive illumination, using coherent or incoherent light have been proposed and are now market available: they outperform other 3-D sensors for their measurement resolutions and accuracies in depth ranges from a few tens of microns to 500 mm and are successfully used in many applications, ranging from industrial quality control and reverse engineering to robotics and medicine. However, they often are inadequate when high frame rates, low cost, low weight, and low power consumption combinations are required.
0018-9456 © 2019 IEEE. Personal use is permitted, but republication/redistribution requires IEEE permission. See http://www.ieee.org/publications_standards/publications/rights/index.html for more information.
Time-of-Flight (ToF) cameras represent an efficient alter-native, as they provide depth images at high frame rates in a rugged package [6], [7]. Initially, ToF cameras were, mainly, targeted at the automotive industry [8]. In the past two decades, the continuous improvement in the microelectronics, microoptics and microtechnology has led to the deployment of ToF cameras at increased resolutions, accuracies and frame rates, and simultaneous depth-intensity registration at each pixel. ToF cameras were mostly developed for applications requiring medium-low measurement accuracies overextended measurement ranges (from 1 to 5 m), high robustness to ambient light and simple computation in a compact design, with no moving parts. Among the commercially available ToF devices, those deployed on the market by 2011 by Mesa Imaging AG, Canesta Vision, Ifm electronic, and PMD Technologies GmbH have been extensively character-ized, with the aim of analyzing and compensating for the observed error sources [9]–[12] and in view of understand-ing their usability in computer graphics and virtual reality applications [13].
In the past years, this technology has been introduced to the consumer market at affordable prices, mainly for domestic gaming, hand gesture, and virtual reality applications: exam-ples of these devices are the Senz3-D (Creative), the Argos P100 (Blutechnix Inc.), the E70 (Fotonic), the Camboard Nano (PMD Technologies GmbH), and the Kinect V2 (Microsoft Corporation). A comprehensive overview of such devices is reported in publication [14] also in comparison with those mentioned earlier. The Kinect V2 is the most extensively used device, for its unique depth resolution, accuracy, and low cost, combined with the availability of extensive software and documentation for human body skeleton markerless retrieval from 3-D point clouds, in part inherited by its predecessor, the Kinect V1 [15]. As a result, researchers have explored its potential application in a huge number of fields. Among them, body-capture methods for kinematics and motion analysis [16], for multimedia applications [17], mobile robotics [18], and for gesture recognition [19] have been studied. Inarguably, the Kinect is the forerunner in commercially available hard-ware upon which technologically advanced methods of people care can be developed while maintaining affordability for large-scale disbursement. Elderly care and disease rehabilita-tion, often in the form of serious and exercise games [20], [21], represent two main areas where the Kinect is used both for clinical assessment and remote control and tracking. Previous studies have validated the Kinect for postural analysis [22]: the device accuracy of kinematics measurements, such as joint angles, reaching distance, and gait parameters, has been measured and compared to photogrammetric marker-based systems, which are the state of the art among 3-D motion capture systems [23], [24].
From a careful review of the literature of human motion capture, the authors have realized that the Kinect is still the sensor almost exclusively used for markerless human capture. As reported in [25] and [26], published in 2017 and 2018, respectively, the Kinect V2 has almost completely replaced any other 3-D sensor in markerless human motion capture systems. As such, the Kinect V2 was thought a good candidate
for implementing human motion and skeleton tracking in the ERTRAG Project.
However, Microsoft has announced that the Kinect will go out of production by the end of 2018: the technology will be not abandoned, but it will be probably further developed toward the game market. This certainly will pose a question to the numerous communities of researchers developing motion capture systems, who will have to look for sensors presenting performances that make it reasonable to use them as the 3-D raw data source in their motion capture systems.
In addition, a lot of effort is being made to develop small, mobile, and wireless solutions for markerless human motion capture, in cases, when a laboratory-free measurement setup is needed (see, for example, the use of inertial motion sensing technology for upper limb motion modeling in [27]). A very interesting example deals with the assisted gait of exoskeleton users, where the use of crutches is mandatory to allow the user to walk [28]. Sardini et al. [29] and Lancini et al. [30] present an extensive report of the research carried out by some of the authors to instrument the crutches for force measurement during the gait. The idea is to use the captured signals to feed the biomechanical model (OpenSim in that case) to estimate the internal forces at the upper limbs. This approach could be further improved by equipping the crutches with a small, compact, and wireless device for the 3-D capturing of the movement of the feet during the gait, for evaluating the parameters of the gait (stance, cadence, toe-off, and toe-on) and for correlating them to the upper limbs forces estimated by the biomechanical model. This is actually a hot topic in assisted walking, and the authors are working on it.
The Kinect V2 is not suitable for such applications due to its wired power supply and to its dimension. In contrast, a compact device, not requiring an external power supply, controllable using a smartphone, showing reduced dimension and low weight, is definitely a better candidate, opening the door to a plethora of new applications.
In 2015, PMD Technologies released the Camboard Picoflexx device, a 224× 171 pixels ToF camera, operating in the depth range 10–400 cm, with measuring performances worse with respect to the Kinect V2, but showing an extremely low form factor and low weight. Moreover, the company announced further optimization in terms of resolution, cost, and design, for integration into smartphones [31]. All this considered, we thought that this device could be an interesting alternative to the Kinect V2, both for the ERTRAG application and for markerless human body applications in laboratory-free environments, like the one based on the instrumented crutches in assistive walking mentioned earlier.
However, to the best of our knowledge, no extensive char-acterization of the Picoflexx was available in the scientific literature and, hence, we decided to assess the measurement characterization of this new device. To perform this paper, we took inspiration from the works presented in [9], [14], and [32]–[34], which deeply analyze the Kinect V2, also in comparison with its predecessor, the Kinect V1. Being so extensively studied, the Kinect V2 was chosen as the “gold standard” for characterizing the Picoflexx camera. The characterization has been carried out in relation to temperature
against the interference from external infrared light sources; the third test was finalized to analyze the performance of the Picoflexx to measure human body kinematics. In this case, a triangulation-based system with an accuracy better one magnitude order than the ToF cameras was used as the measurement reference, and both the Kinect V2 and the Picoflexx have been compared against this device. The fourth experiment focused on assessing the feasibility of assembling the Picoflexx on the crutches, and of using it to acquire the point cloud of the feet during walking, for estimating the angle at the ankle and the detection of the contact between the feet and the ground.
The final result of the study presented in this paper will demonstrate that, even if the Picoflexx performs lower than the Kinect in terms of resolution and measurement uncertainty, its behavior in estimating the volume of the body segments, the angles at the joints, and the angle at the ankle is definitely satisfactory in view of obtaining accurate estimates of the parameters of the human body models for the mentioned applications.
II. LAYOUT OF THEEXPERIMENTS
The Picoflexx and the Microsoft Kinect V2 devices are both lock-in ToF cameras, where a near-infrared periodic wave is emitted by the system and reflected back to the sensor. The ToF measurement is carried out using continuous-wave mod-ulation, based on phase shifting principle [35].
PMD Technologies released the Camboard Picoflexx in May 2015. This is one of the first consumer ToF cameras, which is specifically designed for integration into mobile devices. The camera does not contain any other sensor than the depth sensor, which makes it small and lightweight. The resolution of the depth camera is 224 × 171 pixels and the range is 10–400 cm with a field of view of 62°× 45°. The frame rate can be selected by the user from 5 to 45 fps, and the exposure time adjusts accordingly. Higher frame rate results in a decrease in range due to lower exposure time. The Picoflexx has a USB 2.0/3.0 interface and does not require any extra power supply.
Microsoft released the Kinect sensor V2 in 2013. The sensor incorporates an RGB camera with a resolution of 1920×1080 pixels and depth sensor with 512× 424 pixels with a range of 5–450 cm and 70°× 60° field of view. It also has an array of four microphones included to record audio signals and to detect location of the source. With all these different modules integrated in a single package, the Kinect V2 is quite bulky [18]. The sensor provides a frame rate of 15–30 fps and adjusts the exposure time automatically. This, as to the best of our knowledge, is not controllable by the user. Due to the high amount of data sent by the sensor, it requires a dedicated USB 3.0 bus and external 24-V power.
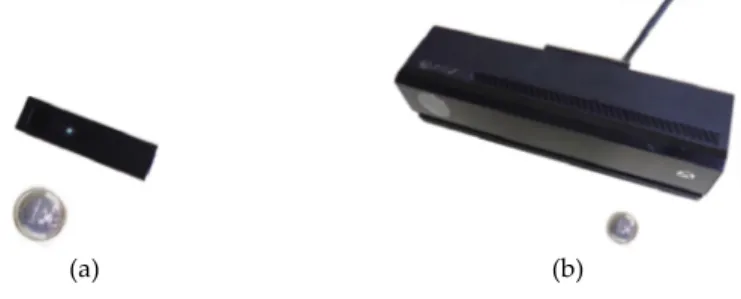
Fig. 1. (a) Camboard Picoflexx. (b) Microsoft Kinect V2.
TABLE I
MAINSPECIFICATION OFPICOFLEXX ANDKINECTV2
Fig. 1 shows the picture of the two cameras. Their specifi-cations in terms of compactness, power consumption, weight, and cost are listed in Table I.
In the past years, multiple publications on the character-ization of ToF cameras have been presented. Various error sources have been classified and studied based on their nature (systematic or nonsystematic) [9], or, alternatively, as errors showing dependence on the camera model and not on the scene [14]. In [34], a metrological characterization based on the Guide to the expression of uncertainty in measurement [36] is presented for the uncertainty analysis of the 3-D scene reconstruction.
In our work, we set the focus on the assessment of the performances of the Picoflexx with respect to the Kinect V2 in relation to the following error sources among those reported in the literature.
1) Temperature Related Errors (Systematic Source, Device
Dependent): Temperature has a significant influence on
ToF cameras due to the temperature dependence of the semiconductor technology they rely on. At switch on, the ToF sensors start to heat up and a drift is observed in the depth measurements [10]. This explains why many devices include an internal fan, which stabilizes the tem-perature and reduces the drift in-depth readings. Studies suggest to wait a certain amount of time to let the sensor warm-up before using it [11], [12], [14]. The Picoflexx does not have active cooling and relies on convection to dissipate heat, while the Kinect V2 compensates for the temperature drift by means of active cooling. The purpose of the test was to investigate the length of the warm-up period in the two cameras. The results are presented in Section IV.
2) Depth Distortion (Systematic Source, Device Dependent): Depth distortion (also known as wiggling
or circular error) is a consequence of the fact that the emitted light is not generated, in practice, as
theoretically planned (either sinusoidal or not) due to errors in the modulation process [14]. As a consequence, an offset is produced which depends only on the measured depth at each pixel. In our tests, we addressed this error by comparing the depth measurements from the two cameras with a reference ground truth distance. To this aim, we used an additional sensor (a Bosch GLM 30 laser range finder, at ±2-mm accuracy). 3) Amplitude-Related Error (Systematic Source, Device
Dependent): Depth accuracy is highly related to the
amount of light that impinges on a pixel [9]. Both low and overexposed reflected amplitudes result into depth errors: the intensity of illumination is the highest in the center of the image and weakens toward the borders. This leads to overestimating depth at the edges; conversely, if the intensity is too high, e.g., when the object is too close, it results in saturation of the pixel and invalid measurements. In our study, we wanted to assess the influence of this error source on the overall measurement accuracy of the two cameras.
4) Temporal Error (Nonsystematic Error, Device Dependent): Temporal error represents the variation
in depth of a static pixel (measurement noise) caused by nonuniformities in illumination of the scene. Low illuminated areas are more susceptible to noise than higher illuminated ones; in addition, this error source depends on the depth uniformity of the scene and on the integration time.
Error sources from 2 to 4 are all depth errors. Other depth errors like those related to fixed pattern noise and internal light scattering have not specifically been evaluated. Instead, the depth measurement uncertainty of the two cameras was evaluated, following the GUM-based approach as in [34]. In this paper, depth-related errors are presented in Section V. In addition to measurement uncertainty analysis, three other experiments have been performed: the first test focused on comparing the performance of the Picoflexx with respect to the Kinect V2 in the 3-D reconstruction of a cylindrical target placed at different positions in the working volume. This activity was finalized to assess the capability of the former camera to provide reliable modeling of body segments (which can be approximated by cylindrical shapes) despite the lower measurement resolution with respect to the Kinect. The second test aimed at comparing the performance of the Picoflexx to the Kinect when simultaneous acquisition from multiple ToF cameras is required, to avoid occlusions [16]. This paper was necessary to evaluate the influence of the interference of multiple light reflections captured at each receptor pixel on the depth measurement, in view of using the Picoflexx in a multiview acquisition setup. The third test focused on the performance of the Picoflexx in human body kinematic measurements. Both cameras were used to acquire differ-ent human postures and the angles between body segmdiffer-ents were computed and compared. The measured kinematics was compared to the one obtained using a triangulation-based range camera, characterized by a measurement accuracy one magnitude order better than the ToF cameras. This experiment investigated the suitability of the Picoflexx for segmentation
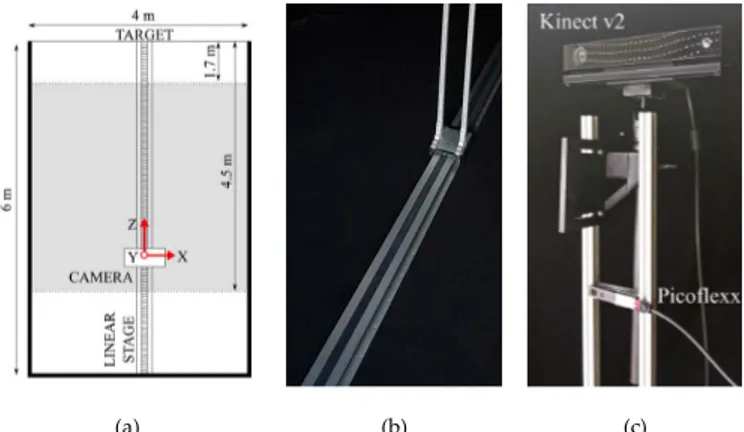
Fig. 2. Experimental setup. (a) Schematic of the dark room. (b) Linear stage. (c) Mounting of the Picoflexx and of the Kinect V2.
and measurement of the human body. The results are presented in Sections VI–VIII, respectively.
III. EXPERIMENTALSETUP
The experimental setup is shown in Fig. 2. According to the setup used in the study reported in [14], all experiments were conducted in a confined space (4 m× 6 m × 2 m in our case), completely covered in Duvetyne fabric (referred to as the “dark room”) except for one side, which is used as a target in the temperature and depth-related errors experiments. The sides covered by the Duvetyne are shown as bold lines in Fig. 2(a). This fabric was chosen as it absorbs any incident ambient light or infrared, reducing errors in depth measure-ment which may occur due to reflection. A motorized linear stage with ±0.02-mm accuracy was used for actuation of the cameras along the Z -axis (depth), in a 1.7–4.5 m range, shown by the shaded region in Fig. 2(a). This is the operating range for each experiment. The cameras were mounted on a support moving on the linear stage at a height of 1.5 m from the floor. The linear stage and the camera mounting are shown in Fig. 2(b) and (c), respectively.
A laser range finder with a ±2-mm accuracy (Bosch GLM 30) was used to provide nominal depths Dn along the
Z direction. The measured depth values Dm were expressed with respect to the sensor plane of the two cameras. This was performed by carefully positioning the range finder at the outer surface of each camera, and by ensuring that it was oriented perpendicularly to the target. By comparing the depth measured by the Picoflexx and by the Kinect at a certain nominal position to those measured by the range finder, it was possible to compensate for the displacements between the outer case border and the inner sensor planes in the two cameras.
Data acquisition and elaboration were carried out using the official software development kits of the two cameras and the MATLAB framework, running on a dedicated PC (Lenovo E560, Intel core i7, 8-GB RAM). The cameras were switched on for at least 1 h, prior to each experiment, except for the evaluation of the temperature-related errors.
IV. TEMPERATURERELATEDERRORS
In order to evaluate errors in depth measurement over time, the distance of the camera from the target was kept constant.
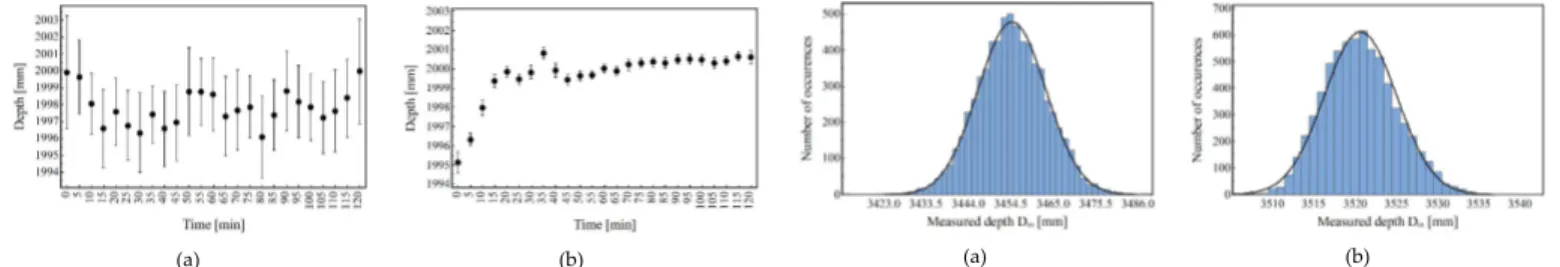
Fig. 3. Temperature related errors for (a) Picoflexx and (b) Kinect V2.
This was chosen to be 2 m, at half of the operating range of the cameras. Prior to the experiment, the cameras were turned off for at least 4 h, so they were completely cooled down. Both cameras were run at 30 fps. A single depth frame was recorded for 2 h at 10-s intervals. A region of interest composed of 15 × 15 pixels around the central pixel of each acquired frame was extracted. Then, the frames acquired in each 5-min interval were grouped together and means and stan-dard deviations of depths belonging to each group were computed.
Fig. 3 (a) and (b) plots the results as a function of time for the Picoflexx and the Kinect, respectively. The former plot shows the average values distributed around the nominal value of 2 m during the whole acquisition time. Standard deviations have a maximum value of 3.37 mm. In contrast, the latter presents a transient trend. In the first 20 min, average depths increase toward the nominal value of 2 m: during this time period, the sensor warms up, since the internal active cooling is switched off. Then, the active cooling turns on: from 20 to 40 min, the averaged depths exhibit a settling behavior and oscillate around 2 m. After 40 min, the sensor is warmed up and the measurements stabilize at the nominal value. The maximum value of standard deviations is 1.11 mm. This behavior has already been observed in [24] and, when compared to the one shown by the Picoflexx, it highlights that, in terms of warmup time, this last device shows better performance because it does not require any waiting time before performing data acquisition. After the warm-up phase, the Kinect yields better and more accurate results: hence, in cases, where immediate use of the devices is not required the Kinect should perform better.
V. DEPTHMEASUREMENTERRORS
In this set of experiments, the cameras were moved on the linear stage in the operating range for our application, at steps of 0.2 m, resulting in 15 nominal positions Dn.
At each nominal position Dn, 30 frames were acquired. Before analyzing each error source, a preliminary evaluation of the histograms of depths Dm, measured on a 15× 15 pixels neighborhood of the central pixel of each frame, was performed. An example is presented in Fig. 4, which plots the distribution of values Dm, captured at nominal distance
Dn = 3.455 m and Dn = 3.420 m for the Picoflexx and the Kinect, respectively. These histograms show that values
Dm are normally distributed: this observation allowed us to evaluate depth measurement errors by considering average values and standard deviations of measured depths Dm.
Fig. 4. Histograms of measured depth Dm, obtained with (a) Picoflexx and
(b) Kinect.
Fig. 5. Depth distortionεwfor (a) Picoflexx and (b) Kinect V2.
Fig. 6. Amplitude images acquired with (a) Picoflexx and (b) Kinect V2.
A. Depth Distortion
The depth distortion was computed by calculating the dif-ference εw between the average value μm over depths Dm, measured at the central pixel of each frame, and the corre-sponding nominal value Dn. The results for both cameras are shown in Fig. 5. In the Picoflexx, valuesεwspan a range from
−4.54 to 1.98 mm at nominal distances lower than 3.5 m, and
decrease to −12.15 mm at Dn = 4.5 m. In the Kinect V2, values εw span the range from−3.07 to 7.4 mm at nominal distances lower than 3.5 m and the range from −11.63 to 10.5 mm at higher nominal distances. The Kinect V2 curve presents the characteristic wiggling behavior with a sinusoidal shape as observed in other studies [14], [34]. It is worth noting that this shape is absent in the case of Picoflexx and that the error contribution is reduced by 40% with respect to the Kinect.
B. Amplitude-Related Error
Fig. 6 shows the amplitude images captured for the two cameras at Dn = 1.7 m. These images simply record the intensity of light reflected from the surface at each pixel in an 8-bit-gray levels range. From Fig. 6, it can be observed that the intensity of captured light decreases for increasing distances from the image center. In the Picoflexx, the image borders and the corners are very dark, which means that the signal is weak or absent at the corresponding pixels, and either
Fig. 7. Color maps of errors εA calculated for (a) Picoflexx and
(b) Kinect V2.
the depth is overestimated or it is not measured. In contrast, in the Kinect V2, the light intensity is more homogeneous over the frame, with most of the pixels receiving light.
The amplitude-related error was evaluated over 30 frames acquired at Dn= 1.7 m; at each pixel, the average value μm of measured depths Dm was computed and the difference εA = μm − Dn was used to estimate the contribution of this error source. Fig. 7 shows the resulting values εA at each pixel in a color map representation. In both cameras, the amplitude-related error increases at the image borders: the Picoflexx [Fig. 7(a)] presents an almost uniform distribution of valuesεA over the frame, with most pixels showing errors in the range 0÷ −5 mm; at the image borders the errors decrease up to −10 mm and error information is absent at the corners, consistently with the very low intensity of the captured backlight, already observed in Fig. 6(a). In contrast, the Kinect V2 camera [Fig. 7(b)] is characterized by a high dependence of differences εA on the pixel positions with values in the range 0÷ −5 mm in the central image area and values gradually decreasing to−12 mm at the image borders. The white dotted overlay in Fig. 7(b) frames the spatial field of view acquired by the Picoflexx with respect to the one acquired by the Kinect V2: they are different as a consequence of the different illumination apertures, which are 62°×45° and 70°×60° for the Picoflexx and for the Kinect V2, respectively. Within the framed area, the errors evaluated for the Kinect V2 span the range 0÷ −3.5 mm in the red–orange region, and the range−3.5 ÷ −9 mm in the yellow–turquoise region [the blue areas have not been considered, as they correspond to the corners in Fig. 7(a)]. The comparison of these values to those observed in the Picoflexx allowed us to consider the two devices equivalent in relation to the amplitude related error source, for object points captured in the central region framed in Fig. 7(b).
C. Temporal Error
Temporal errors as a function of depth were evalu-ated by calculating the standard deviation σm over depths
Dm measured at the central pixel of each frame at nominal distances Dn in the range 1.7–4.5 m. The results are shown in Fig. 8, where valuesσm are plotted against the correspond-ing average values μm.
For both cameras, standard deviations σm increase with increasing μm, which is expected, for increasing values Dn. Valuesσm span the range 2.24–13.1 mm for the Picoflexx, and
Fig. 8. Standard deviations σm as a function of average values μm for
(a) Picoflexx and (b) Kinect V2.
Fig. 9. Standard deviationsσmcalculated at each pixel for (a) Picoflexx and
(b) Kinect V2.
the range 1.16–3.8 mm for the Kinect V2. The valuesσm of the Picoflexx are greater with respect to the Kinect: this is by no means surprising, considering the measurement resolution parameter of the two cameras, which is below 1% and 0.5% for the Picoflexx and for the Kinect V2, respectively [25], [34]. The linear regression over values σm results in the dotted lines in the two plots: the regression coefficients R2 equal 88.76% for the Picoflexx and 86.16% for the Kinect V2; when the linear regression is calculated in the range 1.7–3.5 m, coefficients R2 increase to 96.63% and 91.97% for the Picoflexx and the Kinect, respectively. Thus, concerning the linearity behavior, the two cameras are equivalent.
Temporal errors as a function of the pixel positions were also evaluated at each nominal depth. An example is shown in Fig. 9, which presents standard deviations σm calculated at Dn = 1.7 m for the Picoflexx [Fig. 9(a)] and for the Kinect V2 [Fig. 9(b)] as color maps.
Values σm increase with the distance from the center of the maps in both cameras and the Picoflexx shows worse performance with respect to the Kinect, consistently with the lower intensity of the captured light reflected from the target, already observed in Fig. 6. However, there is a wide region (framed by the dotted overlays in the two figures) where the values σm from the Picoflexx and those from the Kinect V2 span the ranges 1–1.6 mm and 1–1.5 mm, respectively. Within this region, the performance of the two cameras is equivalent.
D. Evaluation of the Overall Measurement Uncertainty
The overall measurement uncertainty was measured in cor-respondence to five positions on the target arranged in a Greek cross layout, four at the cross ends, and one at the center. Each position was marked using a reflective tape cut in 20×20 mm squares.
At each nominal distance Dn, 30 frames were acquired from the target areas corresponding to each single marker (a 15 × 15 pixels neighborhood was considered): in this
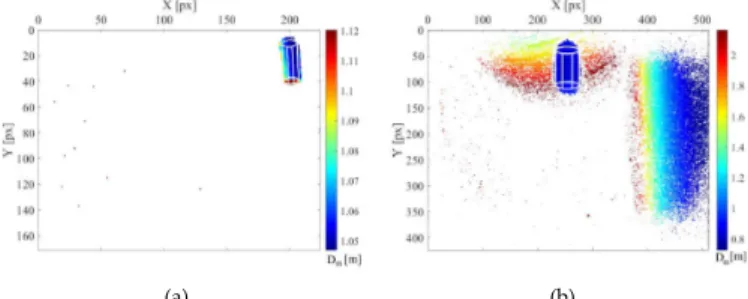
Fig. 10. Measured depths Dm as a function of nominal depths Dn for
(a) Picoflexx and (b) Kinect V2.
Fig. 11. Target of cylindrical shape used for the 3-D reconstruction experiment.
way, we collected five sets of measured depths Dm, each set composed of 15× 15 × 30 = 6750 values. The use of the markers was strategic to ensure that the data extracted from each frame corresponded to the same physical points on the target along the whole measurement range, avoiding that local irregularities of the wall influenced the subsequent analysis.
The collected measurements are presented in Fig. 10, which plots 33 750 measurements Dm at each value Dn for the two cameras. The visual observation of the plots shows that the Picoflexx is characterized by a higher dispersion of the mea-sured depths with respect to the Kinect V2. To quantitatively evaluate it, we computed the mean accuracyσ0, which resulted
equal to 37 mm for the Picoflexx and 18 mm for the Kinect V2. In contrast, the two devices show equal performance in terms of their measurement linearity: the linear regression evaluated on the experimental data resulted in the two dotted lines shown in the plots, with linear regression coefficients R2 of 99.82% for the Picoflexx of and 99.96% for the Kinect V2.
VI. 3-D RECONSTRUCTION OF ACYLINDRICALTARGET
In this experiment, the white cylinder with diameter
d = 75 mm and height h = 175 mm shown in Fig. 11 was
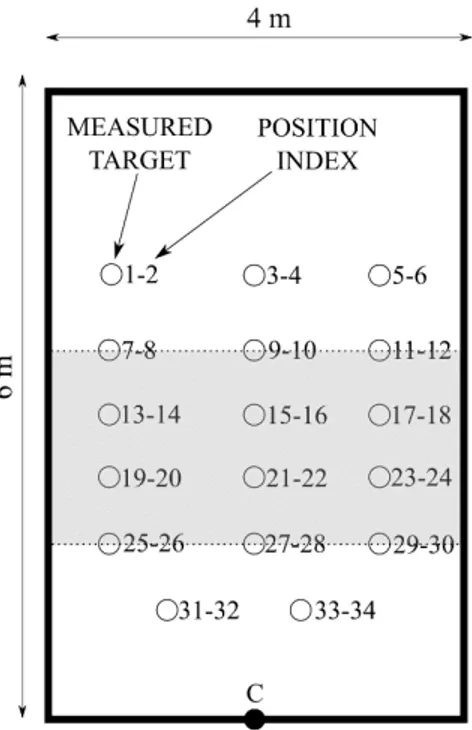
used as the measurement target. The two cameras were placed at position C in the dark room, as shown in Fig. 12. The target was placed at the positions represented by the circles in
Fig. 12. Target positions used for the 3-D reconstruction experiment. The gray area corresponds to the measurement range from 1.7 to 3.5 m.
Fig. 13. Estimated cylinder heights for the Picoflexx and the Kinect V2.
the xz plane. Two further positions along Y -axis were consid-ered, at 1.5 m and at 0.5 m from the floor.
In Fig. 12, even and odd numbers label the positions at 1.5 and 0.5 m, respectively. For each target position, 30 frames were acquired. For each frame, the depth values of the pixels belonging to the target were extracted from the acquired point cloud and fitted to a cylinder [37].
Fig. 13 shows the results of the statistical analysis carried out on the distribution of the heights of the fitted cylinders for both cameras. Squares and bars represent mean values and standard deviations, respectively; full and hollow squares cor-respond to even and odd positions, respectively. The cylinder height is represented by the dashed line.
At positions 1–6, which are further away from the cameras, the Picoflexx shows lower performance than the Kinect: this is due to its lower resolution. As an example, Fig. 14 shows one single depth image acquired at position 2 by the two cameras: the cylinder is captured by 4 × 8 pixels in the Picoflexx [Fig. 14(a)], while for the Kinect, it is 8× 19 pixels [Fig. 14(b)]. The measured depths other than the cylinder in Fig. 14(b) are a side effect induced by the high power light
Fig. 14. Depth images acquired with (a) Picoflexx and (b) Kinect V2, at position 2.
Fig. 15. Depth images acquired with (a) Picoflexx and (b) Kinect V2, at position 31.
source of the Kinect V2, for which the light is reflected back even from the Duvetyne fabric.
From positions 7–34, the performance of the Picoflexx increases with respect to the Kinect V2. The reason is evi-dent when the point clouds acquired in this depth range are observed, as in Fig. 15 for position 31. Here, the cylinder is captured by 18× 36 pixels for the Picoflexx. This number is still lower than the one from the Kinect V2 (55 × 110 pixels) but sufficient to provide a reliable estimate of the cylinder height; in contrast, the side effect induced by the high power light source of the Kinect V2 reduces the quality of the fitting and results in inaccurate estimates of the cylinder height.
Fig. 16 shows the point clouds acquired by the two cameras at positions 14 and 26, together with the fitted surfaces: at position 14, the fitted cylinders are both 175 mm in height [Fig. 16(a) and (b)]; conversely, at position 26, the height estimated by the Picoflexx is 174.5 mm and the one from the Kinect V2 is 216.1 mm.
The Euclidean distance DE between the fitted cylinder and each point of the captured clouds shown in Fig. 16 has been evaluated. Fig. 17 shows the histograms of values DE: in the case of the Picoflexx [Fig. 17(a)] DE spans the interval from
−9 to +9 mm and the histogram is bell shaped, with a mean
value of 0.62 mm and a standard deviation of 4.36 mm; in the case of the Kinect V2 [Fig. 17(b)], DE values span the same range of the Picoflexx, but the histogram is bimodal, with a mean value of 2.13 mm and a standard deviation of 4.62 mm. The histograms of values DE at position 26 are shown in Fig. 17(c) and (d). In the case of the Picoflexx [Fig. 17(c)],
DE spans the interval from−5 to +5 mm and the histogram is no more bell shaped with a mean value of 0.10 mm and a standard deviation of 2.67 mm; in the case of the Kinect V2,
[Fig. 17(d)] DE values span about the same range as for the Picoflexx, the histogram is still bimodal, but the mean value increases to 1.07 mm with a standard deviation equal to 3.37 mm.
This test highlighted that, in the range of interest for our final application (positions from 7 to 30), the Picoflexx represents a better choice with respect to the Kinect V2.
VII. INTERFERENCE
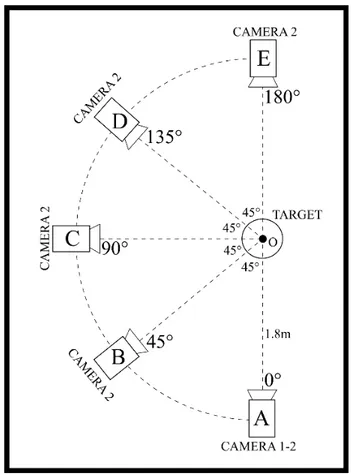
The experimental setup for the interference analysis is shown in Fig. 18. Errors due to the interference were evaluated by placing the cylindrical target inside the dark room at position O. This experiment was performed by using two Picoflexx cameras and subsequently two Kinect V2. To set a baseline for the measurements, a single camera (camera 1) was placed at position A and 30 frames were acquired. A second camera (camera 2) was then placed at positions A–E: this provided a second source of infrared light incident on the target. For each position, the target was captured for 15 min by camera 1. The height of the cylinder was estimated by following the procedure described in Section VI.
The difference Ef between mean values of the estimated height of the cylinder and the nominal height (175 mm) is shown in Fig. 19 for the two cameras, in the absence of inter-ference (single camera) and in the presence of the interinter-ference (positions A–E). Squares and vertical bars represent the mean values and standard deviations, respectively.
In the Picoflexx, the effect of interfering illumination is more evident at positions A, D, and E, where the difference
Ef is 5.9 ± 1.7, 5.5 ± 5.1, and 5.1 ± 2.7 mm, respectively. At positions B and C values, Ef are 1.9±5.2 and 2.1±4.5 mm, respectively.
For the Kinect V2, the highest values Ef are observed at positions A and C (14 ± 10.7 and −6.7 ± 10.4 mm, respectively); at positions B, D, and E errors Ef are 2.3±7.3, 0.4±7.1, and −1.6±9.7 mm, respectively. This is in agreement with [38] where most of the interference was observed at smaller angles.
With the exception of position A, where the Picoflexx performs better than the Kinect V2, in the other cases, the two cameras show comparable performances with maximum errors of 5.9 ± 1.7 and 6.7 ± 10.4 mm for the Picoflexx and the Kinect, respectively. At position A, the Kinect V2 shows an error significantly higher than that for the Picoflexx, likely due to its powerful light source, which causes multipath errors, even in the dark room.
VIII. MEASUREMENT OFHUMANBODYKINEMATICS
In this experiment, we analyzed the performance of the Picoflexx with respect to the Kinect when they are used for measurements of human body kinematics. The experiment has been thought mandatory to assess the performance of the former camera in the application envisaged by the ERTRAG Project, considering that the point clouds acquired by the Picoflexx are characterized by lower spatial resolution and higher dispersion of the measured depths with respect to the Kinect V2 (as shown in Figs. 9 and 10, respectively). A dummy reproducing the human upper body (Fig. 20) was
Fig. 16. Fitted cylinder at position 14 for (a) Picoflexx and (b) Kinect V2 and at position 26 for (c) Picoflexx and (d) Kinect V2.
Fig. 17. Histograms of distance DE at position 14, for (a) Picoflexx and (b) Kinect V2 and at position 26 for (c) Picoflexx and (d) Kinect V2.
used in the experiment. The dummy is 70 cm high and 30 cm wide, and it can simulate human postures thanks to its moving arms.
We can identify seven different body segments [Fig. 21(a)], namely, head and trunk, left and right upper arm, left and right arm, and left and right hand. To evaluate the human
Fig. 18. Experimental setup for evaluating the interference.
Fig. 19. Difference Ef in the absence of interference (single camera) and
in the presence of the interference (positions A–E) for the Picoflexx and the Kinect V2.
kinematics, we defined six angles [Fig. 21(b)], computed from positions and orientations of human body segments.
1) αL: angle between body trunk and left upper arm. 2) αR: angle between body trunk and right upper arm. 3) βL: angle between left upper arm and left arm. 4) βR: angle between right upper arm and right arm. 5) γL: angle between left arm and left hand. 6) γR: angle between right arm and right hand.
We placed the dummy in six different configurations to cover various human postures (Fig. 22). Some of them [Fig. 22(a)–(c)] simulate typical positions that caregivers take during daily work, while some others [Fig. 22(d)–(f)] repro-duce other common human body poses.
For each configuration, the cameras were placed in front of the dummy at a distance of about 2 m, and a single point cloud was acquired. Then, the points belonging to the dummy from
Fig. 20. Dummy used for the measurement of human body kinematics.
Fig. 21. Definition of body segments. (a) Angles. (b) Measurement of human body kinematics.
Fig. 22. Body configurations used for the measurement of human body kinematics. (a) Position number 1, (b) 2, (c) 3, (d) 4, (e) 5, and (f) 6.
the point cloud acquired with each camera were extracted, and principal component analysis (PCA) were used to identify the direction of their main principle components, given the bodies axial symmetry [39], [40]. These directions have been used as directional vectors to create a reference system for the body.
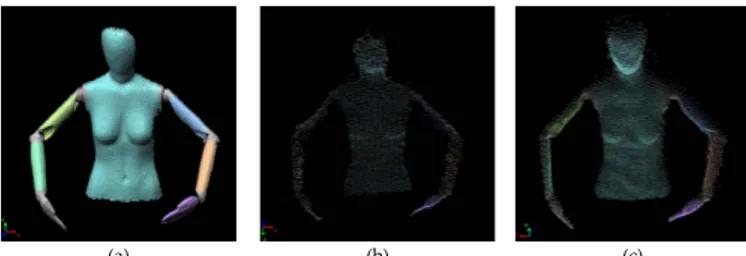
Fig. 23. Point clouds acquired with the (a) Konica Minolta, (b) Picoflexx, (c) Kinect V2 for the dummy configuration shown in Fig. 22(a).
Seven body segments were identified and the angles between them were measured, following the definitions described ear-lier and in Fig. 21(b). For each configuration, we measured the reference ground truth angles using a commercial noncontact 3-D digitizer (Konica Minolta VIVID-920) with a resolution of 640× 480 pixels and an accuracy of ±0.40 mm.
As an example, Fig. 23 shows the point clouds acquired with the Konica Minolta [Fig. 23(a)], with the Picoflexx [Fig. 23(b)], and with the Kinect V2 [Fig. 23(b)] for the dummy configuration represented in Fig. 22(a).
The human body pose is well recognizable in all the figures. The body segments (represented with different colors in the figure) are well defined and they can be segmented from the acquired point clouds. Obviously, the Konica Minolta digitizer gives the most accurate and dense point cloud, while Picoflexx and Kinect point clouds are composed by less points due to their lower resolutions.
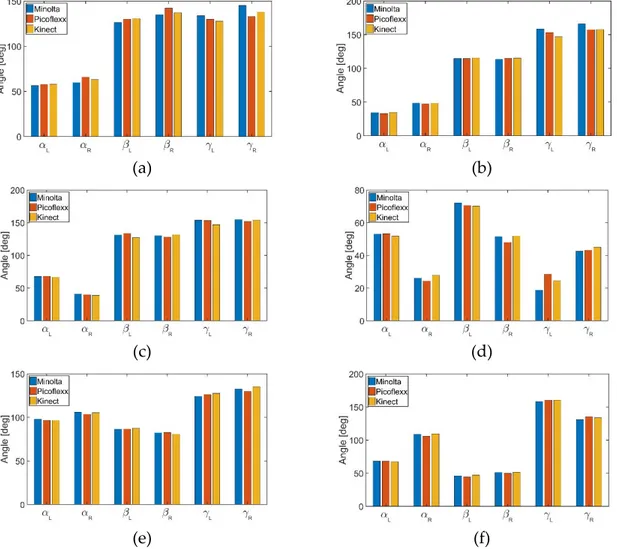
Fig. 24 shows the results obtained for each dummy config-uration considered. Angles between adjacent body segments are plotted as bars. The colors represent the camera used for the measurements. The performances of the ToF cameras are compatible with the results obtained with the Konica Minolta. The average error between angles obtained with Konica Minolta and Picoflexx is 5.82 ± 3.87° (k = 1). The maximum error is 12.5°, obtained in the measurement of angleγR and dummy configuration represented in Fig. 22(a). The Kinect gives an average error of 4.15±2.29° (k = 1) and a maximum error of 11.53° [angleγL and dummy configuration of Fig. 22(b)]. We obtained higher errors in the measurement of γ angles (both left and right), i.e., the angles between arms and hands, because in correspondence of the hands the 3-D points clouds are less dense and the PCA algorithm is less accurate. In all the configurations, the dummy kine-matics is well estimated both for the Picoflexx and for the Kinect.
Finally, the measurement performances of each camera were analyzed, with respect to the one supplied by the commercial digitizer. We placed the dummy in the configuration repre-sented in Fig. 22(e) and we acquired two partial overlapping point clouds (one of the upper half of the dummy and one of the lower half) using the digitizer and the ToF cameras. Then, we optimally aligned the point cloud pairs using a commercial software (Polyworks2016, Innovmetric) and we compared the alignment errors, defined as the 3-D distances between the points belonging to the overlapping surfaces. Fig. 25 shows the results obtained with the Konica Minolta [Fig. 25(a)], with the Picoflexx [Fig. 25(b)], and with the Kinect [Fig. 25(c)]. The left figures show the point clouds acquired (the
over-47.4 × 10 and 5.94 × 10 mm, respectively, and standard deviations of 1.72 and 1.19 mm, respectively. As in the experiments described in Section V, Picoflexx shows worse performances in terms of measurement accuracy. Despite this, the human body kinematic is well measured by the Picoflexx.
IX. TESTING THEPICOFLEXX FORGAITANALYSIS
In this experiment, we tested the feasibility of using the Picoflexx to acquire the 3-D point cloud of the foot during a test session where the user wears an exoskeleton and, using a pair of crutches, can stand up, step forward, and walk. The crutches are instrumented with a system measur-ing the forces actmeasur-ing on the upper limbs, based on strain gages mounted at the crutch base and on the signal acqui-sition and conditioning electronics, suitably developed for this application [29], [30].
In our test, the Picoflexx camera was mounted on each crutch in a position that maximizes the visibility of the contralateral foot (i.e., the camera mounted on the right crutch views the left foot and viceversa) and was USB connected to a Raspberry PI 3 for image acquisition. Fig. 26 shows the whole apparatus mounted on the right crutch: it is easy to note that the reduced dimension of the Picoflexx, and its portability are a key issue to implement this solution [41].
The images were sent wireless to a client PC for subsequent elaboration, carried out using the MatLab Image Toolbox. A preliminary result is shown in Fig. 27, where two depth images are presented. The former [Fig. 27(a)] corresponds to the swing phase of the gait cycle, when the foot is not in contact with the ground; the latter [Fig. 27(b)] to the stance phase, when the foot remains in contact with the ground. These images have been preprocessed to filter out the background information: Fig. 28 presents, for the swing [Fig. 28(a)] and for the stance [Fig. 28(b)] gait phases, respectively, the resulting point clouds, where only the points corresponding to the foot and to the ground are retained. As shown in these two images, both the foot and the ground are well visible; in addition, the corresponding point clouds are well separated during the swing, while they are connected to each other during the stance. By suitably elaborating these images, it was possible to cluster the feet and the ground and, hence, to distinguish the swing from the stance [42]; then, following an approach similar to the one presented in Section VIII for the analysis of the dummy body segments, the PCA was used to estimate the angle at the ankle. The result of this analysis is shown in Fig. 29, where the angle at the ankle, denoted by δ1 is
overlaid to the image: the values calculated in the swing and in the stance phases equal 94.4° [Fig. 29(a)] and 108.9° [Fig. 29(b)], respectively.
Fig. 24. Body angles obtained for each dummy configuration considered with the Konica Minolta (blue bars), with the Picoflexx (red bars), and with the Kinect (yellow bars). (a) Position number 1, (b) 2, (c) 3, (d) 4, (e) 5, and (f) 6.
TABLE II
COMPARISONRESULTSBETWEEN THEPICOFLEXX ANDKINECTV2
X. COMMENTS ON THEEXPERIMENTALRESULTS
The experimental work presented in this paper highlighted the following aspects.
1) The Picoflexx camera shows better performance with respect to the Kinect V2 in relation to the temperature related errors, since it does not show warm-up time; in contrast, the Kinect V2 needs at least 40 min to
output reliable data. However, after the warm-up phase, the Kinect yields better and more accurate results: hence, in cases, where immediate use of the devices is not required the Kinect performs better.
2) The Picoflexx camera shows better performance than the Kinect V2 in relation to depth distortion, at least in the measurement range from 1.7 to 3.5 m, which is
Fig. 25. Alignment errors obtained with the (a) Konica Minolta, (b) Picoflexx, and (c) Kinect. The acquired point clouds (the overlapping part of the surfaces is colored) (left). The histograms of the overlapping errors (right).
of interest in the application of the ERTRAG project. Moreover, it does not present the wiggling behavior that characterizes the Kinect V2.
3) Both cameras perform best at the central region of their fields of view. This was evidenced by the experi-ments conducted to assess the amplitude and the tem-poral related errors. Errors in the depth measurements increase when approaching the edges of the depth images for both cameras. Despite the Picoflexx shows
lower performance than the Kinect V2 (as demon-strated by the measurement uncertainty shown at Paragraph 5.4), it can be considered a valid alternative to the Kinect V2 in the central area of the acquired frames.
4) The Picoflexx performs better than the Kinect V2 in estimating the height of the cylindrical target in the measurement volume considered for the ERTRAG appli-cation. Surprisingly, the Kinect V2 high illumination
Fig. 26. Crutches during a walk session using an exoskeleton. The small dimension of the Picoflexx, its low power consumption and the wireless connection to the central unit, make it suitable for outdoor, online gait capture.
Fig. 27. Depth images captured by the Picoflexx mounted on the left crutch during a walk session (gray shades represent measured depths). (a) Swing and (b) stance phases of the gait.
proves to be a disadvantage in this regard and results in errors due to flying pixels.
5) The Picoflexx shows lower dependence then the Kinect V2 on the interference of the illumination from a second camera of the same type, at different positions in the measurement volume. This result can be related to the values of the illumination apertures, which are lower in the Picoflexx.
6) Despite worse performances in terms of alignment errors with respect to a commercial digitizer (considered as reference), both cameras show good performances in the measurement of the human body kinematics. The results reported in Section VIII is quite encouraging as, despite the point clouds captured by the Picoflexx are significantly worse than the ones from the Kinect and from the Vivid 910 triangulation-based scanner, the estimated kinematics angles are not.
7) The Picoflexx shows very promising in applications where portability, low power consumption and wire-less communication are the key elements. In the test presented in Section IX, it is has been proven that the
Fig. 28. Effect of the background elimination. (a) Swing phase. (b) Stance phase.
Fig. 29. Clustering of the point clouds and estimate of the mutual leg/foot orientation for the evaluation of the angle at the ankle. (a) Swing phase. (b) Stance phase.
Picoflexx is a valuable device to capture the gait phases during the walk, thanks to the possibility of mounting it on the crutches, and to its suitability to capture the 3-D point cloud of the foot for subsequent measurement of the angles at the ankle and the detection of the gait phases.
For the sake of clarity, the comparison results between the Picoflexx and the Microsoft Kinect V2 are reported in Table II.
XI. CONCLUSION
In this paper, the results of the comparative analysis of two consumer-grade ToF cameras, namely, the Camboard Picoflexx and the Microsoft Kinect V2 have been presented. The experiments were designed in the context of marker-less human motion capture, using a multiview setup for the research project ERTRAG. The two cameras were evaluated to assess their performance in relation to temperature related error sources, depth distortion, amplitude error, temporal error, shape reconstruction, interference errors, and human body kinematic measurements. The evaluation of the measurement uncertainty was also carried out to compare the overall mea-surement performance of the two devices.
Although the authors have started their experimental work thinking at the ERTRAG project application, the final result of their effort is definitely useful to the research community, demonstrating that, even if the Picoflexx performs lower than the Kinect concerning the measurement performances, its behavior in estimating the volume of the body segments, the angles at the joints, the gait phases, and the angle at the ankle in assisted walking applications is definitely sat-isfactory. These results are extremely significant to obtain accurate estimates of the parameters of the human body models in markerless motion capture applications, especially in laboratory-free environments, where compactness, light-weight, wireless connection, and low power consumption are of outmost importance.
[4] J. Reichold et al., “Human-machine interaction in care-education,” in
Proc. Mensch Comput., Sep. 2017, pp. 351–356.
[5] G. Sansoni, M. Trebeschi, and F. Docchio, “State-of-the-art and applica-tions of 3D imaging sensors in industry, cultural heritage, medicine, and criminal investigation,” Sensors, vol. 9, no. 1, pp. 568–601, Jan. 2009. [6] S. Hussmann and A. Hermanski, “One-phase algorithm for continuous wave TOF machine vision applications,” IEEE Trans. Instrum. Meas., vol. 62, no. 5, pp. 991–998, May 2013.
[7] S. B. Gokturk, H. Yalcin, and C. Bamji, “A time-of-flight depth sensor—System description, issues and solutions,” in Proc. IEEE
Comput. Soc. Conf. Comput. Vis. Pattern Recognit. Workshops,
Jun./Jul. 2004, p. 35.
[8] J. Steinbaeck, A. Tengg, G. Holweg, and N. Druml, “A 3D time-of-flight mixed-criticality system for environment perception,” in Proc.
20th Euromicro Conf. Digit. Syst. Design (DSD), Aug./Sep. 2017,
pp. 368–374.
[9] S. Foix, G. Alenya, and C. Torras, “Lock-in time-of-flight (ToF) cameras: A survey,” IEEE Sensors J., vol. 11, no. 9, pp. 1917–1926, Sep. 2011.
[10] T. Kahlmann, F. Remondino, and H. Ingensand, “Calibration for increased accuracy of the range imaging camera swissranger,” Image
Eng. Vis. Metrol., vol. 36, no. 3, pp. 136–141, Nov. 2006.
[11] F. Chiabrando, R. Chiabrando, D. Piatti, and F. Rinaudo, “Sensors for 3D imaging: Metric evaluation and calibration of a CCD/CMOS time-of-flight camera,” Sensors, vol. 9, no. 12, pp. 10080–10096, Dec. 2009. [12] O. Steiger, J. Felder, and S. Weiss, “Calibration of time-of-flight range imaging cameras,” in Proc. 15th IEEE Int. Conf. Image Process., Oct. 2008, pp. 1968–1971.
[13] A. Kolb, E. Barth, R. Koch, and R. Larsen, “Time-of-flight cameras in computer graphics,” Comput. Graph. Forum, vol. 29, no. 1, pp. 141–159, Mar. 2010.
[14] P. Fürsattel et al., “A comparative error analysis of current time-of-flight sensors,” IEEE Trans. Comput. Imag., vol. 2, no. 1, pp. 27–41, Jan. 2016. [15] M. Ye, Q. Zhang, L. Wang, J. Zhu, R. Yang, and J. Gall, “A survey on human motion analysis from depth data,” in Proc. Time-of-Flight
Depth Imag. Sensors, Algorithms, Appl. Berlin, Germany: Springer,
2013, pp. 149–187.
[16] Z. Gao, Y. Yu, Y. Zhou, and S. Du, “Leveraging two Kinect sen-sors for accurate full-body motion capture,” Sensen-sors, vol. 15, no. 9, pp. 24297–24317, Sep. 2015.
[17] S. Zennaro et al., “Performance evaluation of the 1st and 2nd generation Kinect for multimedia applications,” in Proc. IEEE Int. Conf. Multimedia
Expo, Jun./Jul. 2015, pp. 1–6.
[18] P. Fankhauser, M. Bloesch, D. Rodriguez, R. Kaestner, M. Hutter, and R. Siegwart, “Kinect v2 for mobile robot navigation: Evaluation and modeling,” in Proc. Int. Conf. Adv. Robot. (ICAR), Jun. 2015, pp. 388–394.
[19] G. Plouffe and A.-M. Cretu, “Static and dynamic hand gesture recogni-tion in depth data using dynamic time warping,” IEEE Trans. Instrum.
Meas., vol. 65, no. 2, pp. 305–316, Feb. 2016.
[20] D. Webster and O. Celik, “Systematic review of Kinect applications in elderly care and stroke rehabilitation,” J. Neuroeng. Rehabil., vol. 11, no. 108, pp. 1–24, Jul. 2014.
[21] H. M. Hondori and M. Khademi, “A review on technical and clinical impact of microsoft Kinect on physical therapy and rehabilitation,”
J. Med. Eng., vol. 2014, pp. 1–16, Dec. 2014.
[22] L. F. Yeung, K. C. Cheng, C. H. Fong, W. C. C. Lee, and K.-Y. Tong, “Evaluation of the Microsoft Kinect as a clinical assessment tool of body sway,” Gait Posture, vol. 40, no. 4, pp. 532–538, Sep. 2014. [23] B. Bonnechère et al., “Validity and reliability of the Kinect
within functional assessment activities: Comparison with standard stereophotogrammetry,” Gait Posture, vol. 39, no. 1, pp. 593–598, Jul. 2014.
[24] J. Steward, D. Lichti, J. Chow, R. Ferber, and S. Osis, “Performance assessment and calibration of the Kinect 2.0 time-of-flight range camera for use in motion capture applications,” in Proc. FIG Work. Week, May 2015, pp. 1–4.
limb: A model-based algorithm using segment orientations,” Biomed.
Eng. OnLine, vol. 16, p. 21, Aug. 2017.
[28] S. Federici, F. Meloni, M. Bracalenti, and M. L. De Filippis, “The effectiveness of powered, active lower limb exoskeletons in neurorehabilitation: A systematic review,” NeuroRehabilitation, vol. 37, no. 3, pp. 321–340, Nov. 2015.
[29] E. Sardini, M. Serpelloni, and M. Lancini, “Wireless instrumented crutches for force and movement measurements for gait monitoring,”
IEEE Trans. Instrum. Meas., vol. 64, no. 12, pp. 3369–3379, Dec. 2015.
[30] M. Lancini, M. Serpelloni, S. Pasinetti, and E. Guanziroli, “Healthcare sensor system exploiting instrumented crutches for force measurement during assisted gait of exoskeleton users,” IEEE Sensors J., vol. 16, no. 23, pp. 8228–8237, Dec. 2016.
[31] (Oct. 2017). PMDTec GmbH. [Online]. Available: http://www.pmdtec. com/
[32] O. Wasenmüller and D. Stricker, “Comparison of Kinect V1 and V2 depth images in terms of accuracy and precision,” in Proc. 13th Asian
Conf. Comput. Vis. (ACCV), Nov. 2016, pp. 34–45.
[33] H. Sarbolandi, D. Lefloch, and A. Kolb, “Kinect range sensing: Structured-light versus time-of-flight Kinect,” Comput. Vis. Image
Understand., vol. 139, pp. 1–20, Oct. 2015.
[34] A. Corti, S. Giancola, G. Mainetti, and R. Sala, “A metrological characterization of the Kinect V2 time-of-flight camera,” Robot. Auto.
Syst., vol. 75, pp. 584–594, Jan. 2016.
[35] S. Hussmann, F. Knoll, and T. Edeler, “Modulation method including noise model for minimizing the wiggling error of TOF cameras,” IEEE
Trans. Instrum. Meas., vol. 63, no. 5, pp. 1127–1136, May 2014.
[36] Guide de Expression of Uncertainty in Measurements, JCGM, Bureau Int. Piods Measures, Sèvres, France, 2008.
[37] P. H. S. Torr and A. Zisserman, “MLESAC: A new robust estimator with application to estimating image geometry,” Comput. Vis. Image
Understand., vol. 78, no. 1, pp. 138–156, 2000.
[38] A. Kunz, L. Brogli, and A. Alavi, “Interference measurement of Kinect for xbox one,” in Proc. 22nd ACM Conf. Virtual Reality Softw. Technol., Nov. 2016, pp. 345–346.
[39] M. Martinek, R. Grosso, and G. Greiner, “Optimized canonical coor-dinate frames for 3D object normalization,” in Proc. Vis., Modeling
Vis. (VMV), Nov. 2012, pp. 167–174.
[40] A. Imiya and K. Kawamoto, “Learning dimensionality and orientations of 3D objects,” Pattern Recognit. Lett., vol. 22, no. 1, pp. 75–83, Jan. 2001.
[41] M. A. Brodie et al., “Wearable pendant device monitoring using new wavelet-based methods shows daily life and laboratory gaits are differ-ent,” Med. Biol. Eng. Comput., vol. 54, no. 4, pp. 663–674, Apr. 2016. [42] G. Sansoni, P. Bellandi, F. Leoni, and F. Docchio, “Optoranger: A 3D pattern matching method for bin picking applications,” Opt. Lasers
Eng., vol. 54, pp. 222–231, May 2014.
Simone Pasinetti received the B.S. degree and the
M.S. degree (Hons.) in automation engineering from the University of Brescia, Brescia, Italy, in 2009 and 2011, respectively, with a thesis concerning the control of mechanical actuators with surface elec-tromyography signals, and the Ph. D. degree in applied mechanics from the University of Brescia, in 2015, with a thesis titled Development of mea-surement protocols for the analysis of the functional evaluation and rehabilitation, in biomechanics field.
He was with the Institute of Intelligent Systems and Robotics, Paris, France, where he carried out his Ph.D. research on the dynamic posture analysis. Since 2015, he has been a Research Fellow with the Laboratory of Vision Systems for Mechatronics, Department of Mechanical and Industrial Engineering, University of Brescia. He is involved in posture and gait analysis, depth sensors, collaborative robotics, and 2-D and 3-D vision systems development. His current research interests include biomechanics of human posture, motion analysis, electromyography analysis, collaborative robotics, and 2-D and 3-D vision systems.
M. Muneeb Hassan received the M.Sc. degree
in mechatronics from the University of Applied Sciences Ravensburg-Weingarten, Weingarten, Germany, in 2015. He is currently pursuing the Ph.D. degree with the University of Brescia, Brescia, Italy.
He is currently a Research Assistant in markerless motion capture with 3-D cameras with the University of Applied Sciences Ravensburg-Weingarten.
Jörg Eberhardt received the M.S. degree in
infor-mation science majoring in machine vision and machine learning from the University of Applied Sciences Konstanz, Konstanz, Germany, in 1993, and the Ph.D. degree in 3-D scanners and 3-D modeling from Coventry University, Coventry, U.K., in 1998.
From 1999 to 2013, he was a Senior Engineer for well-known companies in machine vision, where he was responsible for research and development. In 2013, he became an Endowed Professor of optical technologies with the University of Applied Sciences Ravensburg-Weingarten, Weingarten, Germany. His current research interests include 3-D technologies, camera technologies, and machine vision.
Dr. Eberhardt is the Co-Founder of Corpus-e, Stuttgart, Germany, the leading experts in the field of 3-D scanning of human body parts.
Matteo Lancini received the master’s degree in
mechanical engineering and the Ph.D. degree in applied mechanics from the University of Brescia, Brescia, Germany, in 2005 and 2015, respectively.
He was a Research Contractor with the Depart-ment of Industrial and Mechanical Engineering, Uni-versity of Brescia, where he was involved in the development of measurement techniques for indus-trial diagnostics, and focused on measurements in uncontrolled environments from 2005 to 2009. He is currently an Assistant Professor with the Mechan-ical and Thermal Measurements Laboratory, Department of Industrial and Mechanical Engineering, University of Brescia. His current research interests include measurement systems for biomechanical analysis, in particular, for robotic gait and rehabilitation, and industrial diagnostics using nondestructive techniques based on vibration measurements.
Dr. Lancini is a member of the International Society of Biomechanics.
Franco Docchio received the M.S. degree in nuclear
engineering from the Politecnico of Milano, Milan, Italy, in 1976.
From 1978 to 1987, he was with Centro di Elet-tronica Quantistica, Milan, where he was involved in laser development, laser applications in indus-try and biomedicine, and laser–tissue interaction. In 1987, he joined the Dipartimento di Elet-tronica per l’Automazione, University of Brescia, Brescia, Italy, where he is currently the Full Professorship in electrical measurements. He also a member of the Laboratory of Vision Systems for Mechatronics, Brescia, where he has been active in the creation and incubation of a number of spin-off companies that operate in the domain of optoelectronics, laser processing of materials, optical sensors, and 3-D vision. He has authored more than 250 publications, mostly international. He holds five International patents on instrumentation and innovative techniques for electro-optical measurements.
Mr. Docchio is currently a fellow of the European Optical Society.
Giovanna Sansoni received the M.S. degree in
electronic engineering from the Politecnico of Milan, Milan, Italy, in 1984.
In 1985, she joined the University of Brescia, Brescia, Italy. She is currently a Full Professor of electrical measurements with the Department of Mechanical and Industrial Engineering, University of Brescia, and also the Head of the Laboratory of Visions Systems for Mechatronics. Her current research interests include 3-D vision area, the imple-mentation of camera and projector calibration for the absolute measurement of shape in active stereo vision systems, the develop-ment of light coding methods for whole-field optical profilometry, the applica-tion of optical instrumentaapplica-tion to the acquisiapplica-tion, and the reverse engineering of free-form surfaces.