Article
Salinity Differentially Affects Growth and
Ecophysiology of Two Mastic Tree
(Pistacia lentiscus L.) Accessions
Giuseppe Cristiano, Salvatore Camposeo, Mariano Fracchiolla, Gaetano Alessandro Vivaldi, Barbara De Lucia and Eugenio Cazzato *
Department of Agricultural and Environmental Sciences, University of Bari “Aldo Moro”, Bari 70126, Italy; [email protected] (G.C.); [email protected] (S.C.); [email protected] (M.F.); [email protected] (G.A.V.); [email protected] (B.D.L.)
* Correspondence: [email protected]; Tel.: +39-080-544-2973; Fax: +39-080-467-9811 Academic Editors: Jarmo K. Holopainen and Timothy A. Martin
Received: 9 June 2016; Accepted: 23 July 2016; Published: 27 July 2016
Abstract: Pistacia lentiscus (Anacardiaceae; mastic tree) is an evergreen sclerophyll species, largely distributed in dry areas of the Mediterranean basin and well-adapted to severe conditions of drought in very unfertile soils. In the present study, we evaluated the growing responses of two accessions of P. lentiscus to three different levels of salinity under nursery conditions. The two mastic tree accessions (Manfredonia and Specchia) were collected from individual trees in two different sites in the Apulia region (Southern Italy) and subjected to three different levels of salinization by adding 0, 400, and 800 g of salts 100 L´1of substrate, respectively. The following parameters were recorded: plant height; survival of plants and total root length; total biomass; number of leaves per plant and leaf area; as well as various ecophysiological traits. Salinity reduced the values of all the examined parameters, both morphological and physiological. Results suggested that P. lentiscus can tolerate and accumulate salt at high concentrations in nursery conditions. As a result, it is important to identify germplasm that is highly tolerant to salinity for the production of nursery seedlings that will be planted in saline soils.
Keywords: Pistacia lentiscus; salinity; germplasm; ecophysiology; growth
1. Introduction
Pistacia lentiscus (Anacardiaceae) is an evergreen sclerophyll species, largely distributed in dry/warm areas of the Mediterranean basin and well-adapted to severe conditions of drought in very unfertile soils [1–3]. In Southern Italy, P. lentiscus grows in diverse habitats along a climatic gradient that varies in solar radiation, temperature, and precipitation. It is currently being investigated for its potential to restore vegetation in dry-land areas of the Mediterranean basin, which may suffer from excess soil salinity during the warm summer season [4,5]. This species (also named the mastic tree) is well known in Mediterranean countries for its resin—mastic gum—used since antiquity for incense, as a chewing gum for pleasant breath, for spicing liqueurs and jam, and in the cosmetic industry [6].
P. lentiscus is a leading component of the low altitude Mediterranean maquis. Its distribution around the Mediterranean basin extends to north and eastern Africa and Madeira Island [7].
Revegetation and afforestation programs for abandoned and degraded lands, encouraged recently by the EU [8], frequently put pressure on nurseries for a massive young plant availability. Nursery production of native Mediterranean shrubs and trees in Southern Italy shifted from bare root plant production to container growing systems in the 1990s [9,10]. Currently, the choice of species in Mediterranean urban green spaces is oriented towards native plants, such as the mastic tree, that promote environmentally-sound landscaping practices [11].
Forests 2016, 7, 156 2 of 12
Salinity is one of the major abiotic stresses that affects plant production and growth in many arid and semi-arid areas [12,13]. Many semi-arid regions of the world are characterized by soil and water that are too saline, where net evaporation is high and soil washing results are negligible due to the limited freshwater associated with scarce rainfall and poor soil drainage [14]. Salinity may affect ornamental shrubs by reducing growth and leaf expansion resulting from osmotic effects or toxicity due to the high concentration of Na+and Cl´typical of saline water [15]. However, to the best of our knowledge, there are few studies investigating the response of P. lentiscus germplasm to saline stress in nursery production.
It was suggested that ecotypic differentiation has enabled P. lentiscus to grow in different habitats [16,17]. The germplasm, therefore, allows us to assess the response of the species to different abiotic stresses. Thus, in the present study we evaluated the growing responses of two accessions of P. lentiscus to three different levels of salinity under nursery conditions.
2. Materials and Methods
The research was conducted at the greenhouses of the Campus of the Department of Agro-Environmental and Territorial Science, University of Bari (Italy; latitude 41˝061N; longitude 16˝511E; 16 m a.s.l.). Previously, about 2 kg of fruits from two mastic tree accessions—labelled A6 (“Manfredonia”) and A12 (“Specchia”)—were collected from individual trees in the two different sites in the Apulia region (southern Italy), from the end of November to the beginning of December 2014. Table1shows the main characteristics of the two sites. After harvesting, the fruits were stripped by manual squeezing using appropriate sieves and were perforated with jets of water for pulp removal.
Table 1.Altitude, latitude, longitude, electrical conductivity (ECe), pH, and total N of the soil of sites where the two accessions (A6 and A12) were collected.
Accession Site Altitude (m a.s.l.) Latitude Longitude ECe(dS¨m´1) pH N‰
A6 Manfredonia (FG) 5 41˝351N 15˝491E 0.60 7.99 2.77
A12 Specchia (LE) 230 39˝551N 18˝171E 0.27 8.08 1.82 The seeds were air-dried at ambient temperature, until the attainment of a moisture of ~6%–7%, and subsequently stored at 4˝C. The seeding was made using alveolate containers in a greenhouse. The production phase of the mastic tree plants ended two months after seeding, when the transplantation was performed in the same substrate subjected to three different salinity levels. The substrate for transplantation was a mixture (50:50 v/v) of a ground air-dried soil and a commercial substrate for potting. The soil was a sandy-clay having total N of 1.6‰ and a field capacity and wilting point of 24.9% and 15.5% of dry weight, respectively. The commercial substrate had the following characteristics (on dry matter): 45% of organic carbon, 0.5% of organic N, 60% of organic matter, pH of 6, and electrical conductivity (ECe) < 1.5 dS¨m´1. The mixture obtained had total N of 2.2‰ and a field capacity and wilting point of 35.6% and 22.5% of the dry weight, respectively. This mixture was subjected to three different levels of salinization (S0, S1, and S2) obtained by adding 0, 400, and 800 g of salts 100 L´1of substrate, respectively; the salts used were a mixture of NaCl and CaCl2in a weight ratio 1:1 (Table2).
Table 2.Chemical characteristics of the substrates used as treatments. Substrates/Salinity Levels Salt Content (g 100 L´1) EC
e(dS¨m´1) pH
S0 0 1.7 7.95
S1 400 12.5 7.35
Plastic pots (40 ˆ 60 ˆ 16 cm), having a hole necessary for the harvesting of the leaching fraction in a special bottle, were filled with the three substrates; subsequently, 20 plants for each accession were transplanted. A split plot experimental design was used with four replicates; the “salinity level” and “accession” were tested in the main plots and in the sub-plots, respectively.
Plants were grown under salinized substrates for 87 days: 72 days in the greenhouse and the last 15 days outdoors in order to allow an appropriate period of acclimatization of plants to direct sunlight, necessary for the measurement of leaf gas exchange. Irrigation was performed with water of good quality (ECw = 0.5 dS¨m´1). The irrigations were performed manually distributing water on the soil surface when 35% of the available water was lost by evapotranspiration, as estimated by subsequent weightings. The volume of water for each irrigation was performed in order to limit percolation required to fully saturate the whole profile of substrate.
The following parameters were recorded: plant height (measured every 20 days); survival of plants and total root length; total biomass (on dry weight); number of leaves per plant and leaf area, measured using a leaf area meter (LI-COR 3100C, LI-COR, Inc., Lincoln, NE, USA) at the end of the trial.
Then, 60 leaves (10 leaves ˆ 2 accessions ˆ 3 treatments) were randomly collected to evaluate the stomatal characteristics, both frequency (stomata mm´2) and size (width and length), following the technique reported by Camposeo et al. [18] using light microscopy (Nikon Instruments Europe, Florence, Italy) and the image analysis software ARKON (version Arkon 32, Nikon Instruments, Florence, Italy). At the same time, on fully expanded, healthy, well light-exposed leaves [19], stomatal conductance (mmol H2O m´2¨s´1), transpiration rate (T, mmol H2O m´2¨s´1; data not shown) and net assimilation rate (A, µmol CO2 m´2¨s´1) using the open system gas exchange analyzer LCA-4 (Leaf chamber Analyzer, ADC Ltd., Hoddeson, UK) with PLC (Parkinson Leaf chamber) B-002 (Analytical Development Company, Hoddesdon, Herts, UK), were determined under saturated photosynthetically active radiation (PAR > 1700 µmol m´2¨s´1). Water use efficiency was then calculated as A/T (WUE, µmol CO2mmol¨H2O´1). On the same leaves, midday leaf water potential (MPa) was measured according to Sholander et al. [20]. For each treatment and for both accessions, all the ecophysiological parameters were performed on three leaves per plant.
Finally, on leaves, stems and roots, the contents of K+, Ca2+, Na+, and Mg2+were determined using atomic absorption spectrophotometer (GBC 932 Plus, GBC Scientific Equipment Ltd., Dandenong, VIC, Australia) and total N by Kjeldahl method. These determinations were carried out on a sample comprising the biomass of both accessions, because the small amount of dry matter obtained for the higher salinity saline treatments did not allow us to obtain a sufficient amount of sample for analysis.
Data obtained were subjected, after angular transformation of the percentage values, to ANOVA according to a split-plot design; total N and cations plant content were analyzed according to randomized block design. The differences between means were evaluated with the Student-Newman-Keuls (SNK) test or using t-test when indicated.
3. Results
3.1. Plants Survival
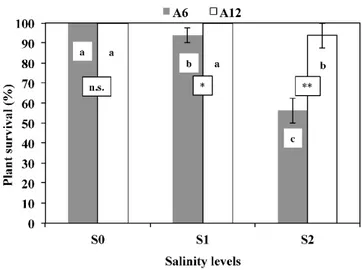
The survival percentage of plants recorded at the end of the trial showed differences between the two accessions (Figure1). A depressing effect of saline treatments on plant survival was found, but it was significant only at the higher doses of salinity (S2, corresponding to an ECevalue of 21.5 dS¨m´1), with 56% for A6, and 94% for A12.
Forests 2016, 7, 156 4 of 12
Forests 2016, 7, 156 4 of 13
Figure 1. Plant survival (%) in response to different salinity levels (S0, S1, and S2) of two accessions of mastic tree A6 (Manfredonia) and A12 (Specchia). a–c: the letters denote statistically significant differences among salinity levels for each accession (p = 0.01; Student–Newman–Keuls (SNK) test); the stars denote statistically significant differences between the two accessions for each salinity level (* p = 0.05; ** p = 0.01; n.s. not significant; t‐test).
To characterize the behaviour of the accessions in terms of survival of the plants with increasing salinity of the substrate, the equation of Maas and Hoffman [21] was applied to the values of relative survival to obtain the critical threshold, slope and ECe50% (Table 3). Results showed that A6 accession (Manfredonia) was less resistant to salinity in terms of survival (ECe50% equal to 23.0 dS∙m−1) with a relatively low critical threshold (12.38 dS∙m−1) and a relatively high slope of 4.70. The accession A12 (Specchia) showed the highest capacity of survival with increasing salinity, having a slope of 1.56, a critical threshold of 17.23 dS∙m−1, and an estimated value of ECe50% equal to 49.3 dS∙m−1.
Table 3. Mass and Hoffman model used for relative survival of two accessions used for experiment evaluated on ECe50.
Accessions Equation ECe50(dS∙m−1)
A6 y = 100 − 4.70(x − 12.38) 23.0
A12 y = 100 − 1.56(x− 17.23) 49.3 3.2. Plant Height, Root Length, and Total Dry Biomass
As expected, an increase of plant height for both accessions and for each level of salinity was found (Figure 2). Furthermore, at low salinity levels (S0 and S1), no statistically significant differences between accessions A6 and A12 were observed, although A12 showed the highest values of tree height. Conversely, at the S2 salinity level, the plant height of A12 was statistically significantly different from A6.
Figure 1.Plant survival (%) in response to different salinity levels (S0, S1, and S2) of two accessions of mastic tree A6 (Manfredonia) and A12 (Specchia). a–c: the letters denote statistically significant differences among salinity levels for each accession (p = 0.01; Student-Newman-Keuls (SNK) test); the stars denote statistically significant differences between the two accessions for each salinity level (* p = 0.05; ** p = 0.01; n.s. not significant; t-test).
To characterize the behaviour of the accessions in terms of survival of the plants with increasing salinity of the substrate, the equation of Maas and Hoffman [21] was applied to the values of relative survival to obtain the critical threshold, slope and ECe50%(Table3). Results showed that A6 accession (Manfredonia) was less resistant to salinity in terms of survival (ECe50%equal to 23.0 dS¨m´1) with a relatively low critical threshold (12.38 dS¨m´1) and a relatively high slope of 4.70. The accession A12 (Specchia) showed the highest capacity of survival with increasing salinity, having a slope of 1.56, a critical threshold of 17.23 dS¨m´1, and an estimated value of ECe50%equal to 49.3 dS¨m´1.
Table 3.Mass and Hoffman model used for relative survival of two accessions used for experiment evaluated on ECe50.
Accessions Equation ECe50(dS¨m´1)
A6 y = 100 ´ 4.70(x ´ 12.38) 23.0
A12 y = 100 ´ 1.56(x ´ 17.23) 49.3
3.2. Plant Height, Root Length, and Total Dry Biomass
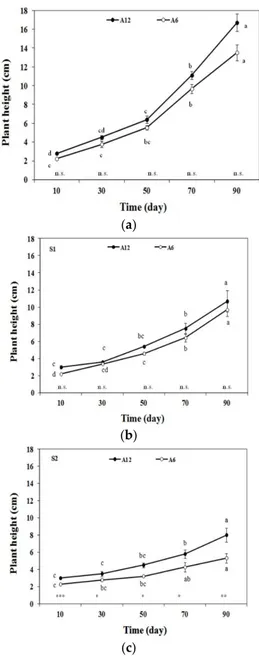
As expected, an increase of plant height for both accessions and for each level of salinity was found (Figure2). Furthermore, at low salinity levels (S0 and S1), no statistically significant differences between accessions A6 and A12 were observed, although A12 showed the highest values of tree height. Conversely, at the S2 salinity level, the plant height of A12 was statistically significantly different from A6.
Regarding root lengths (Figure3), a statistically significant decrease was observed for each accession when the salinity level increased. In particular, there was a major decrease in the root length of accession A6 compared to A12. The same behaviour was observed for total dry biomass (Table4). Increasing salinity caused the production of dry biomass to decrease for both accessions. In particular, at salinity level S2, accession A6 showed a reduction of dry biomass from 1059 mg in S0 to 257 mg per plant in S2 (´76%), while in A12 a reduction from 1550 mg in S0 to 527 mg per plant in S2 (´66%) was seen.
Forests 2016, 7, 156 5 of 13 (a) (b) (c) Figure 2. Tree height (cm) every 20 days in response to different salinity levels (S0, S1, and S2) of two accessions A6 and A12. a–c: the letters on the lines denote statistically significant differences among growth times for each accession (p = 0.01; SNK test); the stars denote statistically significant differences between the two accessions for each growth time (* p = 0.05; ** p = 0.01; *** p = 0.001; n.s. not significant;
t‐test). (a) represents the plant height under treatment S0, (b) represents the plant height under
treatment S1, (c) represents the plant height under treatment S2.
Regarding root lengths (Figure 3), a statistically significant decrease was observed for each accession when the salinity level increased. In particular, there was a major decrease in the root length of accession A6 compared to A12. The same behaviour was observed for total dry biomass (Table 4). Increasing salinity caused the production of dry biomass to decrease for both accessions. In particular, at salinity level S2, accession A6 showed a reduction of dry biomass from 1059 mg in S0 to 257 mg per plant in S2 (−76%), while in A12 a reduction from 1550 mg in S0 to 527 mg per plant in S2 (−66%) was seen.
Figure 2. Tree height (cm) every 20 days in response to different salinity levels (S0, S1, and S2) of two accessions A6 and A12. a–c: the letters on the lines denote statistically significant differences among growth times for each accession (p = 0.01; SNK test); the stars denote statistically significant differences between the two accessions for each growth time (* p = 0.05; ** p = 0.01; *** p = 0.001; n.s. not significant; t-test). (a) represents the plant height under treatment S0; (b) represents the plant height under treatment S1; (c) represents the plant height under treatment S2.
Table 4.Total biomass (mg¨plant´1on dry weight) in response to different salinity levels.
Salinity Levels A6 A12 t-test Mean
S0 1059 ˘ 141 A 1550 ˘ 124 A ** 1305 ˘ 127 A
S1 620 ˘ 128 B 756 ˘ 68 B * 688 ˘ 72 B
S2 257 ˘ 60 C 527 ˘ 73 C ** 392 ˘ 67 C
mean 645 ˘ 115 944 ˘ 110 * 795 ˘ 105
The letters A–C denote statistically significant differences among salinity levels for each accession (p = 0.01; SNK test); the stars denote statistically significant differences between the two accessions for each salinity level (* p = 0.05; ** p = 0.01; n.s. not significant; t-test).
Forests 2016, 7, 156 6 of 12
Forests 2016, 7, 156 6 of 13
Figure 3. Roots length (cm) in response to different salinity levels (S0, S1, and S2) of two accessions A6 and A12. a–c: the letters denote statistically significant differences among salinity levels for each accession (p = 0.01; SNK test); the stars denote statistically significant differences between the two accessions for each salinity level (* p = 0.05; ** p = 0.01; *** p = 0.001, n.s. not significant; t‐test). Table 4. Total biomass (mg∙plant−1 on dry weight) in response to different salinity levels.
Salinity Levels A6 A12 t‐test Mean
S0 1059 ± 141 A 1550 ± 124 A ** 1305 ± 127 A S1 620 ± 128 B 756 ± 68 B * 688 ± 72 B S2 257 ± 60 C 527 ± 73 C ** 392 ± 67 C mean 645 ± 115 944 ± 110 * 795 ± 105 The letters A–C denote statistically significant differences among salinity levels for each accession (p = 0.01; SNK test); the stars denote statistically significant differences between the two accessions for each salinity level (* p = 0.05; ** p = 0.01; n.s. not significant; t‐test). 3.3. Leaf Area, Number of Leaves, Stomatal Frequency, and Size The effect of salinity level on leaf area and number of leaves per plant are shown in Figure 4. For both accessions, mean leaf area decreased significantly from 2.6 cm2 to 1.6 cm2 moving from S0 to S1,
without differences between them; moving from S1 to S2, the leaf area of A6 decreased to 0.7 cm2, whereas accession A12 did not show any significant reduction in leaf area and was higher than A6. The number of leaves per plant in A6 was slightly lower than the corresponding values for A12. In all cases, however, increasing soil salinity levels decreased the number of leaves per plant. Stomatal frequency and size as function of soil salinity levels are shown in Figure 5. Stomatal frequency of both accessions did not vary when increasing salinity level from S0 to S1, remaining at about 128 mm−2. On the contrary, salinity level S2 produced a significant reduction in stomatal
frequency for both accessions, and this reduction was higher in A12 compared to the A6 accession.
Figure 3.Roots length (cm) in response to different salinity levels (S0, S1, and S2) of two accessions A6 and A12. a–c: the letters denote statistically significant differences among salinity levels for each accession (p = 0.01; SNK test); the stars denote statistically significant differences between the two accessions for each salinity level (* p = 0.05; ** p = 0.01; *** p = 0.001, n.s. not significant; t-test). 3.3. Leaf Area, Number of Leaves, Stomatal Frequency, and Size
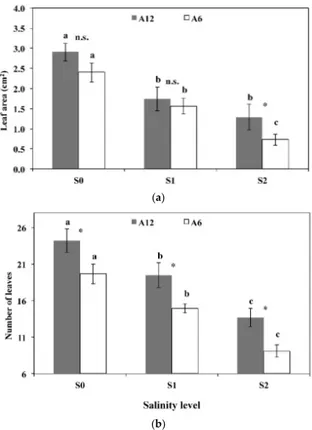
The effect of salinity level on leaf area and number of leaves per plant are shown in Figure4. For both accessions, mean leaf area decreased significantly from 2.6 cm2to 1.6 cm2moving from S0 to S1, without differences between them; moving from S1 to S2, the leaf area of A6 decreased to 0.7 cm2, whereas accession A12 did not show any significant reduction in leaf area and was higher than A6. The number of leaves per plant in A6 was slightly lower than the corresponding values for A12. In all cases, however, increasing soil salinity levels decreased the number of leaves per plant.Forests 2016, 7, 156 7 of 13
(a) (b) Figure 4. Leaves per plant (n) and leaf area (cm2) in response to different salinity levels (S0, S1, and S2) of two accessions A6 and A12. a–c: the letters denote statistically significant differences among salinity levels for each accession (p = 0.01; SNK test); the stars denote statistically significant differences between the two accessions for each salinity level (* p = 0.05; n.s. not significant; t‐test). (a) represents the leaf area under the different treatments, (b) represents the number of leaves under the different treatments.
Similar to the leaf area, stomatal length in accessions decreased significantly from 18.9 μm to 16.9 μm moving from S0 to S1, without differences between them; moving from S1 to S2, the stomatal length of A6 decreased to 15.5 μm, whereas accession A12 did not vary in stomatal length, being significantly higher than A6. Stomatal width of A12 showed the same response pattern as stomatal length as salinity increased.
3.4. Ecophysiological Parameters
The effects of the three salinity levels on physiological parameters of the two accessions are reported in Table 5. Moving from S0 to S2, the leaf water potential values decreased significantly from −2.2 to −3.0 MPa and from −2.3 to −3.1 MPa for A6 and A12, respectively, without differences between salinity levels S1 and S2. Moreover, accession A12 always showed more negative leaf water potential with respect to A6. Similarly, as salinity increased, stomatal conductance decreased, from 41 to 11 mmol H2O m−2∙s−1 (−73%) and from 42 to 31 mmol H2O m−2∙s−1 (−26%) for A6 and A12,
respectively. Nevertheless, for higher salinity levels, the A12 accession showed higher stomatal conductance than A6. The net assimilation rate decreased dramatically from 6.5 (S0) to 1.7 μmol CO2
m−2∙s−1 (S2), and from 6.7 (S0) to 2.3 μmol CO2 m−2∙s−1 (S2) for A6 and A12, respectively. Note that
accession A12 showed a significantly higher value of net assimilation rate (2.3 μmol CO2 m−2∙s−1) than Figure 4.Leaves per plant (n) and leaf area (cm2) in response to different salinity levels (S0, S1, and S2) of two accessions A6 and A12. a–c: the letters denote statistically significant differences among salinity levels for each accession (p = 0.01; SNK test); the stars denote statistically significant differences between the two accessions for each salinity level (* p = 0.05; n.s. not significant; t-test). (a) represents the leaf area under the different treatments; (b) represents the number of leaves under the different treatments.
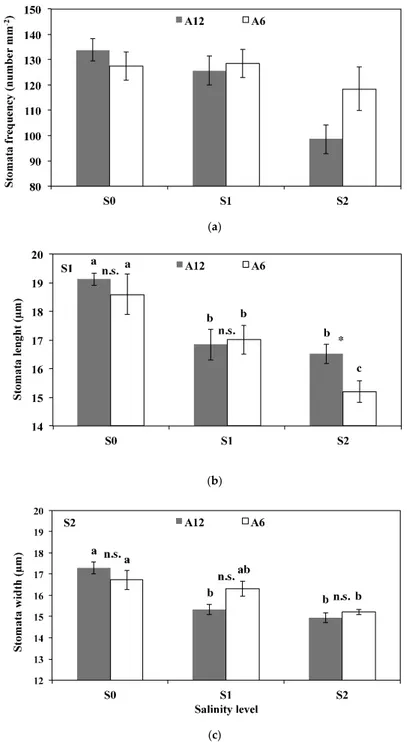
Stomatal frequency and size as function of soil salinity levels are shown in Figure 5. Stomatal frequency of both accessions did not vary when increasing salinity level from S0 to S1, remaining at about 128 mm´2. On the contrary, salinity level S2 produced a significant reduction in stomatal frequency for both accessions, and this reduction was higher in A12 compared to the A6 accession.
Forests 2016, 7, 156 8 of 13
A6 (1.7 μmol CO2 m−2∙s−1), only at S2. Finally, WUE followed the same trend of net assimilation rate,
decreasing from 3.1 (S0) to 1.9 (S2) μmol CO2 mmol∙H2O−1, and from 3.0 to 2.4 μmol CO2 mmol∙H2O−1
for A6 and A12, respectively. Moreover, A12 showed a significantly higher value than A6 at the higher salinity level (+26%). (a) (b) (c)
Figure 5.Stomatal frequency (n¨mm´2), length, and width (µm) in response to different salinity levels (S0, S1, and S2) of two accessions A6 and A12. a–c: the letters denote statistically significant differences among salinity levels for each accession (p = 0.01; SNK test); the stars denote statistically significant differences between the two accessions for each salinity level (* p = 0.05; ** p = 0.01, n.s. not significant; t-test). (a) represents the stomata frequency; (b) represents the stomata length; (c) represents the stomata width under the different treatments.
Forests 2016, 7, 156 8 of 12
Similar to the leaf area, stomatal length in accessions decreased significantly from 18.9 µm to 16.9 µm moving from S0 to S1, without differences between them; moving from S1 to S2, the stomatal length of A6 decreased to 15.5 µm, whereas accession A12 did not vary in stomatal length, being significantly higher than A6. Stomatal width of A12 showed the same response pattern as stomatal length as salinity increased.
3.4. Ecophysiological Parameters
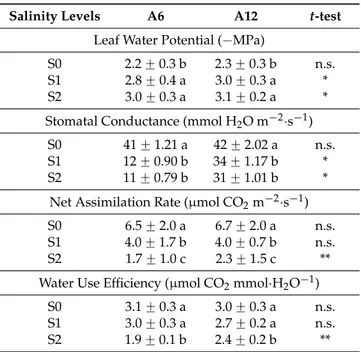
The effects of the three salinity levels on physiological parameters of the two accessions are reported in Table5. Moving from S0 to S2, the leaf water potential values decreased significantly from ´2.2 to ´3.0 MPa and from ´2.3 to ´3.1 MPa for A6 and A12, respectively, without differences between salinity levels S1 and S2. Moreover, accession A12 always showed more negative leaf water potential with respect to A6. Similarly, as salinity increased, stomatal conductance decreased, from 41 to 11 mmol H2O m´2¨s´1 (´73%) and from 42 to 31 mmol H2O m´2¨s´1 (´26%) for A6 and A12, respectively. Nevertheless, for higher salinity levels, the A12 accession showed higher stomatal conductance than A6. The net assimilation rate decreased dramatically from 6.5 (S0) to 1.7 µmol CO2m´2¨s´1 (S2), and from 6.7 (S0) to 2.3 µmol CO2 m´2¨s´1 (S2) for A6 and A12, respectively. Note that accession A12 showed a significantly higher value of net assimilation rate (2.3 µmol CO2m´2¨s´1) than A6 (1.7 µmol CO2m´2¨s´1), only at S2. Finally, WUE followed the same trend of net assimilation rate, decreasing from 3.1 (S0) to 1.9 (S2) µmol CO2mmol¨H2O´1, and from 3.0 to 2.4 µmol CO2mmol¨H2O´1for A6 and A12, respectively. Moreover, A12 showed a significantly higher value than A6 at the higher salinity level (+26%).
Table 5.Leaf water potential (´MPa), stomatal conductance (mmol H2O m´2¨s´1), net assimilation rate (µmol CO2m´2¨s´1), and water use efficiency (µmol CO2mmol¨H2O´1) (mean ˘ standard error) in response to different salinity levels (S0, S1, and S2) of two accessions, A6 and A12.
Salinity Levels A6 A12 t-test
Leaf Water Potential (´MPa)
S0 2.2 ˘ 0.3 b 2.3 ˘ 0.3 b n.s.
S1 2.8 ˘ 0.4 a 3.0 ˘ 0.3 a *
S2 3.0 ˘ 0.3 a 3.1 ˘ 0.2 a *
Stomatal Conductance (mmol H2O m´2¨s´1)
S0 41 ˘ 1.21 a 42 ˘ 2.02 a n.s.
S1 12 ˘ 0.90 b 34 ˘ 1.17 b *
S2 11 ˘ 0.79 b 31 ˘ 1.01 b *
Net Assimilation Rate (µmol CO2m´2¨s´1)
S0 6.5 ˘ 2.0 a 6.7 ˘ 2.0 a n.s.
S1 4.0 ˘ 1.7 b 4.0 ˘ 0.7 b n.s.
S2 1.7 ˘ 1.0 c 2.3 ˘ 1.5 c **
Water Use Efficiency (µmol CO2mmol¨H2O´1)
S0 3.1 ˘ 0.3 a 3.0 ˘ 0.3 a n.s.
S1 3.0 ˘ 0.3 a 2.7 ˘ 0.2 a n.s.
S2 1.9 ˘ 0.1 b 2.4 ˘ 0.2 b **
a–c: the letters denote statistically significant differences among salinity levels for each accession (p = 0.05; SNK test); the stars denote statistically significant differences between the two accessions for each salinity level (* p = 0.05; ** p = 0.01, n.s. not significant; t-test).
3.5. Total N and Cations in Biomass
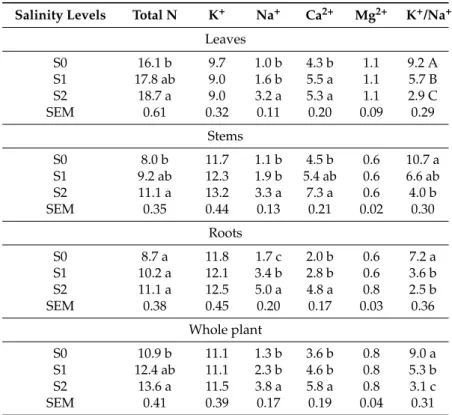
Table6shows the content of total N, potassium, sodium, calcium, magnesium, and the K/Na ratio of the three organs of the plant, obtained on samples of biomass including the two accessions. The total N content increased significantly in the whole plant, from S0 (10.9 mg¨g´1) to S2 (13.6 mg¨g´1).
The increase of total N uptake with increasing salinity affected the three plant components, resulting significantly only for leaves (from 16.1 to 18.7 mg¨g´1) and stems (from 8.0 to 11.1 mg¨g´1), while for roots a trend of increase was observed (from 8.7 to 11.1 mg¨g´1). Potassium content was in the average of 11.2 mg¨g´1and was not affected significantly. The mean content of sodium was 2.5 mg¨g´1, and it was tripled in the whole plant, from S0 (1.3 mg¨g´1) to S2 (3.8 mg¨g´1); it also showed a clear trend of the mastic tree plant accumulating the sodium in the root (3.3 mg¨g´1) rather than in the aerial part (2.0 mg¨g´1). However, a considerable increase of sodium with increasing salinity level was always detected in the three components. The low variability of the potassium content, combined with the tendency to increase the sodium content with increasing salinity, resulted in a considerable decrease of the Na/K ratio. The calcium content showed a significant increase from S0 to S2 in all plant components. On the contrary, calcium seems more accumulated in aerial components than in the roots. The magnesium content did not vary among treatments.
Table 6. Contents of total N, K+, Ca2+, Na+, and Mg2+in leaves, stems, and roots (mean ˘ SEM) in response to different salinity levels (S0, S1, and S2).
Salinity Levels Total N K+ Na+ Ca2+ Mg2+ K+/Na+
Leaves S0 16.1 b 9.7 1.0 b 4.3 b 1.1 9.2 A S1 17.8 ab 9.0 1.6 b 5.5 a 1.1 5.7 B S2 18.7 a 9.0 3.2 a 5.3 a 1.1 2.9 C SEM 0.61 0.32 0.11 0.20 0.09 0.29 Stems S0 8.0 b 11.7 1.1 b 4.5 b 0.6 10.7 a S1 9.2 ab 12.3 1.9 b 5.4 ab 0.6 6.6 ab S2 11.1 a 13.2 3.3 a 7.3 a 0.6 4.0 b SEM 0.35 0.44 0.13 0.21 0.02 0.30 Roots S0 8.7 a 11.8 1.7 c 2.0 b 0.6 7.2 a S1 10.2 a 12.1 3.4 b 2.8 b 0.6 3.6 b S2 11.1 a 12.5 5.0 a 4.8 a 0.8 2.5 b SEM 0.38 0.45 0.20 0.17 0.03 0.36 Whole plant S0 10.9 b 11.1 1.3 b 3.6 b 0.8 9.0 a S1 12.4 ab 11.1 2.3 b 4.6 b 0.8 5.3 b S2 13.6 a 11.5 3.8 a 5.8 a 0.8 3.1 c SEM 0.41 0.39 0.17 0.19 0.04 0.31
a–c: the letters denote statistically significant differences among salinity levels for each parameter (lowercase for p = 0.05; capital letter for p = 0.01; SNK test).
4. Discussion
The findings of this research give useful information about the abilities of adaptation, survival, and growth of different accessions of mastic trees grown in nursery conditions under salt stress. The salinity level led to depressive effects on all examined parameters, such as the percentage of survival, the production parameters, the morphological parameters, and the physiological parameters. A different response to changes in salinity with respect to the above parameters was also recorded in the two accessions. These results confirm that salinity is one of the major environmental factors limiting the growth and productivity of plants, as already confirmed by available literature [22–27].
Regarding the ability of the plant to survive in a saline environment, the two accessions can be characterized according to the model proposed by Maas and Hoffman [21], resulting in a high difference among studied accessions, as confirmed by the values of critical threshold, slope, and ECes50%. Moreover, using the ECes50% value, P. lentiscus can be classified as “tolerant” to salinity in terms
Forests 2016, 7, 156 10 of 12
of relative survival during the early growing stage, as also reported by Tattini et al. [2]. Furthermore, in the A12 accession, the high critical threshold value (17.23 dS¨m´1), very close to the maximum level of salinity used in this experiment, allowed the calculation of the slope value within a short residual range of salinity. Therefore, the real capacity of this accession to survive high levels of salinity could have been overestimated.
As expected, the salinity caused a significant reduction of both leaf area and number of leaves per plant. The same behaviour was observed for stomatal frequency and size. The values of stomatal frequency measured in this research resulted below the 325 stomata¨mm´2observed in adult trees by Gratani and Varone [28]. This result could be explained by the early age of the plants used in the experiment.
Leaf gas exchanges were hardly restricted when ECeovercame 12.5 dS¨m´1; similar behaviour was reported for adult trees with reduction of stomatal conductance, net assimilation rate [29,30], and leaf water potential [2]. As observed for stomatal parameters, ecophysiological data obtained were lower than those reported in the literature in the same plant species [29]. Finally, no data are available in the literature regarding WUE. The physiological parameters indicated stress symptoms; nevertheless, accession A12 showed a more tolerant behaviour with respect to accession A6, with a better leaf water status value and higher values of leaf gas exchanges and WUE.
With respect to the total N content of biomass, a trend of higher values was observed with increasing salinity level, confirming the findings obtained by Seema and Habib-ur-Rehmam [31] on Panicum turgidum. According to these authors, the increase of the N content seen after increasing the salinity may denote a corresponding increase in the accumulation of protein. According to Zidan and Elewa [32], salt stress can promote protein synthesis in plants through the transformation of free amino acids into protein. The salts containing sodium and calcium used for the different saline treatments determined an increase of these ions in all plant parts. The higher content of sodium found in the roots under the higher salt treatments, coupled with the largest contribution of the roots to the total biomass of the plant, could suggest a defence mechanism to sodium toxicity through the compartmentalization of this ion in roots, and its subsequent elimination through the radical turnover, determining the replacement of older (sodium saturated) roots with younger roots. This mechanism was previously observed in Salvadora oleoides [33]. The uptake of potassium and magnesium did not change based on the different levels of salinity, in agreement with the findings of other authors on different species [12,31,34]. Moreover, the ability of the mastic tree to maintain an adequate selectivity in the uptake of potassium under a saline environment is often associated with salinity tolerance [35].
5. Conclusions
Salinity affects about one-third of irrigated land, causing a significant reduction in the growth of plants. For this reason, researchers have paid considerable attention to this important environmental problem over the last decades. Based on our findings, the results suggested that P. lentiscus can tolerate and accumulate salt at high concentrations in nursery conditions. Moreover, considering the germplasm, a strong variability in response to salt stress was found. Thus, it is important to identify a germplasm highly tolerant to salinity in order to produce nursery seedlings. By identifying accessions of the mastic tree that are tolerant to high soil salinity, the revegetation of abandoned saline agricultural lands can be achieved—something that is encouraged by the current agricultural policies of the European Union.
Author Contributions:G.C. and E.C. conceived the experimental design; G.C., M.F., G.A.V. and E.C. performed field work; S.C. and G.A.V. analyzed the data; S.C., B.D.L. and E.C. led the writing of the paper.
References
1. Filella, I.; Llusià, J.; Piñol, J.; Peñuelas, J. Leaf gas exchange and fluorescence of Phillyrea latifolia, Pistacia lentiscus and Quercus ilex saplings in severe drought and high temperature conditions. Environ. Exp. Bot. 1998, 39, 213–220. [CrossRef]
2. Tattini, M.; Remorini, D.; Pinelli, P.; Agati, G.; Saracini, E.; Traversi, M.L.; Massai, R. Morpho-anatomical, physiological and biochemical adjustments in response to root zone salinity stress and high solar radiation in two Mediterranean evergreen shrubs, Myrtus communis and Pistacia lentiscus. New Phytol. 2006, 170, 779–794. [CrossRef] [PubMed]
3. Vasques, A.R.; Pinto, G.; Dias, M.C.; Correia, C.M.; Moutinho-Pereira, J.M.; Vallejo, V.R.; Santos, C.; Keizer, J.J. Physiological response to drought in seedlings of Pistacia lentiscus (mastic tree). New For. 2015, 1–12. [CrossRef]
4. Margaris, N.S. Adaptive strategies in plants dominating Mediterranean-type ecosystems. In Ecosystems of the World; di Castri, F., Goodal, D.W., Specht, R.L., Eds.; Elsevier: New York, NY, USA, 1981; Volume 11, pp. 309–315.
5. Gucci, R.; Aronne, G.; Lombardini, L.; Tattini, M. Salinity tolerance in Phillyrea species. New Phytol. 1997, 135, 227–234. [CrossRef]
6. Browicz, K. Pistacia lentiscus cv. Chia (Anacardiaceae) on Chios Island. Plant Syst. Evol. 1987, 155, 189–195. [CrossRef]
7. Zohary, D. The genus Pistacia L. In Taxonomy, Distribution, Conservation and Uses of Pistacia Genetic Resources; Padulosi, S., Caruso, T., Barone, E., Eds.; IPGRI: Rome, Italy, 1996; pp. 1–11.
8. Murillo, J.M.; Madejón, E.; Madejón, P.; Cabrera, F. The response of wild olive to the addition of a fulvic acid-rich amendment to soils polluted by trace elements (SW Spain). J. Arid Environ. 2005, 63, 284–303. [CrossRef]
9. Stellacci, A.M.; Cristiano, G.; Rubino, P.; de Lucia, B.; Cazzato, E. Nitrogen uptake, nitrogen partitioning and N-use efficiency of container-grown Holm oak (Quercus ilex L.) under different nitrogen levels and fertilizer sources. J. Food Agric. Environ. 2013, 11, 990–994.
10. Rinaldi, S.; de Lucia, B.; Salvati, L.; Rea, E. Understanding complexity in the response of ornamental rosemary to different substrates: A multivariate analysis. Sci. Hortic. 2014, 176, 218–224. [CrossRef]
11. De Lucia, B.; Cristiano, G. Composted amendment affects soil quality and hedges performance in the Mediterranean urban landscape. Compos. Sci. Utili. 2015, 23, 48–57. [CrossRef]
12. Gebauer, J.; El-Siddig, K.; Salih, A.A.; Ebert, G. Tamarindus indica L. seedlings are moderately salt tolerant when exposed to NaCl-induced salinity. Sci. Hortic. 2004, 103, 1–8. [CrossRef]
13. Barakat, N.; Laudadio, V.; Cazzato, E.; Tufarelli, V. Antioxidant potential and oxidative stress markers in wheat (Triticum aestivum) treated with phytohormones under salt-stress condition. Int. J. Agric. Biol. 2013, 15, 843–849.
14. Barakat, N.A.; Cazzato, E.; Nedjimi, B.; Kabiel, H.F.; Laudadio, V.; Tufarelli, V. Ecophysiological and species-specific responses to seasonal variations in halophytic species of the chenopodiaceae in a Mediterranean salt marsh. Afr. J. Ecol. 2014, 52, 163–172. [CrossRef]
15. USEPA, EPA. Oceans and Coastal Protection Division Report 842-B-92–010. In Plastic Pellets in the Aquatic Environment: Sources and Recommendations; EPA Publisher: Washington, DC, USA, 1992.
16. Shaviv, I. Autecology of Pistacia lentiscus L. Ph.D. Thesis, Science to the Senate of the Technion-Israel Institute of Technology, Haifa, Israel, June 1978.
17. Nahum, S.; Inbar, M.; Neeman, G.; Ben-Shlomo, R. Phenotypic plasticity and gene diversity in Pistacia lentiscus L. along environmental gradients in Israel. Tree Genet. Genomes 2008, 4, 777–785. [CrossRef] 18. Camposeo, S.; Palasciano, M.; Vivaldi, G.A.; Godini, A. Effect of increasing climatic water deficit on some leaf and stomatal parameters of wild and cultivated almonds under Mediterranean conditions. Sci. Hortic. 2011, 127, 234–241. [CrossRef]
19. Camposeo, S.; Vivaldi, G.A. Short-term effects of de-oiled olive pomace mulching application on a young super high-density olive orchard. Sci. Hortic. 2011, 129, 613–621. [CrossRef]
20. Scholander, P.F.; Hammel, H.T.; Bradstreet, E.D.; Hemmingsen, E.A. Sap pressure in vascular plants. Science 1965, 148, 339–346. [CrossRef] [PubMed]
Forests 2016, 7, 156 12 of 12
22. Greenway, H.; Munns, R. Effect of salinity on phosphate accumulation and injury in soybeans II. Role of substrate Cl´and Na+. Plant Soil 1980, 109, 65–71.
23. Ehret, D.L.; Plant, A.L. Salt tolerance in crop plants. In Environmental Stress in Crop Plants; Dhaliwal, G.S., Arora, R., Eds.; Commonwealth Publishers: New Delhi, India, 1999; pp. 69–120.
24. Hasegawa, P.M.; Bressan, R.A.; Zhu, J.K.; Bohnert, H.J. Plant cellular and molecular responses to high salinity. Ann. Rev. Plant Physiol. Plant Mol. Biol. 2000, 51, 463–499. [CrossRef] [PubMed]
25. Parida, A.K.; Das, A.B. Salt tolerance and salinity effects on plants: A review. Ecotoxicol. Environ. Saf. 2005, 60, 324–349. [CrossRef] [PubMed]
26. Cassaniti, C.; Romano, D.; Flowers, T.J. The Response of Ornamental Plants to Saline Irrigation Water; Intech: Vienna, Austria, 2012.
27. Beltrán-Morales, A.; Córdoba-Matson, M.V.; García-Hernández, J.L.; Troyo-Diéguez, E.; Azadi, H.; Ruiz-Espinoza, F.H.; Valdez-Cepeda, B.M.A. Salinity effects on germination and seedlings biomass of Pachycereus pecten-aboriginum: An endangered species. J. Prof. Assoc. Cactus Dev. 2015, 17, 107–122.
28. Gratani, L.; Varone, L. Adaptive photosynthetic strategies of the Mediterranean maquis species according to their origin. Photosynthetica 2004, 42, 551–558. [CrossRef]
29. Tattini, M.; Traversi, M.L. Responses to changes in Ca2+ supply in two Mediterranean evergreens, Phillyrea latifolia and Pistacia lentiscus, during salinity stress and subsequent relief. Ann. Bot. 2008, 102, 609–622. [CrossRef] [PubMed]
30. Barazani, O.; Golan-Goldhirsh, A. Salt-driven interactions between Pistacia lentiscus and Salsola inermis. Environ. Sci. Pollut. Res. 2009, 16, 855–861. [CrossRef] [PubMed]
31. Seema, M.; Habib-ur-Rehmam, A. Germination and growth of Panicum turgidum provenance under saline condition. Pak. J. Biol. Sci. 2003, 6, 164–166.
32. Zidan, M.A.; Elewa, M.A. Effects of salinity on germination, seedling and some metabolic changes in four plant species (Umbellifere). Indian J. Plant Physiol. 1995, 38, 57–61.
33. Ramoliya, P.J.; Pandey, A.N. Effect of increasing salt concentration on emergence, growth and survival of seedlings of Salvadora oleoides (Salvadoraceae). J. Arid Environ. 2002, 51, 121–132. [CrossRef]
34. Aragüés, R.; Puy, J.; Royo, A.; Espada, J.L. Three-year field response of young trees (Olea europaea L., cv. Arbequina) to soil salinity: Trunk growth and leaf ion accumulation. Plant Soil 2005, 271, 265–273. [CrossRef]
35. Ebert, G. Growth, ion uptake and gas exchange of two Annona species under salt stress. J. Appl. Bot. 1998, 72, 61–65.
© 2016 by the authors; licensee MDPI, Basel, Switzerland. This article is an open access article distributed under the terms and conditions of the Creative Commons Attribution (CC-BY) license (http://creativecommons.org/licenses/by/4.0/).