Temporal Trends in the Prevalence, Severity, and
Localization of Myocardial Ischemia and Necrosis at
Myocardial Perfusion Imaging After Myocardial
Infarction
Francesco Nudi, MD
a,b,*
, Orazio Schillaci, MD
c, Natale Di Belardino, MD
d,
Francesco Versaci, MD, PhD
e, Fabrizio Tomai, MD
f, Annamaria Pinto, MD
a,g,
Giandomenico Neri, MD
a, Enrica Procaccini, MD
a, Alessandro Nudi
b, Giacomo Frati, MD, MSc
h,i, and
Giuseppe Biondi-Zoccai, MD, MStat
h,iThe definition, presentation, and management of myocardial infarction (MI) have changed
sub-stantially in the last decade. Whether these changes have impacted on the presence, severity,
and localization of necrosis at myocardial perfusion imaging (MPI) has not been appraised to
date. Subjects undergoing MPI and reporting a history of clinical MI were shortlisted. We focused
on the presence, severity, and localization of necrosis at MPI with a retrospective single-center
analysis. A total of 10,476 patients were included, distinguishing 5 groups according to the period
in which myocardial perfusion scintigraphy had been performed (2004 to 2005, 2006 to 2007,
2008 to 2009, 2010 to 2011, 2012 to 2013). Trend analysis showed over time a significant
wors-ening in baseline features (e.g., age, diabetes mellitus, and Q waves at electrocardiogram), whereas
medical therapy and revascularization were offered with increasing frequency. Over the years,
there was also a lower prevalence of normal MPI (from 16.8% to 13.6%) and ischemic MPI
(from 35.6% to 32.8%), and a higher prevalence of ischemic and necrotic MPI (from 12.0% to
12.7%) or solely necrotic MPI (from 35.7% to 40.9%, p
<0.001). Yet the prevalence of severe
ischemia decreased over time from 11.4% to 2.0%, with a similar trend for moderate ischemia
(from 15.9% to 11.8%, p
<0.001). Similarly sobering results were wound for the prevalence of
severe necrosis (from 19.8% to 8.2%) and moderate necrosis (from 8.5% to 7.8%, p
= 0.028).
These trends were largely confirmed at regional level and after propensity score matching. In
conclusion, the outlook of stable patients with previous MI has substantially improved in the
last decade, with a decrease in the severity of residual myocardial ischemia and necrosis, despite
an apparent worsening in baseline features.
© 2017 Elsevier Inc. All rights reserved. (Am
J Cardiol 2017;120:1238–1244)
The main characterizations of myocardial infarction
(MI) are based on Q waves and ST segment changes at
electrocardiogram,
1–3thus distinguishing Q-wave versus
non-Q-wave MI and ST elevation MI (STEMI) versus non-ST
elevation MI (NSTEMI)
2–5. Improvements in MI prevention and
treatment have reduced its incidence, lead to fewer STEMI, and
globally improved its prognosis. Yet an aging population with
frequent co-morbidities implies that MI will remain a common
condition. Temporal trends in MI are well established, but there
are no precise data on temporal changes of myocardial
isch-emia or necrosis after MI. This is at odds with details on
myocardial ischemia in naïve patients
6. Awareness of trends in
myocardial ischemia and necrosis in stable patients after MI would
prove important to appraise the impact of current management
strategies and plan treatment and rehabilitation.
Methods
This is a sub-analysis of an ongoing retrospective study
based on our administrative myocardial perfusion imaging
(MPI) database, whose details have been already provided
elsewhere
6, 7. Patients provided written informed consent for
data collection and analysis, and the main retrospective study
was approved by the competent review board.
Patients undergoing MPI since 2004 for the diagnostic or
prognostic work-up of coronary artery disease and
report-ing MI (defined as the presence of clinical symptoms or signs
of myocardial ischemia, associated with increased cardiac
biomarkers, pathologic Q waves at the electrocardiogram,
aki-nesis or dyskiaki-nesis at left ventricle imaging studies) occurring
6 months or more before MPI were identified, excluding those
aged
<18 years. Stress testing was based on bicycle stress or
dipyridamole.
201Thallium (IBA Molecular Italy, Monza, Italy)
aService of Nuclear Cardiology, Madonna della Fiducia Clinic, Rome,
Italy;bETISAN, Rome, Italy;cDepartment of Nuclear Medicine, Tor Vergata
University, Rome, Italy;dDivision of Cardiology, Anzio-Nettuno Hospital,
Anzio, Italy;eDivision of Cardiology, S. Maria Goretti Hospital, Latina,
Italy;fDivision of Cardiology, European Hospital, Rome, Italy;gOstia
Radiologica, Rome, Italy;hDepartment of Medico-Surgical Sciences and
Bio-technologies, Sapienza University of Rome, Latina, Italy; andiDepartment
of AngioCardioNeurology, IRCCS Neuromed, Pozzilli, Italy. Manuscript re-ceived April 19, 2017; revised manuscript rere-ceived and accepted July 6, 2017.
This study was supported by ETISAN, Rome, Italy. See page 1244 for disclosure information.
*Corresponding author: Tel:+39 0678359705; fax: +39 0678462710.
E-mail address:[email protected](F. Nudi). 0002-9149/© 2017 Elsevier Inc. All rights reserved. https://doi.org/10.1016/j.amjcard.2017.07.007
was used for peak and rest single-photon emission
com-puted tomography. A dual-head gamma camera (Millennium
MG or Millennium MyoSIGHT, GE Healthcare, Milan, Italy)
was used for imaging.
Semiquantitative interpretation of stress or rest images was
performed based on a 7-region model, finally obtaining for
each region a 5-point scoring system (from 0 [normal uptake]
to 4 [severely reduced or absent uptake]). This score
di-rectly yielded 5 classes of maximal ischemia score, with the
final maximal ischemia score strictly depending on the worst
region of perfusion. Similarly, a maximal necrosis score was
computed, distinguishing 5 classes (from 0 [no necrosis] to
4 [severe necrosis]). Gated single-photon emission
com-puted tomography was used to appraise regional contractility
distinguishing 4 separate classes (0—normokinesis;
1—hypokinesis; 2—akinesis; 3—dyskinesis)
7, 8.
Continuous variables are reported as mean
± standard
de-viation. Categorical variables are reported as n (%). After
distinguishing patients in 5 groups according to the period
in which myocardial perfusion scintigraphy had been
per-formed (2004 to 2005, 2006 to 2007, 2008 to 2009, 2010 to
2011, 2012 to 2013). Bivariate analyses were performed using
analysis of variance and Cuzick tests for continuous
vari-ables and chi-square test for trend for categorical varivari-ables.
To adjust for baseline confounders, we computed a
propen-sity score for the 2004 to 2005 and 2012 to 2013 groups, and
matched patients 1:1 with a 0.001 propensity caliper. Then,
we performed unpaired t tests and chi-square tests on
propensity-matched patients. Statistical significance was set
at the 2-tailed 0.05 level, and p values unadjusted for
mul-tiplicity are reported throughout. Computations were performed
with Stata 13 (StataCorp, College Station, TX).
Results
A total of 10,476 patients were included in the analysis:
3,279 (31.3%) undergoing myocardial perfusion
scintigra-phy in 2004 to 2005, 2,385 (22.8%) in 2006 to 2007, 1,863
(17.8%) in 2008 to 2009, 1,613 (15.4%) in 2010 to 2011,
and 1,336 (12.8%) in 2012 to 2013 (
Table 1
). Trend
analy-sis highlighted several important temporal changes in baseline
and procedural features. Overall, these changes suggested a
significant worsening in the global risk profile of the
pa-tients, together with a shift toward more percutaneous
Table 1
Patient characteristics
Characteristic Period Total
(n= 10,476)
Overall p p for trend 2004-5 (n= 3279) 2006-7 (n= 2385) 2008-9 (n= 1863) 2010-11 (n= 1613) 2012-13 (n= 1336) Age (years) 63.7± 9.8 63.7± 10.2 64.6± 10.3 64.9± 10.3 66.1± 10.2 64.3± 10.1 <0.001 <0.001 Women 581 (17.7%) 424 (17.8%) 337 (18.1%) 307 (19.0%) 231 (17.3%) 1880 (18.0%) 0.760 0.730 Height (cm) 169.0± 7.6 169.1± 7.9 169.2± 7.9 169.5± 8.1 169.8± 8.0 169.3± 7.9 0.009 <0.001 Weight (kg) 77.7± 12.4 78.5± 12.9 79.2± 12.9 79.0± 13.5 79.6± 13.4 78.6± 13.0 <0.001 <0.001 Body surface area (m2) 1.90± 0.20 1.91± 0.20 1.92± 0.19 1.92± 0.20 1.93± 0.21 1.91± 0.20 <0.001 <0.001 Body mass index (kg/m2) 27.2± 3.6 27.4± 3.8 27.6± 3.9 27.4± 3.9 27.6± 3.9 27.4± 3.8 <0.001 0.002 Family history of CAD 1440 (43.9%) 1150 (48.2%) 971 (52.1%) 844 (52.4%) 716 (53.7%) 5121 (48.9%) <0.001 <0.001
Smokers 0.020 0.028 Never 865 (26.4%) 564 (23.7%) 477 (25.6%) 396 (25.6%) 334 (25.0%) 2636 (25.2%) Former 1854 (56.5%) 1433 (60.1%) 1057 (56.7%) 908 (56.3%) 738 (55.2%) 5990 (57.2%) Current 560 (17.1%) 387 (16.2%) 329 (17.7%) 309 (19.2%) 264 (19.8%) 1849 (17.7%) Dyslipidemia 2006 (61.2%) 1554 (65.2%) 1161 (62.3%) 1010 (62.6%) 840 (62.9%) 6571 (62.7%) 0.049 0.508 Diabetes mellitus <0.001 <0.001 None 2393 (73.0%) 1713 (71.9%) 1275 (68.4%) 1070 (66.3%) 868 (65.0%) 7319 (70.0%) Diet therapy 140 (4.3%) 139 (5.8%) 141 (7.6%) 106 (6.6%) 108 (8.1%) 634 (6.1%) Oral hypoglycemic agents 609 (18.6%) 434 (18.2%) 341 (18.3%) 339 (21.0%) 281 (21.0%) 2004 (19.1%)
Insulin 135 (4.1%) 98 (4.1%) 106 (5.7%) 98 (6.1%) 79 (5.9%) 516 (4.9%)
Prior percutaneous coronary intervention
1591 (48.5%) 1362 (57.1%) 1207 (64.8%) 1123 (69.6%) 974 (72.9%) 6257 (59.7%) <0.001 <0.001 Prior coronary artery bypass
grafting 747 (22.8%) 496 (20.8%) 355 (19.1%) 305 (18.9%) 226 (16.9%) 2129 (20.3%) <0.001 <0.001 Rest electrocardiogram Q waves 510 (15.6%) 524 (22.0%) 398 (21.4%) 300 (18.6%) 300 (22.5%) 2032 (19.4%) <0.001 <0.001 ST abnormalities 1134 (34.6%) 1088 (45.6%) 1078 (57.9%) 1058 (65.6%) 842 (63.0%) 5200 (49.6%) <0.001 <0.001 T abnormalities 253 (7.7%) 177 (7.4%) 137 (7.4%) 112 (6.9%) 102 (7.6%) 781 (7.5%) 0.905 0.599 Medical Rx
ACE inhibitor or AII blocker 2118 (64.6%) 1630 (68.3%) 1333 (71.6%) 1185 (73.5%) 951 (71.2%) 7217 (68.9%) <0.001 <0.001 Antiplatelet agent 2805 (85.5%) 2134 (89.5%) 1685 (90.5%) 1459 (90.5%) 1197 (89.6%) 9280 (88.6%) <0.001 <0.001 Beta-blocker 1834 (55.9%) 1485 (62.3%) 1232 (66.1%) 1137 (70.5%) 899 (67.3%) 6587 (62.9%) <0.001 <0.001 Calcium-channel antagonist 914 (27.9%) 600 (25.2%) 399 (21.4%) 297 (18.4%) 276 (20.7%) 2486 (23.7%) <0.001 <0.001 Nitrate 1312 (40.0%) 764 (32.0%) 517 (27.8%) 357 (22.1%) 244 (18.3%) 3194 (30.5%) <0.001 <0.001 Statin 2215 (67.6%) 1796 (75.3%) 1437 (77.1%) 1311 (81.3%) 1097 (82.1%) 7856 (75.0%) <0.001 <0.001
revascularizations, less surgical revascularizations, and
com-prehensive improvements in medical therapy. Temporal
changes in baseline features were mirrored by temporal
differences in stress features (
Table 2
).
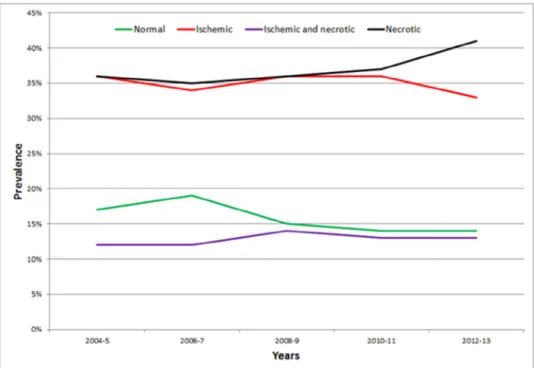
Analysis of temporal trends in MPI showed over the years
a lower prevalence of normal MPI (from 16.8% to 13.6%)
and ischemic MPI (from 35.6% to 32.8%), and a higher
preva-lence of ischemic and necrotic MPI (from 12.0% to 12.7%)
or solely necrotic MPI (from 35.7% to 40.9%, p
<0.001)
(
Figure 1
). Notably, the prevalence of severe ischemia
de-creased over time from 11.4% to 2.0%, with a similar trend
for moderate ischemia (from 15.9% to 11.8%) (
Figure 2
).
Simi-larly, favorable results for changes in the prevalence of severe
necrosis (from 19.8% to 8.2%) and moderate necrosis (from
8.5% to 7.8%, p
= 0.028) (
Figure 3
).
Moving from the patient to the regional level of analysis
(
Table 3
) showed a progressive increase in the prevalence of
apical, inferior, posterior, and lateral ischemia (all p
<0.05).
Necrosis was more common over the years in the anterior
proximal-mid, septal, inferior, and posterior regions (all
p
<0.001). Finally, regional akinesis or dyskinesis appeared
less common over time in the apical regions, but more common
in the septal and lateral regions (all p
<0.05).
Discussion
Coronary artery disease continues to carry a substantial
morbidity and mortality burden
1. Acutely, the risk of
arrhyth-mias or mechanical complications remains important, whereas,
chronically, the adverse effect on myocardial function
con-tinues to impact even on stable patients. Yet there have been
dramatic changes in the way MI presents and is approached
over the years
2–4. Physicians have modified substantially
their definitions and classifications, moving progressively
toward more sensitive albeit potentially less specific ones
4.
Incidence rates have also changed substantially, and overall
age- and sex-adjusted rates have declined, with an
accom-panying shift toward more NSTEMI than STEMI
5. In addition,
short- and long-term prognoses of MI have significantly
im-proved. Several factors play a role, on top of population trends
and patient features, including prevention, treatment, and
re-habilitation strategies. For instance, mechanical reperfusion
of STEMI and invasive management for NSTEMI have
become commonplace. Indeed, this is well shown locally,
as our center serves a large catchment area in the Lazio region
in Italy. Corresponding figures for the uptake of primary or
rescue percutaneous coronary intervention (PCI) or any PCI
for our period of interest highlight that in our region of more
than 5 million inhabitants, there were 1,428 primary or rescue
PCI and 8,428 any PCI in 2004, in comparison with as
many as 2,648 and 11,002, respectively, in 2013.
9Adjusting
for changes in the population size, this amounts to a ratio of
primary or rescue PCI per 10,000 inhabitants*year of 2.7 in
2004 and 4.5 in 2013, whereas the ratio for any PCI went
from 16.0 to 18.7. Although the successes of our fight
against MI are many, we continue to face the growing
epidemic of patients with heart failure, who feature, at
least in part, some of the very acute MI patients
Table 2
Stress and global myocardial perfusion imaging characteristics
Characteristic Period Total
(n= 10,476) Overall p p for trend 2004-5 (n= 3279) 2006-7 (n= 2385) 2008-9 (n= 1863) 2010-11 (n= 1613) 2012-13 (n= 1336) Exercise stress 2765 (84.3%) 2119 (88.9%) 1623 (87.1%) 1363 (84.5%) 1116 (83.5%) 8986 (85.8%) <0.001 0.241 Anginal pain during stress 371 (11.3%) 373 (15.6%) 364 (19.5%) 384 (23.8%) 385 (28.8%) 1877 (17.9%) <0.001 <0.001 % of predicted maximum heart rate 88.6± 7.8 87.7± 7.7 85.7± 8.1 88.0± 7.8 90.0± 7.8 88.0± 7.9 <0.001 0.096 Workload (Watt) 96.7± 37.5 99.2± 40.4 101.1± 38.5 107.3± 41.3 100.2± 38.7 100.2± 39.2 <0.001 <0.001 Metabolic equivalents of task 12.6± 4.6 12.8± 4.9 13.0± 4.7 13.8± 5.1 12.8± 4.7 12.9± 4.8 <0.001 <0.001 ST-segment deviation (mm) 1.86± 1.92 1.73± 2.02 1.65± 2.01 1.43± 1.99 1.31± 1.85 1.62± 1.96 <0.001 <0.001 Left ventricular ejection fraction (%) 50.0± 12.1 53.7± 12.4 54.7± 13.0 57.2± 14.1 56.1± 13.2 53.6± 13.1 <0.001 <0.001 End-diastolic volume index (mm/m2) 97.6± 48.7 88.3± 46.8 83.9± 44.9 77.7± 43.5 77.3± 40.9 87.1± 46.4 <0.001 <0.001 Myocardial perfusion scintigraphy
Overall test results <0.001 <0.001
Normal 552 (16.8%) 450 (18.9%) 272 (14.6%) 228 (14.1%) 182 (13.6%) 1684 (16.1%)
Ischemic 1166 (35.6%) 812 (34.1%) 661 (35.5%) 583 (36.1%) 438 (32.8%) 3660 (34.9%) Ischemic and necrotic 392 (12.0%) 283 (11.9%) 256 (13.7%) 210 (13.0%) 170 (12.7%) 1311 (12.5%) Necrotic 1169 (35.7%) 840 (35.2%) 674 (36.2%) 592 (36.7%) 546 (40.9%) 3821 (36.5%)
Maximal ischemia score <0.001 <0.001
No ischemia 1721 (52.5%) 1290 (54.1%) 946 (50.8%) 820 (50.8%) 728 (54.5%) 5505 (52.6%) Minimal ischemia 195 (6.0%) 182 (7.6%) 193 (10.4%) 214 (13.3%) 151 (11.3%) 935 (8.9%) Mild ischemia 469 (14.3%) 387 (16.2%) 362 (19.4%) 360 (22.3%) 274 (20.5%) 1852 (17.7%) Moderate ischemia 521 (15.9%) 411 (17.2%) 314 (16.9%) 193 (12.0%) 157 (11.8%) 1596 (15.2%) Severe ischemia 373 (11.4%) 115 (4.8%) 48 (2.6%) 26 (1.6%) 26 (2.0%) 588 (5.6%)
Maximal necrosis score <0.001 0.028
No necrosis 1718 (52.4%) 1262 (52.9%) 933 (50.1%) 811 (50.3%) 620 (46.4%) 5344 (51.0%) Minimal necrosis 233 (7.1%) 204 (8.6%) 187 (10.0%) 203 (12.6%) 234 (17.5%) 1061 (10.1%) Mild necrosis 399 (12.2%) 380 (15.9%) 348 (18.7%) 302 (18.7%) 269 (20.1%) 1698 (16.2%) Moderate necrosis 279 (8.5%) 208 (8.7%) 145 (7.8%) 127 (7.9%) 104 (7.8%) 863 (8.2%) Severe necrosis 650 (19.8%) 331 (13.9%) 250 (13.4%) 170 (10.5%) 109 (8.2%) 1510 (14.4%)
we have saved from death in the first place but who will
end up developing chronic complications of MI.
Temporal trends in stable naïve patients undergoing MPI
have already been analyzed in detail, highlighting an
in-crease in the prevalence of normal scans and an overall
improvement in the ischemic outlook
6, 10, 11. Yet there are no
studies to date focusing specifically on temporal trends in
myo-cardial ischemia and necrosis (or viability) in stable patients
Table 3
Regional myocardial perfusion imaging characteristics
Characteristic Period Total (n= 10,476) Overall p p for trend
2004-5 (n= 3279) 2006-7 (n= 2385) 2008-9 (n= 1863) 2010-11 (n= 1613) 2012-13 (n= 1336) Regional ischemia Apical 452 (13.8%) 315 (13.2%) 342 (18.4%) 276 (17.1%) 181 (13.6%) 1566 (15.0%) <0.001 0.024 Anterior distal 204 (6.2%) 112 (4.7%) 90 (4.8%) 70 (4.3%) 73 (5.5%) 549 (5.2%) 0.025 0.060 Anterior proximal-mid 177 (5.4%) 109 (4.6%) 82 (4.4%) 80 (5.0%) 86 (6.4%) 534 (5.1%) 0.064 0.400 Septal 129 (3.9%) 47 (2.0%) 42 (2.3%) 41 (2.5%) 45 (3.4%) 304 (2.9%) <0.001 0.105 Inferior 808 (24.6%) 554 (23.2%) 475 (25.5%) 426 (26.4%) 377 (28.2%) 2640 (25.2%) 0.010 0.003 Posterior 670 (20.4%) 433 (18.2%) 482 (25.9%) 380 (23.6%) 264 (19.8%) 2229 (21.3%) <0.001 0.031 Lateral 339 (10.3%) 271 (11.4%) 190 (10.2%) 152 (9.4%) 111 (8.3%) 1063 (10.2%) 0.042 0.018 Regional necrosis Apical 851 (26.0%) 604 (25.3%) 504 (27.1%) 437 (27.1%) 365 (27.3%) 2761 (26.4%) 0.535 0.159 Anterior distal 475 (14.5%) 329 (13.8%) 284 (15.2%) 239 (14.8%) 174 (13.0%) 1501 (14.3%) 0.398 0.623 Anterior proximal-mid 183 (5.6%) 114 (4.8%) 114 (6.1%) 125 (7.8%) 115 (8.6%) 651 (6.2%) <0.001 <0.001 Septal 231 (7.0%) 152 (6.4%) 156 (8.4%) 141 (8.7%) 123 (9.2%) 803 (7.7%) 0.003 <0.001 Inferior 492 (15.0%) 373 (15.6%) 336 (18.0%) 296 (18.4%) 286 (21.4%) 1783 (17.0%) <0.001 <0.001 Posterior 414 (12.6%) 302 (12.7%) 338 (18.1%) 282 (17.5%) 251 (18.8%) 1587 (15.2%) <0.001 <0.001 Lateral 227 (6.9%) 178 (7.5%) 132 (7.1%) 109 (6.8%) 89 (6.7%) 735 (7.0%) 0.876 0.618
Regional akinesis or dyskinesis*
Apical 365 (22.6%) 450 (19.2%) 349 (18.9%) 292 (18.2%) 249 (18.7%) 1705 (19.5%) 0.013 0.007 Anterior distal 95 (5.9%) 124 (5.3%) 107 (5.8%) 104 (6.5%) 92 (6.9%) 522 (6.0%) 0.294 0.078 Anterior proximal-mid 11 (0.7%) 12 (0.5%) 2 (0.1%) 14 (0.9%) 19 (1.4%) 58 (0.7%) <0.001 0.008 Septal 87 (5.4%) 101 (4.3%) 140 (7.6%) 134 (8.4%) 115 (8.6%) 577 (6.6%) <0.001 <0.001 Inferior 137 (8.5%) 102 (4.4%) 99 (5.4%) 118 (7.4%) 92 (6.9%) 548 (6.3%) <0.001 0.794 Posterior 117 (7.3%) 88 (3.8%) 94 (5.1%) 98 (6.1%) 85 (6.4%) 482 (5.5%) <0.001 0.526 Lateral 10 (0.6%) 31 (1.3%) 32 (1.7%) 38 (2.4%) 32 (2.4%) 143 (1.6%) <0.001 <0.001
* Regional wall motion analysis available in a total of 8,744 patients (respectively 1,616, 2,345, 1,848, 1,604, and 1,331).
Figure 2. Temporal trends in maximal ischemia score (MIS) at myocardial perfusion imaging in patients with a clinical history of myocardial infarction.
Table 4
Patient characteristics in propensity-matched patients from 2004 to 2005 and from 2012 to 2013
Period p 2004-5 (n= 853) 2012-13 (n= 853) Age (years) 65.1± 9.2 65.0± 10.3 0.732 Female gender 147 (17.2%) 148 (17.4%) 0.949 Height (cm) 169.6± 7.6 169.4± 7.8 0.538 Weight (kg) 79.2± 12.9 78.7± 12.8 0.419
Body surface area (m2) 1.93± 1.84 1.92± 1.88 0.369
Body mass index (kg/m2) 27.5± 3.8 27.4± 3.7 0.508
Family history of CAD 424 (49.7%) 432 (50.6%) 0.698
Smoking history 0.898 Never 213 (25.0%) 221 (25.9%) Former 479 (56.2%) 471 (55.2%) Current 161 (18.9%) 161 (18.9%) Dyslipidemia 545 (63.9%) 538 (63.1%) 0.725 Diabetes mellitus 0.461 None 583 (68.4%) 594 (69.6%) Diet therapy 54 (6.3%) 58 (6.8%)
Oral hypoglycemic agents 176 (20.6%) 153 (17.9%)
Insulin 40 (4.7%) 48 (5.6%)
Prior percutaneous coronary intervention 563 (66.0%) 568 (66.6%) 0.798
Prior coronary artery bypass grafting 169 (19.8%) 165 (19.3%) 0.807
Rest electrocardiogram
Q waves 170 (19.9%) 184 (21.6%) 0.403
ST abnormalities 452 (53.0%) 453 (53.1%) 0.961
T abnormalities 67 (7.9%) 67 (7.9%) 1
Medical Rx
ACE inhibitor or AII blocker 575 (67.4%) 590 (69.2%) 0.435
Antiplatelet agent 754 (88.4%) 755 (88.5%) 0.940
Beta-blocker 555 (65.1%) 551 (64.6%) 0.839
Calcium-channel antagonist 188 (22.0%) 200 (23.5%) 0.488
Nitrate 222 (26.0%) 203 (23.8%) 0.288
Figure 3. Temporal trends in maximal necrosis score (MNS) at myocardial perfusion imaging in patients with a clinical history of myocardial infarction.
Table 5
Stress and global myocardial perfusion imaging characteristics in propensity-matched patients from 2004 to 2005 and from 2012 to 2013
Characteristic Period p 2004-5 (n= 853) 2012-13 (n= 853) Exercise stress 722 (84.6%) 717 (84.1%) 0.739 Anginal pain during stress 118 (13.8%) 234 (27.4%) <0.001 % of predicted maximum
heart rate
88.5± 7.6 90.1± 7.7 <0.001 Workload (Watt) 93.5± 37.1 102.9± 38.1 <0.001 Metabolic equivalents of task 11.9± 4.5 13.2± 4.6 <0.001 ST-segment deviation (mm) 2.18± 1.94 1.21± 1.81 <0.001 Left ventricular ejection
fraction (%)
48.8± 11.9 57.0± 13.2 <0.001 End-diastolic volume index
(mm/m2)
101.3± 49.8 75.1± 38.6 <0.001 Myocardial perfusion
scintigraphy
Overall test results 0.425
Normal 109 (12.8%) 133 (15.6%)
Ischemic 288 (33.8%) 281 (32.9%)
Ischemic and necrotic 118 (13.8%) 113 (13.3%)
Necrotic 338 (39.6%) 326 (38.2%)
Maximal ischemia score <0.001
No ischemia 447 (52.4%) 459 (53.8%)
Minimal ischemia 39 (4.6%) 100 (11.7%)
Mild ischemia 133 (15.6%) 176 (20.6%)
Moderate ischemia 136 (15.9%) 100 (11.7%)
Severe ischemia 98 (11.5%) 18 (2.1%)
Maximal necrosis score <0.001
No necrosis 397 (46.5%) 414 (48.5%) Minimal necrosis 64 (7.5%) 143 (16.8%) Mild necrosis 122 (14.3%) 166 (19.5%) Moderate necrosis 83 (9.7%) 63 (7.4%) Severe necrosis 187 (21.9%) 67 (7.9%) Table 6
Regional myocardial perfusion imaging characteristics in propensity-matched patients Characteristic Period p 2004-5 (n= 853) 2012-13 (n= 853) Regional ischemia Apical 114 (13.4%) 120 (14.1%) 0.673 Anterior distal 50 (5.9%) 47 (5.5%) 0.754 Anterior proximal-mid 47 (5.5%) 57 (6.7%) 0.312 Septal 33 (3.9%) 35 (4.1%) 0.805 Inferior 205 (24.0%) 244 (28.6%) 0.032 Posterior 175 (20.5%) 161 (18.9%) 0.394 Lateral 98 (11.5%) 69 (8.1%) 0.018 Regional necrosis Apical 246 (28.8%) 233 (27.3%) 0.484 Anterior distal 140 (16.4%) 110 (12.9%) 0.040 Anterior proximal-mid 53 (6.2%) 72 (8.4%) 0.078 Septal 76 (8.9%) 73 (8.6%) 0.797 Inferior 147 (17.2%) 163 (19.1%) 0.315 Posterior 143 (16.8%) 146 (17.1%) 0.846 Lateral 64 (7.5%) 52 (6.1%) 0.248
Regional akinesis or dyskinesis*
Apical 123 (26.7%) 157 (18.5%) 0.001 Anterior distal 33 (7.2%) 58 (6.8%) 0.824 Anterior proximal-mid 4 (0.9%) 7 (0.8%) 0.935 Septal 35 (7.6%) 74 (8.7%) 0.482 Inferior 52 (11.3%) 57 (6.7%) 0.004 Posterior 41 (8.9%) 49 (5.8%) 0.033 Lateral 4 (0.9%) 17 (2.0%) 0.118
* Regional wall motion analysis available in a total of 1,310 patients (re-spectively 461 and 849).
with clinical MI. The present study aimed indeed to address
this issue. We found that, despite a worsening baseline profile
and an increase in the prevalence of abnormal scans, the
se-verity of myocardial necrosis and myocardial ischemia
improved over time, in keeping with similar favorable trends
on left ventricle dimension and systolic function. These results
confirm that our ongoing preventive, therapeutic, and
reha-bilitative efforts appear to have, at least in part, succeeded
in improving the outlook of patients with MI as far as
isch-emic and necrotic burden are concerned. Yet several unmet
needs remain, and it should be borne in mind that even minor
areas of necrosis may still impact detrimentally on patient
symptoms, signs, or prognosis (e.g., by promoting
arrhyth-mias or unfavorable remodeling).
This work has several limitations, including the
retrospec-tive design, the single-center setting, and the use of
administrative data. In addition, we relied on clinical history
and patient documents to define a clinical MI, and thus we
cannot exclude the impact of information bias, on top of
se-lection and referral bias. Another limitation is the lack of
ancillary testing modalities, including fractional flow reserve
(invasive or noninvasive) and coronary flow reserve
(inva-sive or noninva(inva-sive), which could have proven important for
both diagnostic and prognostic characterization of the patients
12.
Finally, complete revascularization during or after MI can also
impact on subsequent MPI results, but this detailed analysis
was beyond the scope of our work
13.
In conclusion, the outlook of stable patients with
previ-ous MI has substantially improved in the last decade, with a
decrease in the severity of residual myocardial and
necro-sis, despite an apparent worsening in baseline features
(
Tables 4–6
).
Disclosures
This study was supported by Etisan, Rome, Italy. Dr.
Biondi-Zoccai has consulted for Abbott Vascular and Bayer.
1. Ruff CT, Braunwald E. The evolving epidemiology of acute coronary syndromes. Nat Rev Cardiol 2011;8:140–147.
2. American College of Emergency Physicians, Society for Cardiovascu-lar Angiography and Interventions, O’Gara PT, Kushner FG, Ascheim DD, Casey DE Jr, Chung MK, de Lemos JA, Ettinger SM, Fang JC, Fesmire FM, Franklin BA, Granger CB, Krumholz HM, Linderbaum JA, Morrow DA, Newby LK, Ornato JP, Ou N, Radford MJ, Tamis-Holland JE, Tommaso CL, Tracy CM, Woo YJ, Zhao DX, Anderson JL, Jacobs AK, Halperin JL, Albert NM, Brindis RG, Creager MA, DeMets D, Guyton RA, Hochman JS, Kovacs RJ, Kushner FG, Ohman EM, Stevenson WG, Yancy CW. 2013 ACCF/AHA guideline for the management of ST-elevation myocardial infarction: a report of the Ameri-can College of Cardiology Foundation/AmeriAmeri-can Heart Association Task Force on Practice Guidelines. J Am Coll Cardiol 2013;61:e78–e140.
3. Amsterdam EA, Wenger NK, Brindis RG, Casey DE Jr, Ganiats TG, Holmes DR Jr, Jaffe AS, Jneid H, Kelly RF, Kontos MC, Levine GN, Liebson PR, Mukherjee D, Peterson ED, Sabatine MS, Smalling RW, Zieman SJ, American College of Cardiology, American Heart Asso-ciation Task Force on Practice Guidelines, Society for Cardiovascular
Angiography and Interventions, Society of Thoracic Surgeons, Ameri-can Association for Clinical Chemistry. 2014 AHA/ACC guideline for the management of patients with non-ST-elevation acute coronary syn-dromes: a report of the American College of Cardiology/American Heart Association Task Force on Practice Guidelines. J Am Coll Cardiol 2014;64:e139–e228.
4. Thygesen K, Alpert JS, White HD, Joint ESC/ACCF/AHA/WHF Task Force for the Redefinition of Myocardial Infarction, Jaffe AS, Apple FS, Galvani M, Katus HA, Newby LK, Ravkilde J, Chaitman B, Clemmensen PM, Dellborg M, Hod H, Porela P, Underwood R, Bax JJ, Beller GA, Bonow R, Van der Wall EE, Bassand JP, Wijns W, Ferguson TB, Steg PG, Uretsky BF, Williams DO, Armstrong PW, Antman EM, Fox KA, Hamm CW, Ohman EM, Simoons ML, Poole-Wilson PA, Gurfinkel EP, Lopez-Sendon JL, Pais P, Mendis S, Zhu JR, Wallentin LC, Fernández-Avilés F, Fox KM, Parkhomenko AN, Priori SG, Tendera M, Voipio-Pulkki LM, Vahanian A, Camm AJ, De Caterina R, Dean V, Dickstein K, Filippatos G, Funck-Brentano C, Hellemans I, Kristensen SD, McGregor K, Sechtem U, Silber S, Tendera M, Widimsky P, Zamorano JL, Morais J, Brener S, Harrington R, Morrow D, Lim M, Martinez-Rios MA, Steinhubl S, Levine GN, Gibler WB, Goff D, Tubaro M, Dudek D, Al-Attar N. Universal definition of myocardial infarction. Circulation 2007;116:2634– 2653.
5. Eisen A, Giugliano RP, Braunwald E. Updates on acute coronary syn-drome: a review. JAMA Cardiol 2016;1:718–730.
6. Nudi F, Neri G, Schillaci O, Pinto A, Procaccini E, Vetere M, Tomai F, Frati G, Biondi-Zoccai G. Time to and risk of cardiac events after myocardial perfusion scintigraphy. J Cardiol 2015;66:125– 129.
7. Nudi F, Pinto A, Procaccini E, Neri G, Vetere M, Tomai F, Gaspardone A, Biondi-Zoccai G, Schillaci O. A novel clinically relevant segmen-tation method and corresponding maximal ischemia score to risk-stratify patients undergoing myocardial perfusion scintigraphy. J Nucl
Cardiol 2014;21:807–818.
8. Nudi F, Di Belardino N, Pinto A, Procaccini E, Neri G, Schillaci O, Tomai F, Frati G, Biondi-Zoccai G. Assessment of the fate of myocar-dial necrosis by serial myocarmyocar-dial perfusion imaging. J Nucl Cardiol 2017;doi:10.1007/s12350-016-0751-5. Epub ahead of print.
9. National Italian Interventional Cardiology Statistics. Available at:https:// gise.it/Uploads/EasyCms/2016_gici_online_22388_7463.pdf. Accessed on June 19, 2017.
10. Rozanski A, Gransar H, Hayes SW, Min J, Friedman JD, Thomson LE, Berman DS. Temporal trends in the frequency of inducible myocar-dial ischemia during cardiac stress testing: 1991 to 2009. J Am Coll
Cardiol 2013;61:1054–1065.
11.Duvall WL, Rai M, Ahlberg AW, O’Sullivan DM, Henzlova MJ. A multi-center assessment of the temporal trends in myocardial perfusion imaging.
J Nucl Cardiol 2015;22:539–551.
12. Nudi F, Biondi-Zoccai G. Cadmium-zinc-telluride myocardial perfu-sion imaging: the dream of a single test gets nearer. J Nucl Cardiol 2017;doi:10.1007/s12350-017-0833-z. Epub ahead of print.
13. Quadri G, D’Ascenzo F, Moretti C, D’Amico M, Raposeiras-Roubín S, Abu-Assi E, Henriques JP, Saucedo J, González-Juanatey JR, Wilton SB, Kikkert WJ, Nuñez-Gil I, Ariza-Sole A, Song X, Alexopoulos D, Liebetrau C, Kawaji T, Huczek Z, Nie SP, Fujii T, Correia L, Kawashiri MA, García-Acuña JM, Southern D, Alfonso E, Terol B, Garay A, Zhang D, Chen Y, Xanthopoulou I, Osman N, Möllmann H, Shiomi H, Omedè P, Montefusco A, Giordana F, Scarano S, Kowara M, Filipiak K, Wang X, Yan Y, Fan JY, Ikari Y, Nakahashi T, Sakata K, Yamagishi M, Kalpak O, Kedev S, Varbella F, Gaita F. Complete or incomplete coronary revascularization in patients with myocardial infarction and multivessel disease. A propensity score analysis from the “real life” BleeMACS (Bleeding complications in a Multicenter registry of patients dis-charged with diagnosis of Acute Coronary Syndrome) registry.
EuroIntervention 2017;13:407–414. doi:10.4244/EIJ-D-16-00350. pii: