ISSN 2282-6483
How to Lockdown an Economy:
an Input Output Analysis
of the Italian Case
Paolo Manasse
G. Alfredo Minerva
Roberto Patuelli
Lorenzo Zirulia
Quaderni - Working Paper DSE N°1152
1
How to Lockdown an Economy: an Input Output Analysis of the Italian Case
Paolo Manasse, G. Alfredo Minerva, Roberto Patuelli, Lorenzo Zirulia University of Bologna, Italy
Abstract
This paper employs the most recent Input Output tables to discuss the Italian lockdown after the COVID-19 epidemics. We define “basic activities” and derive a ranking of industries which more intensively contribute to them. Confronting our results with the choices of the Italian government, we find that these were broadly correct in terms of industrial composition. However, we find that the lockdown of industries such as construction, real estate and manufacture of basic metals reveal a very conservative preferences in terms of the target share of output of essential activities (below 85 %).
Keywords: COVID-19; epidemic; lockdown; input-output JEL codes : D57, L52, L60
2
NON-TECHNICAL SUMMARY
The COVID-19 epidemic is confronting most countries in Europe, Asia, and America with the question of how to safeguard public health while minimizing the economic costs. After having downplayed the epidemic at its onset, in many countries the authorities have implemented lockdown policies of different intensity to halt contagion. While social distancing has produced notable improvements in arresting the epidemics at very high economic costs, its relaxation may lead to the feared “second wave” of contagion. In Italy, the first European country in which the epidemic has spread, the lockdown has been particularly strict, and after two months, it has threatened the fabric of the economy. The Italian lockdown, in terms of duration and coverage has been extremely severe, dictated by the fact that the national health system was overwhelmed by the spread of the disease. Since March 10, restrictions were applied uniformly in the country to prevent the spread from the North (Lombardy and Veneto) to the rest of the country.
Strengthened on March 22, the lockdown spared a few “essential activities”, those that were identified as satisfying the basic needs of the population.
The strategy for the lock-down (and re-opening) presents several shortcomings. Leaving aside the issue of whether the lockdown should apply uniformly across different geographical areas, the economic cost can be unnecessarily high if “key” industries are excluded and irrelevant ones included. An example of the former would be industries that enter the “essential ones” only indirectly, by providing intermediates to their direct inputs. The inclusion of non-necessary industries may instead give rise to costs in terms of the epidemic diffusion. Moreover, the lack of transparency about the criteria used to include or exclude different industries may raise doubts about the government’s independence from pressures of interest groups, keen to avoid the lock down.
This paper aims at presenting alternative criteria to prioritize different economic industries during the lockdown phase by exploiting the information contained in the Input-Output tables of sectoral
interdependence. The objective is to identify the industries that are necessary to satisfy the basic needs of the population. This criterion is associated to the following question. Suppose that we can identify the industries that satisfy the “basic needs” of the population (e.g. food, health, energy, administration): which industries should remain open for allowing these “essential activities” to operate at the desired production level? This allows us to compare our industry rankings with the government’s list of “essential activities”. The paper’s main conclusion is that the Italian government’s choices were broadly consistent with our criterion for what concern the choices of the industries to prioritize, although industries such as
construction, real estate and manufacture of basic metals should have featured among those considered as key for guaranteeing basic needs. However, our analysis shows that the government’ choices were likely biased towards restrictions, as they allowed the system to operate at a relatively moderate capacity.
3
1. Introduction
The COVID-19 epidemic is confronting most countries in Europe, Asia, and America with the question of how to safeguard public health while minimizing the economic costs. After having downplayed the epidemic at its onset, in many countries the authorities have implemented lockdown policies of different intensity to halt contagion. While social distancing has produced notable improvements in arresting the epidemics at very high economic costs, its relaxation may lead to the feared “second wave” of contagion. In September, Israel became the first country to impose a second locked down.
In Italy, the first European country in which the epidemic has spread, the lockdown has been particularly strict, and after two months, it has threatened the fabric of the economy. The IMF (2020) has estimated the epidemic’s economic cost for Italy at 9.6 percentage points of GDP. Other observers such as the OECD (2020) have put the cost, failing an appropriate response at EU level around of -10.1 negative growth of GDP, with a similar rise in the rate of unemployment; in August national Statistical Agency has estimated a 17.7 annual drop in annual GDP in the second quarter of 2020. The dual effect of the rise in borrowing needs and the fall in GDP could add around 25 points to the Italian debt/GDP ratio, currently standing at 133 percent.
The Italian lockdown, in terms of duration and coverage has been extremely severe, dictated by the fact that the national health system was overwhelmed by the spread of the disease. Since March 10, restrictions were applied uniformly in the country to prevent the spread from the North (Lombardy and Veneto) to the rest of the country. Strengthened on March 22, the lockdown spared a few “essential activities”, those that were identified as satisfying the basic needs of the population. The original list comprised items including both activities deemed necessary for every-day life (agriculture and fishing, food and beverage, pharmaceuticals, supermarket and food retailers, pharmacies, food, transport, retailers, health care, public administration and defense), together with other “activities” considered by common sense as “supportive” of the former (such as electricity, gas, garbage collection, transport, postal and banking services, and so on). Other countries implemented similar strategies, giving rise however to a variety of ‘essential activities” that, while sharing a similar logic, reflected local preferences (some of which rather stereotyped, including for example tobacconist in Italy, French fries stands in France and Belgium, “coffee” shops in the Netherlands and in San Francisco, weapons stores in Los Angeles and golf courses in Arizona) (The Washington Post, 2020).
Later, with the improvement of the health situation, the Italian government announced on April 26 a “gradual” reopening of industries to monitor the consequences for contagion. Rather unexpectedly, however, it decided to lift most restrictions since May 4, except for the retail and food service industry, which re-opened as of May 18. Other industries, such as cinema and theaters, resumed on June 15.
The strategy for the lock-down (and re-opening) presents several shortcomings. Leaving aside the issue of whether the lockdown should apply uniformly across different geographical areas, the economic cost can be unnecessarily high if “key” industries are excluded and irrelevant ones included. An example of the former
4
would be industries that enter the “essential ones” only indirectly, by providing intermediates to their direct inputs. The inclusion of non-necessary industries may instead give rise to costs in terms of the epidemic diffusion. Moreover, the lack of transparency about the criteria used to include or exclude different industries may raise doubts about the government’s independence from pressures of interest groups, keen to avoid the lock down.
In principle, an “optimal” policy rule for shutting down (and opening up) the economy should be contingent first of all on relevant “area - specific health indicators”, nation-wide health indicators, including for example the measures of diffusion of the virus, its reproduction rate, the share of contagion susceptible individuals, the capacity of the health system and so on. In addition, industry characteristics should matter, since industries may differ in their ability of maintaining safety measures, their labor intensity, and, most notable for our purposes, their role as intermediate input in supply chains.
The paper will not try to solve such a complicated “command economy” programming problem, which would require a very large amount of information; nor we will discuss the issue of the geographical allocation of output targets across regions, which we leave for future research. Our aim here is to present alternative criteria to prioritize different economic industries during the lockdown phase by exploiting the information contained in the Input-Output tables of sectoral interdependence.
Input-Output (I-O) analysis, introduced in the first half of the 1900s, is a relatively simple approach to analyze inter-industry productive relations and production disruptions (see, e.g., Rose and Liao 2005; He et al. 2015). Notwithstanding its limitations, the availability of I-O tables for several countries makes our approach easy to implement and adapt to national specificities.
We consider an intuitive criterion for ranking industries in the lockdown phase. This is specified in terms of production targets: the objective is to identify the industries that are necessary to satisfy the basic needs of the population. This criterion is associated to the following question.
Suppose that we can identify the industries that satisfy the “basic needs” of the population (e.g. food, health, energy, administration): which industries should remain open for allowing these “essential activities” to operate at the desired production level? The logic is to try to minimize economic activity to stop the spread of the epidemic, while guaranteeing the satisfaction of basic needs. Industries that feature high in the ranking are “key” because they directly or indirectly support such a minimal set of activities, and should be spared in the lockdown phase.
Italy is a particularly interesting case to analyze not only because the severity of the epidemic diffusion and death toll, but also because the Italian government, followed by other countries, started the lockdown phase by defining a list of “essential activities” which employed the same industrial classification used by the Italian Statistical Agency to define activities in the Input-output tables. This allows us to compare the industry rankings obtained with the first criterion with the government’s list.
5
The paper’s main conclusion is that the Italian government’s choices were broadly consistent with our criterion for what concern the choices of the industries to prioritize, although industries such as construction, real estate and manufacture of basic metals should have featured among those considered as key for guaranteeing basic needs. However, our analysis shows that the government’ choices were likely biased towards restrictions, as they allowed the system to operate at a relatively moderate capacity.
Our paper is part of the burgeoning economic literature spurred by the COVID-19 outbreak. A first stream of papers has put the trade-off between the health and economic cost of epidemic at the forefront, by explicitly incorporating a representation of the economy into epidemiological models (Acemoglu et al. 2020; Alvarez et al., 2020; Eichenbaum et al, 2020; Favero et al., 2020; Hall et al., 2020; Truse and Strock, 2020), with a few papers looking explicitly at the interaction among sectors (Baqaee et al. 2020; Barrot et al., 2020; Bodenstein et al., 2020; Cakmakli et al,, 2020). A general message coming from these papers is that optimal lockdown policy should imply high economic costs in the short-run in order to save lives, particularly in the presence of congestion in the health system, and that the reopening should follow gradually, targeting specific age groups and industries, so as to achieve herd immunity while reducing the economic costs. With respect to this literature, our approach qualifies the lower limit in lockdown strictness which is implied by the requirement to satisfy essential needs and provides an ordering of industries for a gradual reopening. A second strand of theoretical papers, absent epidemiological considerations, has analyzed the interaction of supply and demand shocks induced by an epidemic in a multi-sectoral economy (Baqaee and Fahri, 2020; Guerrieri et al., 2020). Exogenous variations in demand composition across epidemic phases, and their impact on supply, lies also at the core of our approach. Finally, and mostly related to our work, a few contributions have adopted Input-Output analysis. Particularly close is Barba Naveretti at al. (2020), who use Italian Input-output tables and the hypothetical extraction method (Dietzenbacher and Lahr, 2013) to identify a ranking of industries for the re-opening phase.
The outline of the paper is as follows. Section 2 briefly introduces the main elements of Input-Output analysis and discusses the indicators used in our rankings. In Section 3 we compare our results with the choices of the Italian government. Section 4 concludes.
2. Methodology
2.1 A brief exposition of Input-Output analysis
This section contains a brief exposition of the main tool used in this paper, Input-Output (I-O) analysis. Input-Output techniques have been used, since the first half of the 50s to investigate inter-sectoral productive relations and to estimate or simulate the direct and indirect effects of exogenous shocks or public policies on the economy. In particular, and relevantly for the present work, I-O analysis and its derivative techniques (such as Computable General Equilibrium models (CGE); see Rose 1995 for a review of their specificities) have been employed in evaluating the economic effects of production disruptions, for instance due to disasters. Rose and Liao (2005) use CGE to analyze economic resilience within disaster impact analyses. He et al. (2015) study energy imports based on different power generation portfolios. Okuyama and
6
Santos (2014) provide a review of the use of such techniques in these cases, and support their usefulness in particular in order to provide ballpark estimates of economic impacts of an event, or to plan countermeasures in the pre-event period.
I-O analysis allows researchers to calculate the value of each industry’s production that is required in order to satisfy a change in the demand of a particular industry or in the aggregate demand.
To describe the basics of input-output analysis, let us consider an economy composed of n industries. The squared (n x n) matrix A of technical coefficients describes the upstream and downstream relationships across industries. The element in row i and column j of A, aij, is defined as the quantity of goods or services from
industry i required for producing one unit of the output of industry j, based on the assumption that, in the short run, production technology is fixed and does not depend on relative factor prices. Denoting by x the vector (n x1) of production units, the ith element of the product vector Ax gives the quantity from industry
i that is used as intermediate input by all industries of the economy. Therefore, denoting by d the vector containing the quantities demanded for final use (consumption, exports, and investment), each industry’s production must satisfy both the demand of intermediate inputs and final demand: x = Ax + d. Thus, we can solve the I-O model as follows:
x = (In – A)–1d (1)
where In is an (n x n) identity matrix. The resulting (In – A)–1 matrix (let us refer to it as T matrix) is the
so-called “inverse matrix”. Its element tij has an interesting interpretation: it gives the quantity of production of
industry i that is required, directly and indirectly, as an intermediate for all industries, to produce one unit of output of industry j. This matrix is very useful. Consider the following example of a 3 x 3 matrix:
T = 𝑡𝑡𝑡𝑡1121 𝑡𝑡𝑡𝑡1222 𝑡𝑡𝑡𝑡1323
𝑡𝑡31 𝑡𝑡32 𝑡𝑡33
, (2) By summing the elements of the first row of T, we obtain the effect on industry 1’s output due to a unit increase in the demand for all industries.1 For example, an increase in the demand of 0.5 units (millions) in
industries 2 and 3 raises the production of industry 1 by ∆𝑋𝑋1= 𝑡𝑡12∗ 0.5 + 𝑡𝑡13∗ 0.5.
Such a (simple) use of the inverse matrix T is useful when one wants to evaluate each industry’s requirement as intermediate input, for supporting a given value of demand in other industries.
2.2 Industry ranking
In the “lockdown phase” we assume that the objective is to minimize economic activity subject to the constraint that basic needs are satisfied. In such an exercise, first we must define which are the “essential” activities, NB , that we want to support at current level. Then the objective is to find those “non-essential”
1 Similarly, by summing up the elements in the first column we obtain the “output multiplier” of industry 1, computed as: 𝑂𝑂1= ∑ 𝑡𝑡𝑖𝑖 𝑖𝑖1. This tells us the total production generated by a one-unit increase of demand in industry 1.
7
industries which happen to be required (because of intersectoral dependencies) more intensely to support the demand of the essential ones, assuming that they cannot be substituted by imports or pre-existing inventories. As mentioned above, by summing horizontally the elements of the inverse matrix T, we can estimate each industry’s production required by a given demand in multiple industries. Given that we want to simulate the requirements of given final demand for essential expenditures, we must weight each element tij of row i of T
by the level of final demand of industry j ∈NB. The vector of demand d is therefore made of positive (for j
∈NB ) or zero (for j ∉NB ) entries. The vector of production levels generated the demand of essential goods
is computed as:
𝐱𝐱 = 𝐓𝐓 ∗ 𝐝𝐝 (3) In this equation, the elements xi of the vector x represent the value of industry i production required by
demand for “essential goods”, and are given by the weighted sum ∑ 𝑡𝑡𝑖𝑖 𝑖𝑖𝑖𝑖𝑑𝑑𝑗𝑗. In Section 3, for each industry,
we will report the share of total output generated by the demand for essential goods, i.e, 𝑥𝑥𝑖𝑖 ∑ 𝑥𝑥⁄ 𝑖𝑖 𝑖𝑖.
3. An application to the Italian case
3.1 Background information on the Italian lockdown
The Italian lockdown of economic activities started with the Presidential decree Decreto del Presidente del Consiglio dei Ministri(DPCM) of11/03/2020, which severely limited retail trade, allowing only the sale of food and beverages, drugs, newspapers, fuels, electronic goods, and few other items. The DPCM also enforced the closure of bars, restaurant, pubs, allowing only home-delivery services. Services such as hairdressers, nail and beauty shops were shut down.
The DPCM of22/03/2020 initiated the toughest lockdown phase. The government defined a list of “essential activities” that were the only ones allowed to open. The Prime Minister declared: “The government decision is to close any production activity that is not strictly necessary, crucial, indispensable to guarantee essential goods and services. We worked … with the trade associations, to draw up a detailed list in which the value chains of the public utility services are indicated, those that are most necessary for the functioning of the State in this emergency phase”. The list was later modified by Decreto del Ministro dello Sviluppo Economico (DMiSE) 25/03/2020, which introduced some narrowly classified NACE industries, and dropped other ones. The DPCM of 10/04/2020 added some industries. For our purposes, we will refer to the list of industries in DMiSE of March 25 as the official government list.
Once the worst was over, the government allowed a substantial number of activities to reopen under strict conditions (DPCM 26/04/2020). Finally, from May 18 all retail trade activities were allowed. This date can be considered the end of the economic lockdown.
8
3.2 The list of essential activities
Initially, the government did not explicitly differentiate between “essential” activities, and those that were deemed necessary to support them. By contrast, to carry out the analysis, we need to define precisely which industry make it in the list of “essential activities”. Our list is somewhat arbitrary, although it is based on government statements. We employ the Input-Output analysis for calculating the most important “support activities”, and then we compare our results with the government list. Were crucial industries closed down and unnecessary ones left open?
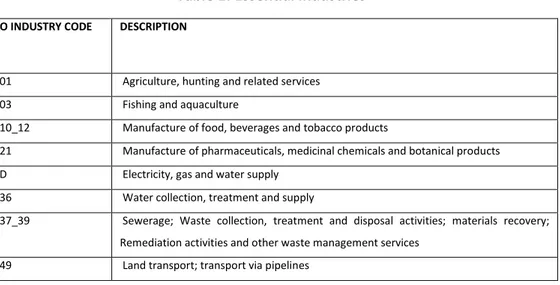
We label as “essential” the 23 industries that are listed in Table 1. The list includes food, energy, public administration and defense, transport, health services, insurance and finance, veterinary and social services. Our calculations are based on the I-O table for the Italian economy released by the Italian National Statistics Institute (ISTAT) in 2019. The table refers to the year 2015 and is based on a NACE Classification with 63 industries. Since the government often employed industries at a finer level of classification, sometimes up to the 6-digit disaggregation level, in order to compare our results with the government’s choices, we will adopt the following rule. We consider an industry to be “fully included” in the official list of activities when the industry is mentioned in a decree; “partly included” when some sub-industries are mentioned; and “excluded” in the remaining cases.
INSERT TABLE 1 ABOUT HERE
3.3 Ranking industries under the lockdown
In Table 2 we report, in descending order, the industries that in our calculations appear to contribute more, directly and indirectly, to the production of the essential industries listed in Table 1 (these are not included here).
INSERT TABLE 2 ABOUT HERE
The five industries that are most important for supporting basic needs are: 1) Wholesale trade (which excludes motor vehicles, motorcycles); 2) Legal and accounting activities; activities of head offices; management consultancy activities; 3) Security and investigation activities; services to buildings and landscape activities; office administrative, office support and other business support activities; 4) Construction; 5) Warehousing and support activities for transportation.
Among these activities, we find industries that make an intensive use of inputs from essential ones (“downstream” industries), such as wholesale trade, as well as industries that enter intensively as inputs of basic activities (”upstream” industries), such as business services of various kinds.
How does our ranking compare with the government’ list? Did the government lock down the “right” industries? Remember that an industry is considered “fully included” in the official list of activities when the industry is mentioned in a decree and therefore was kept open entirely , “partly included” when some sub-industries are mentioned, and the remaining were closed down; and “excluded” when these activities
9
were not mentioned and therefore were not allowed to operate. Thus, a minimal requirement for the government list would be that it should display the following property: “fully included” activities should contribute more to “basic need” than “partially included” ones, and in turn these should contribute more that “excluded” industries. Indeed, this requirement is satisfied: the contributions of fully, partially included and excluded industries to our essential activities are respectively 2.5, 1.1 and 0.4 percent.
A second metric for judging the government choices in the lock down is to look at the fraction of production of essential goods that is obtained when the industries in the government list are kept active. This information is contained in the second column of Table 2. The difficulty here is to measure the contribution of “partially included” activities. We provide lower and upper bounds by reclassifying these activities as “excluded” or “included”, respectively. We calculate that the government list would allow between 72.3% and 95.5% of the production of the essential industries. We expect the “true” contribution to be closer to the upper-bound of this range as individual activities listed are often a very substantial part of the industries which are not included in full.
Finally, a third way for using our ranking is to identify incrementally the industries that should be allowed to operate in a locked down economy, in order to reach some target level of production of essential industries. This is shown in Table 2, third column. In this exercise, all the 23 essential industries are assumed to fully operate. The other industries are added sequentially, starting from the most important to the less important according to the ranking of Table 2. The third column of the table shows these activities’ cumulated contribution to the production of the 23 essential industries. Implicit in this exercise is the assumption that the remaining inputs needed allow the operation of essential industries, other than those produced by the open industries, is imported from abroad. This is how to read Table 2. Suppose the government wants to produce 85% of basic needs’ production: this requires that the first top five industries in the ranking should be open. In other words, the table contains information on the governments “revealed preferences” as to what percentage of “essential” production to allow during the lock-down.
For example, with a target of 85% of essential activities, the wholesale trade, business support activities, and construction should be allowed to operate fully. However, we can see that these industries were only “partially included” in the official list. This implies that the government’s revealed preferences are consistent with a target for essential activities well below 85% of normal production. Obviously, as we raise the target threshold, say to 90%, our ranking includes mote industries, notably the Real estate which was completely locked down. Moving the target of basic need to 95% of normal capacity, we find other industries (Advertising; Manufacture of basic metals; Rental and leasing activities). that were completely shut down. Thus, our analysis suggest that the government choices were overall correct for what concerns the
composition of the activities could operate, at any given target, meaning the choice of the relative industries to achieve a given output level in terms of basic needs. However, the choices reveal a preference for a relatively restrictive target level of basic activities
.
10
4. Conclusions
Due to the COVID-19, many governments in the world decided a partial arrest of economic activity to implement social distancing. Some activities, different across countries, were allowed to operate for catering to basic needs of the population, and the remaining ones were closed. However, the choices were not motivated clearly, raising transparency issues, for example on the role interest groups. In general, the rationale of the choices was unclear: were “redundant” industries left out and “important” ones closed? This paper proposes definition of “essential” activities, those required for the functioning of the society, as well as of “important” industries. The formers are defined as those activities featuring in government official decrees. We define an “important industry” as one that directly or indirectly contributes more to “basic needs”. This is a useful exercise in two respects. The first is to provide a benchmark to evaluate government choices. The second is to provide an objective criterion should a new wave of contagion require a new (partial) lock-down of the economy. The analysis employs the most recent Input Output table for the Italian economy to generate a ranking of the industries which mostly contribute to basic needs. By calculating the cumulative production of basic activities achieved, the analysis shed light of the government revealed preferences for the degree of restrictiveness. The main result is that the governments decisions satisfy our minimum requirement that that the allowed industry should contribute more to basic needs that partially allowed or not allowed. This suggests that the composition of industries required to obtain aa given level of output was broadly correct. However, we find that the lockdown of industries such as construction, real estate and manufacture of basic metals reveals a very conservative preferences in terms of the target share of output of essential activities (below 85 %).
This study has not covered many crucial issues such as the consideration of regional specificities, of industries’ characteristics in terms of labor intensity and potential for “smart working”, nor has discussed the issue how to “optimally” re-open a locked down economy. We leave these topics for future research.
References
Acemoglu, D., Chernozhukov, V., Werning, I., Whinston, M. D. (2020) A multi-risk SIR model with optimally targeted lockdown (No. w27102). National Bureau of Economic Research.
Baqaee, D., & Farhi, E. (2020) Nonlinear production networks with an application to the covid-19 crisis (No. w27281). National Bureau of Economic Research.
Barba Navaretti, G., G. Calzolari, A. Dossena, A. Lanza, A.F. Pozzolo (2020) In and out lockdowns: Identifying the centrality of economic activities. Covid Economics 17: 189–204.
Barrot, J. N., Grassi, B., Sauvagnat, J. (2020) Sectoral effects of social distancing, mimeo.
Bodenstein, M., Corsetti, G., Guerrieri, L. (2020) Social distancing and supply disruptions in a pandemic, mimeo. Çakmaklı, C., Demiralp, S., Kalemli-Özcan, Ṣ., Yesiltas, S., Yildirim, M. A. (2020) COVID-19 and Emerging Markets: An Epidemiological Multi-Sector Model for a Small Open Economy with an Application to Turkey (No. w27191). National Bureau of Economic Research.
11
Dietzenbacher, E., M.L. Lahr (2013) Expanding Extractions. Economic Systems Research 25 (3): 341–360.
Eichenbaum, M. S., Rebelo, S., Trabandt, M. (2020) The macroeconomics of epidemics (No. w26882). National Bureau of Economic Research.
Favero, C. A., Ichino, A., Rustichini, A. (2020) Restarting the economy while saving lives under Covid-19, mimeo. Guerrieri, V., Lorenzoni, G., Straub, L., Werning, I. (2020) Macroeconomic Implications of COVID-19: Can Negative Supply Shocks Cause Demand Shortages? (No. w26918). National Bureau of Economic Research.
Hall, R. E., Jones, C. I., Klenow, P. J. (2020). Trading off consumption and covid-19 deaths (No. w27340). National Bureau of Economic Research
He, P., T.S. Ng, B. Su (2015) Energy Import Resilience with Input–Output Linear Programming Models. Energy Economics 50: 215–26.
IMF, World Economic Outlook, April 2020
Kruse, T., Strack, P. (2020) Optimal control of an epidemic through social distancing, mimeo.
OECD, OECD Interim Economic Assessment Coronavirus: Living with uncertainty 16 September 2020
Okuyama, Y., J.R. Santos (2014) Disaster Impact and Input–Output Analysis. Economic Systems Research 26 (1): 1–12. Rose, A. (1995) Input-Output Economics and Computable General Equilibrium Models. Structural Change and Economic Dynamics 6 (3): 295–304.
Rose, A., S.-Y. Liao (2005) Modeling Regional Economic Resilience to Disasters: A Computable General Equilibrium Analysis of Water Service Disruptions. Journal of Regional Science 45 (1): 75–112.
The Washington Post, March 2020, What counts as ‘essential’ during a coronavirus lockdown? Fries in Belgium, wine in France.
Table 1: Essential industries
I-O INDUSTRY CODE DESCRIPTION
V01 Agriculture, hunting and related services V03 Fishing and aquaculture
V10_12 Manufacture of food, beverages and tobacco products
V21 Manufacture of pharmaceuticals, medicinal chemicals and botanical products VD Electricity, gas and water supply
V36 Water collection, treatment and supply
V37_39 Sewerage; Waste collection, treatment and disposal activities; materials recovery; Remediation activities and other waste management services
12
V50 Water transport V51 Air transport
V53 Postal and courier activities V58 Publishing activities
V59_60 Motion picture, video and television programme production, sound recording and music publishing activities; Programming and broadcasting activities
V61 Telecommunications
V62_63 Computer programming, consultancy and related activities; Information service activities
V64 Financial intermediation, except insurance and pension funding
V65 Insurance, reinsurance and pension funding, except compulsory social security V66 Insurance and pension funding, except compulsory social security; Activities auxiliary to
financial intermediation
V74_75 Other professional, scientific and technical activities; Veterinary activities VO Public administration and defense; compulsory social security
VP Education
V86 Human health
V87_88 Residential care activities; Social work activities without accommodation Authors Calculations based on Istat Input Output Tables
Table 2: Ranking in terms of contribution to production of essential industries
Industries Status in the Italian
lockdown (DMiSE 25/03/2020)
Share in production of 23
essential industries Cumulated production of 23 essential industries
Wholesale trade, except motor vehicles, motorcycles Partially Active 0.0227 0.7918 Legal and accounting activities; activities of head offices;
management consultancy activities Active 0.0217 0.8136 Security and investigation activities; services to buildings and
landscape activities; office administrative, office support and other business support activities
Partially Active 0.0151 0.8287
Construction Partially Active 0.0135 0.8422
Warehousing and support activities for transportation Active 0.0127 0.8549 Real estate activities Non Active 0.0125 0.8674
13
Manufacture of coke and refined petroleum activities Active 0.0115 0.8788 Mining and quarrying Partially Active 0.0108 0.8896 Manufacture of chemicals and chemical products Partially Active 0.0104 0.9001 Architecture and engineering activities; technical testing and
analysis Active 0.0083 0.9083
Retail trade, except of motor vehicles and motorcycles Partially Active 0.0061 0.9145 Accommodation and food service activities Partially Active 0.0057 0.9202 Manufacture of fabricated metal products, except machinery
and equipment Partially Active 0.0055 0.9257
Advertising Non Active 0.0052 0.9309
Manufacture of machinery and equipment n.e.c. Partially Active 0.0051 0.9360 Manufacture of paper and paper products Partially Active 0.0049 0.9409 Manufacture of basic metals Non Active 0.0049 0.9458 Rental and leasing activities Non Active 0.0048 0.9506 Manufacture of rubber and plastic products Partially Active 0.0043 0.9549 Manufacture of electrical and optical equipment Partially Active 0.0042 0.9591 Manufacture of other non-metallic mineral products Partially Active 0.0040 0.9631 Manufacture of furniture; other manufacturing Partially Active 0.0038 0.9669 Printing and reproduction of recorded media Active 0.0038 0.9707 Manufacture of electrical equipment Partially Active 0.0035 0.9742 Manufacture of motor vehicles, trailers and semi trailers Non Active 0.0033 0.9775 Wholesale and retail trade and repair of motor vehicles and
motorcycles Partially Active 0.0026 0.9802
Manufacture of textiles; manufacture of wearing apparel;
manufacture of leather and related products Partially Active 0.0025 0.9826 Sports activities and amusement and recreaction activities Non Active 0.0024 0.9850 Manufacture of other transport equipment Non Active 0.0023 0.9873 Repair and installation of machinery and equipment Partially Active 0.0022 0.9895 Manufacture of wood and products of wood and cork, except
furniture; manufacture of articles of straw and plaiting materials Partially Active 0.0017 0.9912 Travel agency, tour operator reservation service and related
activities Non Active 0.0016 0.9928
Creative, arts and entertainment activities; Libraries, archives, museums and other cultural activities; Gambling and betting activities
Non Active 0.0016 0.9944
Employment activities Partially Active 0.0015 0.9960 Activities of membership organizations Active 0.0011 0.9971 Scientific research and development Active 0.0011 0.9981 Other personal service activities Non Active 0.0011 0.9992 Repair of computing machinery, and personal and household
goods Partially Active 0.0006 0.9998
14