2019
Publication Year
2021-01-18T09:09:33Z
Acceptance in OA@INAF
Acoustic oscillations and dynamo action in the G8 sub-giant EK Eridani
Title
BONANNO, Alfio Maurizio; CORSARO, ENRICO MARIA NICOLA; Del Sordo, F.;
Pallé, P. L.; Stello, D.; et al.
Authors
10.1051/0004-6361/201935834
DOI
http://hdl.handle.net/20.500.12386/29799
Handle
ASTRONOMY & ASTROPHYSICS
Journal
628
Number
https://doi.org/10.1051/0004-6361/201935834 c ESO 2019
Astronomy
&
Astrophysics
Acoustic oscillations and dynamo action in the G8 sub-giant
EK Eridani
?
,
??
A. Bonanno
1, E. Corsaro
1, F. Del Sordo
2,3, P. L. Pallé
4, D. Stello
5, and M. Hon
51 INAF – Osservatorio Astrofisico di Catania, Via S. Sofia, 78, 95123 Catania, Italy
e-mail: [email protected], [email protected]
2 Institute of Astrophysics, FORTH, 71110 Heraklion, Greece
3 Department of Physics, University of Crete, 70013 Heraklion, Greece 4 Instituto de Astrofísica de Canarias, 38205 La Laguna, Tenerife, Spain
5 School of Physics, University of New South Wales, Sydney, NSW 2052, Australia
Received 3 May 2019/ Accepted 2 July 2019
ABSTRACT
We present further evidence of acoustic oscillations in the slowly rotating overactive G8 sub-giant EK Eri. This star was observed with the 1m Hertzsprung SONG telescope at the Observatorio del Teide for two different runs of 8 and 13 nights, respectively, that were separated by about a year. We determined a significant excess of power around νmax= 253 ± 3 µHz in the first observing run and
were able to determine a large separation,∆ν = 16.43±0.22 µHz. No significant excess of power was instead detected in a subsequent SONG observing season, as also supported by our analysis of the simultaneous TESS photometric observations. We propose a new amplitude-luminosity relation in order to account for the missing power in the power spectrum. Based on the evolutionary stage of this object, we argue that a standard α2Ω dynamo cannot be excluded as the possible origin for the observed magnetic field. Key words. stars: activity – starspots – stars: rotation – asteroseismology – magnetohydrodynamics (MHD) –
stars: individual: EK Eri
1. Introduction
Although with different physical emphasis, both magnetic fields and acoustic oscillations are ubiquitous along the Hertzsprung-Russell diagram. In the case of the Sun, the activity level is correlated with the frequencies and power of the p-mode oscil-lations (Woodard & Noyes 1985; Palle et al. 1989; Libbrecht & Woodard 1990;Elsworth et al. 1990). In recent times, it has been possible based on the high-quality data of the CoRoT and Keplermissions to investigate the effect of magnetic activity in solar-like stars in a systematic fashion (e.g., see García et al. 2010).Chaplin et al. (2011) analyzed a sample of about 2000 solar-like stars, and evidence of pulsations was found in only about 540 stars. In particular, it was found that as the activity level increased, the number of detections decreased. A further analysis that made use of the Mount Wilson S-index chromo-spheric activity indicator reported an anticorrelation between the S-index and the amplitude of the acoustic modes (Bonanno et al. 2014). A possible explanation is the decrease of turbulent veloc-ities near the surface as a result of the magnetic field that reduces the efficiency of the convection (Dziembowski & Goode 2005;
Jacoutot et al. 2008).
?
A table of the radial velocities is only available at the CDS via anonymous ftp to cdsarc.u-strasbg.fr (130.79.128.5) or
via http://cdsarc.u-strasbg.fr/viz-bin/qcat?J/A+A/628/
A106
?? Based on observations made with the Hertzsprung SONG telescope
operated on the Spanish Observatorio del Teide on the island of Tener-ife by the Aarhus and Copenhagen Universities and by the Instituto de Astrofísica de Canarias.
The relevant question is understanding the physical mech-anism that underlies this process. The G8 sub-giant EK Eri (HR 1362, HD 27536) represents a unique opportunity to do this (we note that although the star is a spectroscopically determined sub-giant, its characteristic oscillation frequency, νmax, places
it firmly on the red giant branch). As first noted byDall et al.
(2010), the analysis of high-precision radial velocities obtained with the HARPS spectrograph has revealed a significant suppres-sion of the oscillation modes.
Because of its slow rotation (v sin i < 1 km s−1), brightness variations are consistent with a rotational period of ∼308 days because star spots are rotated across the projected surface of the star (Strassmeier et al. 1990,1999). Spectropolarimetric obser-vations (Aurière et al. 2008, 2011) have determined that the magnetic field geometry is dominated by a large-scale almost completely dipolar field with a strength of ∼200–250 G. This object is therefore significantly overactive with respect to its rotation rate and evolutionary state. It is strongly different from the normal period-activity relation (Aurière et al. 2015).
The physical explanation for the observed field in this object is still much debated. When conservation of the magnetic flux is assumed, EK Eri on the zero-age main sequence (ZAMS) would have had a field strength of a few kilogauss, which is well within the typical range for a magnetic Ap star (Stepien 1993). However, this simple assumption is almost certainly inadequate because as the star evolves off the main sequence, the growing outer con-vection zone interacts with the original field. Alternatively, a fos-sil field that acted as the seed for a growing dynamo-generated field may have emerged. The abundance pattern determined by
Dall et al.(2010) is very similar to the solar abundance pattern, however, which suggests that none of the anomalies could be
A&A 628, A106 (2019) attributed to the previous evolutionary status as a magnetic Ap
star.
Alternatively, in spite of its very low equatorial velocity, EK Eri might have produced enough differential rotation to host a genuine dynamo that generated the observed field. A recent investigation with Kepler data has shown that in con-trast to the well-established behavior at small Rossby numbers (the ratio of rotation period to the convective turnover time), the chromospheric activity of the more slowly rotating stars of the open cluster M 67 has been found to increase with increasing Rossby number (Brandenburg & Giampapa 2018). According to
Brandenburg & Giampapa(2018), slow rotators with high stellar activity might indeed be characterized by antisolar differential rotation.
The study of the acoustic spectrum of EK Eri will provide essential information to settle the question. Asteroseismology can precisely determine the evolutionary status of the star and therefore constrain its internal density stratification and determine the strength of the core-envelope coupling from the spectrum of mixed modes. However, the severe violation of the scaling relation for the amplitude (Kjeldsen & Bedding 1995) when compared to the value measured byDall et al.(2010), if properly interpreted, opens up a window into the details of the excitation mechanism of the acoustic modes in the presence of a strong surface magnetic field.
The new radial velocity measurements made with the Stellar Observations Network Group (SONG) spectrograph that were obtained in two different observational campaigns will pro-vide further epro-vidence for the presence of p modes in this star. Although it is strongly suppressed, the location of the excess of power in the power spectrum allowed us to obtain an estimate for the large separation in this star.
We therefore used this information to develop an internal model of the star, which we used in a spherical dynamo model to study possible dynamo actions in this object. We show that an α2Ω dynamo can be operative even if the Rossby number near
the base of the convection zone is greater than one. The resulting magnetic field topology is close to the observed topology.
We further suggests a modification of the standard amplitude-scaling relation of Kjeldsen & Bedding(1995) that takes into account the missing convective flux that is due the presence of a large spotted area. We argue that the nondetection of the oscillation modes in the second observational campaign is a consequence of a further decrease of the convection efficiency that is due to the strong fluctuations of the magnetic field, as observed inAurière et al.(2011).
The structure of the paper is as follows: in Sect.2we describe the observations and data reduction, Sect.3describes the results, Sect.4contains the results of a kinematic dynamo model applied to the star, and Sect.5is devoted to the conclusions.
2. Observations
Dall et al.(2010) reported the first detection of solar-like oscilla-tions in EK Eri based on about three nights of high-precision radial velocity observations with HARPS. However, the short length of their observation set only allowed them to estimate the frequency of the maximum oscillation power, νmax, which they
found to be 320 ± 32 µHz. Following this detection, we decided to perform new observations of the target to be able to better characterize its νmax and if possible, derive its large frequency
separation∆ν for the first time.
The new radial velocity time-series obtained for EK Eri come from observations made with the 1m Hertzsprung SONG
telescope at the Observatorio del Teide, for which its e´chelle spectrograph was used. The Hertzsprung telescope constitutes the first node of SONG. Observations were conducted for a total of about eight consecutive nights starting from 2 December 2017 with ∼312 individual data points, which means that we had about 40 points per night (see Fig.1). The spectra were reduced and calibrated using the SONG pipeline and an iodine cell for precise wavelength calibration. For more details about the characteris-tics and reduction pipeline of the Hertzsprung telescope, we refer toAndersen et al.(2014) andGrundahl et al.(2017). Because the star has an apparent magnitude of V ' 6.1, we chose a spec-tral resolution of 90 000 and an exposure time of 600 s through-out the run. A second observing run of ∼13 nearly consecutive nights was also performed in 2018, and we discuss its results in Sect.3.3.
2.1. Time-series analysis
The power spectrum of the velocity time-series was calculated as both an unweighted and weighted least-squares fit of sinu-soidal components following Corsaro et al. (2012; see also
Frandsen et al. 1995;Arentoft et al. 1998;Bedding et al. 2004;
Kjeldsen et al. 2005;Creevey et al. 2019). The resulting power was then converted into the power spectral density (PSD) by nor-malizing for the spectral resolution, which is calculated as the integral of the spectral window of the observing set, here cor-responding to ∼4.87 µHz. The purpose of testing the case of a weighted least-squares spectrum is to determine any improve-ments in the signal-to-noise ratio (S/N), which is relevant in order to increase the chances of detecting an oscillation envelope. Sim-ilarly to what has been done previously inCorsaro et al.(2012), we assigned a weight to each point of the radial velocity time-series that was given by the corresponding uncertainty estimate from the SONG pipeline. Because radial velocity uncertainties provided by the SONG pipeline might not necessarily be real-istic, we have corrected them for possible outliers following the approach presented byButler et al.(2004) that was also adopted byCorsaro et al.(2012). By measuring the amplitude of the noise level in the amplitude spectrum in the region 300 µHz up to the Nyquist frequency of ∼822 µHz, we found that the amplitude of the noise is 34.0 cm s−1and the maximum amplitude around ν
max
is 99.8 cm s−1in the unweighted case, while we have 33.5 cm s−1 and 106.0 cm s−1, respectively, in the weighted case. The
signal-to-noise ratio is slightly improved in the weighted spectrum, therefore we adopted this spectrum for the subsequent asteroseis-mic analysis.
2.2. Extraction of global seismic parameters
Similarly toCreevey et al. (2019), we used the Diamonds code (Corsaro & De Ridder 2014) for the Bayesian inference of the PSD of EK Eri. The model adopted consists of a simple flat-noise component and a Gaussian envelope to model the oscil-lation power excess (Corsaro & De Ridder 2014). To identify the power excess, we searched in a region close to the first νmax estimate published byDall et al. (2010). This region can
also be identified by means of the spectroscopic properties of log g and Teff obtained by Dall et al. (2010) because νmax ∝
g/√Teff(Brown et al. 2011). With the new estimate for νmax, by
Fredslund Andersen et al.(2019) to scale from the Sun, the spec-troscopic values yield νmax ≈ 300 µHz. This is well below the
limiting Nyquist frequency of our dataset. The resulting fit with Diamonds is shown in Fig. 2 (top panel), where the Gaussian-shape hump of the oscillations is centered at νmax= 253±3 µHz,
Fig. 1.Radial velocity time-series of EK Eri with SONG for the entire run in 2017; the details of the second observing night are shown in the inset. The time T0(BJD) of the first data point of the entire campaign is
also indicated.
Fig. 2. Top panel: power spectral density (in black) and background
model fit using Diamonds for EK Eri from the eight-night observation run in 2017. The red line shows the total fit including the oscillation power excess, and the dashed blue line below the oscillation hump rep-resents the flat-noise component. The inset shows the same spectrum, but in a log-log scale to help visualize the hump that is caused by oscilla-tions, which is also marked by a red arrow at νmax. A smoothing by 4∆ν,
with∆ν derived fromStello et al.(2009) using νmaxfrom our analysis
(solid green line), is also shown. Bottom panel: similar to the top panel, but here using the second observation run in 2018. The position of νmax
from the 2017 time-series is indicated by the red arrows, showing that there is no region where significant power excess is found.
with the uncertainty corresponding to the 68.3% Bayesian credi-ble interval (see Tacredi-ble1for a list of all the properties of this star). We additionally tested the significance of this region by means of a statistical model comparison against (1) a nondetection case (only flat noise); and (2) the selection of a different power hump, one at 330 µHz and another around 130 µHz, which represent the
Fig. 3.CRF of the region of the PSD of EK Eri centered around νmax
(in blue) for a search range between 1 and 30 µHz, where multiples of the daily aliasing at 11.57 µHz are clearly visible. The arrow indi-cates the peak corresponding to the position of the actual∆ν. The inset shows the result of applying the CRF to a smaller frequency range that excludes the main peaks from the daily aliases, between 13 and 20 µHz. In the inset, the red dashed curve represents a Gaussian fit to the CRF peak; the centroid and standard deviation of the Gaussian mark the value of∆ν and its corresponding uncertainty, as used in this analysis.
two closest neighbors to the one originally selected. In all cases we investigated, the result based on comparing the Bayesian evi-dence of each model (with and without the Gaussian envelope and between the different power humps we selected) yields a strong evidence condition (ln B > 5, where B is the Bayes fac-tor) in favor of the detection of the oscillation envelope centered at νmax= 253 µHz.
In addition to a statistical validation of the power excess, we estimated the characteristic frequency of the granulation compo-nent, bgran, using the photometric Transiting Exoplanet Survey
Satellite (TESS) observations of EK Eri (see Sect.3.4for more details). This approach provides an entirely independent verifi-cation of the expected value of νmaxfor our star because bgranand
νmaxare tightly related to one another (see, e.g.,Kallinger et al.
2014). By performing a background fit with Diamonds to the TESS PSD (Corsaro et al. 2017), we have that bgran= 230 µHz.
By inverting the power law that links bgran to νmax, as
obtained byKallinger et al.(2014), we have νmax,pred= 253 µHz,
which agrees excellently with our estimate from the SONG spectrum.
To determine the value of ∆ν, we instead focused on the region of the oscillations and computed a comb response func-tion (CRF) out of a set of the ten highest signal-to-noise ratio frequencies extracted by means of a CLEAN algorithm in the PSD region 200−300 µHz. For this purpose, we adopted a sim-ilar procedure as was presented inBonanno et al. (2008) that was later also applied byCorsaro et al.(2012). We first selected a wide range of values for ∆ν (1–30 µHz) in order to clearly locate a possible peak that is different than the multiples of the daily aliasing, 11.57 µHz. Then, we restricted our search range to a region where∆ν from scaling relations is expected (e.g., see
Stello et al. 2009), hence excluding the daily aliases at 11.57 and twice this value in order to enhance the signal of the expected ∆ν peak. The result is presented in Fig.3, which shows a peak of the CRF at∆ν = 16.43 ± 0.22 µHz.
Last, we also determined the maximum amplitude of the radial oscillations, Aosc, following the recipe presented by
A&A 628, A106 (2019) uncertainty reported in Table1is here obtained by
incorporat-ing the uncertainty on the background level of the PSD.
3. Results
3.1. Derivation of fundamental stellar properties
Because a Gaia DR2 parallax is available (Lindegren et al. 2018), we first computed a stellar radius based on this infor-mation, exploiting the interstellar reddening from the Panoramic Survey Telescope and Rapid Response Survey (PanSTARRS-1) 3D galaxy map (Green et al. 2015), the extinction-to-reddening ratio for stars with high galactic latitude fromFitzpatrick(1999), and a bolometric correction from Flower (1996) for a Teff =
5135 K star (Dall et al. 2010). The result obtained is RGDR2 =
4.91 ± 0.13 R . We note that although the Gaia DR2 parallax is
not within 1σ of the Hipparcos parallax for the same star, we still find a good agreement (well within 1σ) between our esti-mate of the stellar radius based on the Gaia DR2 parallax and that obtained byDall et al.(2010) using the Hipparcos parallax. After we obtained the global seismic parameters, we derived an estimate of the stellar mass and radius from asteroseismic scaling relations (e.g., Kjeldsen & Bedding 1995) using the relations M/M = νmax νmax, !3 ∆ν ∆ν !−4 T eff Teff, !1.5 (1) R/R = νmax νmax, ! ∆ν ∆ν !−2 T eff Teff, !0.5 (2)
for mass and radius, respectively, where we adopted Teff, =
5777 K and the new asteroseismic solar-SONG reference values (Fredslund Andersen et al. 2019), that is, νmax, = 3141±12 µHz,
∆ν = 134.98 ± 0.04 µHz. We note that the seismic radius
obtained in this work, Rseismic = 5.12 ± 0.15 R , is
compati-ble (within 1σ) with that derived using the Gaia DR2 parallax, and it has a precision of about 3%. We derive a seismic mass of Mseismic = 2.00 ± 0.14 M , which with a precision of about 7% is
in agreement with previous estimates proposed byAurière et al.
(2008), and in particular with the measurement obtained byDall et al.(2010) (well within 1σ). We also note that this value agrees with a mass derived using the spectroscopic log g fromDall et al.
(2010) and the new stellar radius obtained from Gaia DR2, cor-responding to about 2.16 M . However, we point out that
stan-dard (uncorrected) seismic scaling relations have the tendency to overestimate stellar radius and mass when applied to evolved stars (see, e.g.,Gaulme et al. 2016;Sharma et al. 2016). To miti-gate this problem,Kallinger et al.(2018) recently developed new nonlinear scaling relations. In order to determine possible incon-sistencies, we adopted these nonlinear relations for EK Eri and obtained Rnon-linear= 4.96 ± 0.14 R , Mnon-linear= 1.84 ± 0.12 R .
These values, although systematically lower, appear to still agree (within 1σ) with radius and mass estimates obtained from the standard scaling relations adopted in this work. The nonlinear scaling estimates are also compatible (within 1σ) with literature values fromAurière et al.(2008),Dall et al.(2010) and with the GaiaDR2 radius and log g-based mass. By exploiting the new Gaia parallax to derive the stellar luminosity, we find that the stellar luminosity agrees with the value derived by Dall et al.
(2010), but with the advantage that we estimated it with a preci-sion of about 2.3%, as opposed to the precipreci-sion of about 11% of the previous value.
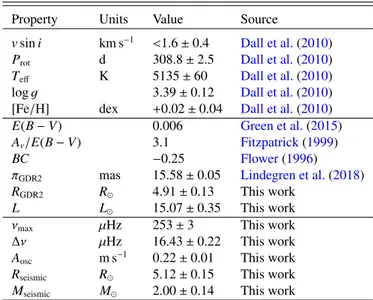
Table 1. Observed properties of EK Eri.
Property Units Value Source
vsin i km s−1 <1.6 ± 0.4 Dall et al.(2010)
Prot d 308.8 ± 2.5 Dall et al.(2010)
Teff K 5135 ± 60 Dall et al.(2010)
log g 3.39 ± 0.12 Dall et al.(2010)
[Fe/H] dex +0.02 ± 0.04 Dall et al.(2010)
E(B − V) 0.006 Green et al.(2015)
Av/E(B − V) 3.1 Fitzpatrick(1999)
BC −0.25 Flower(1996)
πGDR2 mas 15.58 ± 0.05 Lindegren et al.(2018)
RGDR2 R 4.91 ± 0.13 This work
L L 15.07 ± 0.35 This work
νmax µHz 253 ± 3 This work
∆ν µHz 16.43 ± 0.22 This work
Aosc m s−1 0.22 ± 0.01 This work
Rseismic R 5.12 ± 0.15 This work
Mseismic M 2.00 ± 0.14 This work
3.2. Suppression of the oscillation amplitude
As shown for instance byGarcía et al.(2010) andChaplin et al.
(2011), surface magnetic activity has the effect of suppressing the amplitude of solar-like oscillations because the convection mechanism becomes less efficient. By considering the scaling relation for oscillation amplitudes in radial velocity, proposed originally byKjeldsen & Bedding(1995),
Aosc=
L/L
M/M
(23.4 ± 1.4) cm s−1, (3)
and based on our derivation of the stellar luminosity and mass, we evaluate that the expected oscillation amplitude for EK Eri would be Aosc= 1.79 ± 0.11 m s−1. This value is clearly
signifi-cantly higher than what we measured from the actual PSD. It is higher by a factor of about eight, while it appears close to the value measured byDall et al.(2010), although it is about 30% higher.
We can interpret this fact in the following way. If the star has a large spotted area, the effective luminosity responsible for the amplitude in Eq. (3) is not L, but L−S σT4, where S is the area
of the spot and σ is the Stefan–Boltzmann constant. Therefore Eq. (3) can be rewritten as
Aspottedosc = β L/L M/M (23.4 ± 1.4) cm s−1, (4) where β = L −∆L L = 1 − S 4πR2 (5)
because∆L = S σT4. When we use our information about the suppression factor of the p-mode amplitude, we can easily invert Eq. (4) and estimate the effective spotted area, which is 88 ± 6% of the total surface of the star. It is encouraging to note that this estimate agrees roughly with the findings ofAurière et al.(2011; see in particular the topology of the radial field in their Fig. 6). Clearly, for a much less active star like the Sun, β ≈ 1, and we recover the standard scaling relation.
We note that when a Kepler calibrated amplitude-scaling relation such as the one proposed by Corsaro et al. (2013) (converted into a radial velocity amplitude according to the A106, page 4 of7
Fig. 4.Radial velocity time-series of EK Eri with SONG for the entire run in 2018; the detail of the second observation night is shown in the inset. The time T0(BJD) of the first data point of the entire campaign is
also indicated. No clear periodicity in the signal is visible.
relation by Kjeldsen & Bedding 1995) is used, we obtain Aosc= 1.24 m s−1, which is 30% lower than that predicted using
Eq. (3). Relative to this expected oscillation amplitude, the observed amplitude suppression is still a factor of almost six, and the spotted area estimated through Eq. (5) remains about 80% of the total visible surface of the star. However, we recall that the conversion from bolometric into radial velocity amplitude fol-lowingKjeldsen & Bedding(1995) is still not fully understood and that the derived Aosc in this latter case might be
overesti-mated (see, e.g.,Huber et al. 2011a).
3.3. Missing oscillatory signal in the second SONG time-series
In addition to the first observations of EK Eri that we presented in Sect.2, we attempted to observe the star one year later, using the same SONG instrumental setup, in order to gather a longer time-series and thus obtain a better frequency resolution in the resulting PSD. The new observations were conducted between 30 November 2018 and 17 December 2018, covering a total of about 13 nights and nearly 480 individual radial velocity mea-surements (see Fig.4for more details on the distribution of indi-vidual observation nights).
Observing conditions were very similar to the first observa-tions in 2017, and so was the noise level measured in the data, which is found to be 31.5 cm s−1as measured in the region from
300 µHz up to the Nyquist frequency. Nonetheless, by process-ing the time-series in the same manner as presented in Sect.2.1, we did not find any evidence for a power excess due to the oscil-lations in the frequency region of νmaxfrom Table1, as is visible
in the new PSD of the star (see Fig.2, bottom panel). Because the noise level of the new dataset is not higher than in 2017, we can exclude the noise in the PSD as the possible cause of a nondetection. In this regard, Aurière et al.(2011) noted that the magnetic field is subject to fluctuations on the order of 80 G from one year to another (see also their Table 1). We deem these fluctuations the likely cause of a variation in the level of sup-pression of the oscillations and therefore of the missing oscilla-tion power excess. According to the previous discussion, even a small increase in β can render the amplitude of the modes not observable because the level of the S/N is already low.
3.4. New TESS observations
From 15 November until 11 December 2018, EK Eri (TIC 37778297) was monitored by the recently launched NASA
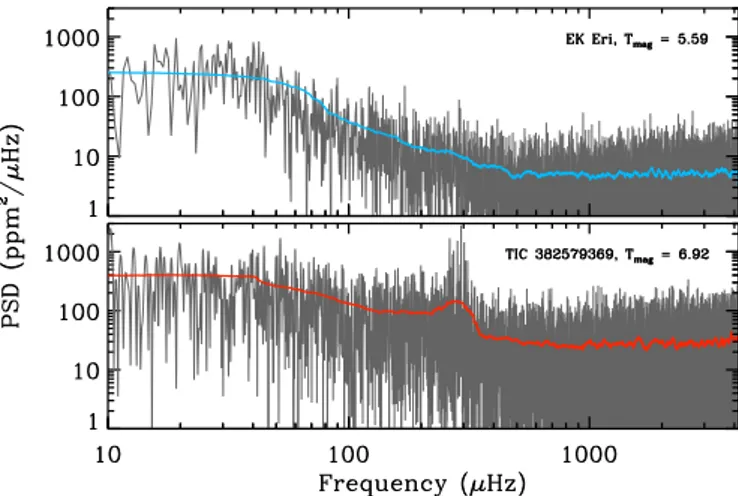
Fig. 5.Upper panel: PSD (in gray) for EK Eri using the TESS
obser-vations from sector 5. Lower panel: PSD of TIC 382579369, a star with a similar magnitude and νmaxto that of EK Eri. The colored solid lines
represent the smoothing by 4∆ν, similarly to Fig.2.
mission TESS (Ricker et al. 2014) in observing sector 5. This photometric observation is essentially simultaneous to that of our second SONG time-series that we presented in Sect.3.3. We can therefore assess the detectability of the oscillation envelope from both photometric and radial velocity datasets. To further aid this assessment, we also analyzed the TESS data of a star with similar νmaxand brightness as EK Eri. This serves as a
compar-ison star. We applied 4σ clipping to the TESS light curves and passed them through a high-pass filter (9.3 h-wide boxcar) with a cutoff frequency of 30 µHz to remove long-term trends. Finally, the light curves were gap-filled using the in-painting algorithm (Pires et al. 2015) to reduce the effect of spectral leakage of high power at low frequencies that could otherwise obscure the power-frequency profile of solar-like oscillations. The resulting power spectrum of EK Eri as observed with TESS is shown in Fig.5 (upper panel), where we also plot the TESS comparison star, TIC 382579369 (lower panel). The comparison between the two shows that the lack of a clear oscillation power excess in EK Eri is not the result of the star being too faint (the compar-ison star is even slightly fainter), but rather that EK Eri shows strongly suppressed oscillations. The absence of an oscillation bump in the TESS power spectrum of EK Eri therefore supports the conclusions drawn from the analysis of our second SONG time-series.
To further quantify the level of suppression, we also per-formed a background fit to the power density spectrum of TIC 382579369 with Diamonds, using the same approach as adopted by Corsaro et al. (2015,2017). In this way, we esti-mated the photometric amplitude of our TESS comparison star following the same procedure as used byKjeldsen & Bedding
(1995). We show the result in Fig.6, where the amplitude of TIC 382579369, of ∼22 ppm (star symbol), is compared to a sample of Kepler stars ranging from the main sequence (high νmax) to near the tip of the red giant branch (low νmax) that
were previously analyzed byHuber et al.(2011b) using the same method (see alsoCorsaro et al. 2013). In the same plot, we also show our estimated bolometric amplitude for EK Eri, 4.38 ppm, as obtained by converting the radial velocity amplitude from the SONG 2017 observing campaign into a bolometric amplitude according toKjeldsen & Bedding (1995). It is clear that while the amplitude of TIC 382579369 is in line with the “normal” trend from the Kepler sample, EK Eri falls significantly below what is expected for a star with a νmaxof about 200−300 µHz.
A&A 628, A106 (2019)
Fig. 6.Bolometric oscillation amplitudes for a sample of 1640 Kepler
stars (gray dots) analyzed byHuber et al.(2011b). The red star marks the amplitude of the comparison star TIC 382579369 (Fig. 5, lower panel) as measured in this work, while the blue square shows the ampli-tude of EK Eri obtained by converting its radial velocity ampliampli-tude into a bolometric amplitude. The earlier measurement byDall et al.(2010) is also shown with a yellow triangle.
4. Possible dynamo explanation
It is interesting to investigate the possibility that an α2 or αΩ
dynamo mechanism is at work in this star (Krause & Raedler 1980). In the standard αΩ dynamo (Parker 1955), the combined action of shear and mirror-antisymmetric turbulence regener-ates the initial poloidal field and closes the dynamo loop. The field configurations are in general rather complex, and the solu-tions are oscillatory. Conversely, if the shear is not dominant, the rotational helicity of the turbulence alone amplifies the seed field up to the observed values. The resulting field is static in general and the geometry is rather simple, mostly dipolar. Only the turbulent diffusivity η can be nonzero for a nonrotat-ing isotropic turbulence. Both mechanism are believed to be at work in the Sun (Bonanno 2013;Guerrero et al. 2016), although the effect of meridional circulation (together with a low-eddy diffusivity) is essential for reproducing the observed butterfly diagram.
The astrophysical parameters obtained in the previous sections provide us with important information about the evo-lutionary state of the star, in particular, with the extension of the convective zone and the efficiency of the turbulence. To this purpose we used the Catania version of the GARSTEC code (Weiss & Schlattl 2008;Bonanno et al. 2002a) to determine the interior structure of the star. In particular, we evolved from the ZAMS a 2 M model with an initial He abundance and metal
fraction Yi= 0.3 and Z/X = 0.045, respectively, up to a final age
of 0.965 Gyr in order to match the observed radius and lumi-nosity. No heavy-element diffusion was included, and we chose a mixing-length parameter αMLT= 1.65, as obtained from solar
calibration.
The relative importance of rotation and turbulence is described by the Coriolis numberΩ∗= 2Ωτ, where τ is the
con-vective turnover time and Ω is the surface angular velocity. In our case, this is on the order of unity in the bulk of the con-vection zone, and near the surfaceΩ∗ 1, as expected for such a slow rotator. The antisymmetric component of the turbulent electromotive force can be approximated with a pseudo-scalar of the type α(r) cos(θ). In particular for a small Coriolis num-ber (Ruediger & Kichatinov 1993; Küker & Rüdiger 1999),
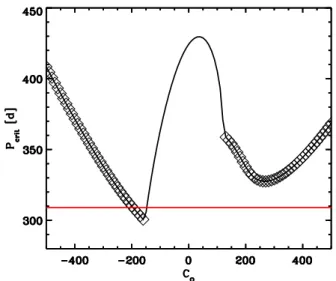
Fig. 7.Critical period as a function of CΩ, the critical dynamo number of
the differential rotation. Negative CΩindicates that the angular velocity
decreases outward. The diamond represents oscillatory solutions. The cycle periods are of about 50 years. The red line is the observed period.
α ≈ Ω∗∇ log(ρ)τu2 ≈ Ω`2/R where u is the (turbulent)
con-vective velocity field and ` ≈ 0.20R is the characteristic radial scale of the turbulence.
The equipartition field Beq = p4πρu is about 103G at the
bottom of the convection zone (rb = 0.4R) and reaches ∼100 G
near the surface. Although this value is about the same as the observed value, it would be difficult to explain the generation of a large, long-lasting spot without a large-scale field that is produced by a suitable dynamo action. We can model our igno-rance on the differential rotation by assuming a simple radial law of the type Ω = Ω0(r − ri)/R, whereΩ0 is the observed
equatorial angular velocity. With this definition, with a turbulent (eddy) diffusivity on the order of η ∼ 1014cm2s−1 (assuming
the mixing-length relation η= u`/3), the dynamo number of the shear CΩ= Ω0R2/η is about 250−300.
Is the rotational period of EK Eridani short enough to sup-port a dynamo action? A possible answer to this question can be obtained within the mean-field framework by solving the tur-bulent induction equation and determining the critical value of α that is required to obtain a self-sustained large-scale field. In particular, we used the CTDYN mean-field dynamo code pre-sented inBonanno et al.(2002b) that was further discussed and tested inJouve et al.(2010). The results are depicted in Fig.7. We computed the critical period Pcrit below which a dynamo
action is possible, and this is plotted as a function of the rota-tional shear CΩ. Negative CΩ implies that the angular velocity decreases in radius, diamonds represent critical oscillatory solu-tions, and the cycle periods range from 50 to 100 yr. A typical field configuration obtained with this approach is depicted in Fig.8for CΩ= 50.
5. Conclusions
The star EK Eri is a unique laboratory for studying the behavior of acoustic pulsations in the presence of a large-scale magnetic field. This is clearly an important question that at the moment is far from being completely understood.
From the observational point of view, we confirm the p-mode detection that has been discussed inDall et al.(2010), and we obtain a tentative measurement of the large separation for the A106, page 6 of7
Fig. 8.Field topology for CΩ= 50 (see text). The left hemisphere
rep-resents the isocontour lines of the toroidal field; blue levels show the negative and red levels the positive toroidal field. The right hemisphere represents the streamlines of the poloidal field. Blue levels show the counterclockwise and red levels the clockwise field lines. The black cir-cle represents the stellar surface.
first time in this star. We also propose to modify the standard amplitude-luminosity variation ofKjeldsen & Bedding(1995) in order to take the missing energy flux into account that is caused by a large spot.
Concerning the origin of the field in this object, we observe that the combined effect of rotation and turbulence is slightly supercritical and the dynamo action is thus possible. Moreover, a dynamo of the α2Ω type, or any dynamo characterized by an
α-tensor describing the standard mirror-antisymmetric turbulence, implies a dipolar-like magnetic field topology in the case of low values of CΩ. This is in agreement with observations, which sug-gest a dipolar topology of the field. Clearly, our result is heav-ily dependent on the assumed differential rotation. An approach based on numerical simulations is expected to clarify the ques-tion (Del Sordo et al., in prep.).
Acknowledgements. We would like to thank Tim Bedding for pointing out that the TESS data had become available for EK Eri while we were working on this paper. We thank the referee Thomas Kallinger for useful comments to our manuscript. E.C. is funded by the European Union’s Horizon 2020 research and innovation program under the Marie Sklodowska-Curie grant agreement No. 664931. Based on observations made with the Hertzsprung SONG telescope operated on the Spanish Observatorio del Teide on the island of Tenerife by the Aarhus and Copenhagen Universities and by the Instituto de Astrofísica de Canarias. The work of F.D.S. has been performed under the Project HPC-EUROPA3 (INFRAIA-2016-1-730897), with the support of the EC Research Innovation Action under the H2020 Programme; in particular, F.D.S. gratefully acknowledges the support and the hospitality of INAF Astrophysical Observa-tory of Catania.
References
Andersen, M. F., Grundahl, F., Christensen-Dalsgaard, J., et al. 2014,Revista Mexicana de Astronomia y Astrofisica Conference Series, 45, 83
Arentoft, T., Kjeldsen, H., Nuspl, J., et al. 1998,A&A, 338, 909
Aurière, M., Konstantinova-Antova, R., Petit, P., et al. 2008,A&A, 491, 499 Aurière, M., Konstantinova-Antova, R., Petit, P., et al. 2011,A&A, 534, A139 Aurière, M., Konstantinova-Antova, R., Charbonnel, C., et al. 2015,A&A, 574,
A90
Bedding, T. R., Kjeldsen, H., Butler, R. P., et al. 2004,ApJ, 614, 380 Bonanno, A. 2013,Sol. Phys., 287, 185
Bonanno, A., Schlattl, H., & Paternò, L. 2002a,A&A, 390, 1115
Bonanno, A., Elstner, D., Rüdiger, G., & Belvedere, G. 2002b,A&A, 390, 673 Bonanno, A., Benatti, S., Claudi, R., et al. 2008,ApJ, 676, 1248
Bonanno, A., Corsaro, E., & Karoff, C. 2014,A&A, 571, A35 Brandenburg, A., & Giampapa, M. S. 2018,ApJ, 855, L22
Brown, B. P., Miesch, M. S., Browning, M. K., Brun, A. S., & Toomre, J. 2011, ApJ, 731, 69
Butler, R. P., Bedding, T. R., Kjeldsen, H., et al. 2004,ApJ, 600, L75 Chaplin, W. J., Bedding, T. R., Bonanno, A., et al. 2011,ApJ, 732, L5 Corsaro, E., & De Ridder, J. 2014,A&A, 571, A71
Corsaro, E., Grundahl, F., Leccia, S., et al. 2012,A&A, 537, A9
Corsaro, E., Fröhlich, H.-E., Bonanno, A., et al. 2013,MNRAS, 430, 2313 Corsaro, E., De Ridder, J., & García, R. A. 2015,A&A, 579, A83 Corsaro, E., Mathur, S., García, R. A., et al. 2017,A&A, 605, A3 Creevey, O., Grundahl, F., Thévenin, F., et al. 2019,A&A, 625, A33 Dall, T. H., Bruntt, H., Stello, D., & Strassmeier, K. G. 2010,A&A, 514, A25 Dziembowski, W. A., & Goode, P. R. 2005,ApJ, 625, 548
Elsworth, Y., Howe, R., Isaak, G. R., McLeod, C. P., & New, R. 1990,Nature, 345, 322
Fitzpatrick, E. L. 1999,PASP, 111, 63 Flower, P. J. 1996,ApJ, 469, 355
Frandsen, S., Jones, A., Kjeldsen, H., et al. 1995,A&A, 301, 123
Fredslund Andersen, M., Pallé, P., Jessen-Hansen, J., et al. 2019,A&A, 623, L9 García, R. A., Mathur, S., Salabert, D., et al. 2010,Science, 329, 1032 Gaulme, P., McKeever, J., Jackiewicz, J., et al. 2016,ApJ, 832, 121 Green, G. M., Schlafly, E. F., Finkbeiner, D. P., et al. 2015,ApJ, 810, 25 Grundahl, F., Fredslund Andersen, M., Christensen-Dalsgaard, J., et al. 2017,
ApJ, 836, 142
Guerrero, G., Smolarkiewicz, P. K., de Gouveia Dal Pino, E. M., Kosovichev, A. G., & Mansour, N. N. 2016,ApJ, 819, 104
Huber, D., Bedding, T. R., Arentoft, T., et al. 2011a,ApJ, 731, 94 Huber, D., Bedding, T. R., Stello, D., et al. 2011b,ApJ, 743, 143
Jacoutot, L., Kosovichev, A. G., Wray, A., & Mansour, N. N. 2008,ApJ, 684, L51
Jouve, L., Brown, B. P., & Brun, A. S. 2010,A&A, 509, A32 Kallinger, T., De Ridder, J., Hekker, S., et al. 2014,A&A, 570, A41 Kallinger, T., Beck, P. G., Stello, D., & Garcia, R. A. 2018,A&A, 616, A104 Kjeldsen, H., & Bedding, T. R. 1995,A&A, 293, 87
Kjeldsen, H., Bedding, T. R., Butler, R. P., et al. 2005,ApJ, 635, 1281 Krause, F., & Raedler, K. H. 1980, Mean-field Magnetohydrodynamics and
Dynamo Theory(Oxford: Pergamon Press) Küker, M., & Rüdiger, G. 1999,A&A, 346, 922
Libbrecht, K. G., & Woodard, M. F. 1990,Nature, 345, 779
Lindegren, L., Hernández, J., Bombrun, A., et al. 2018,A&A, 616, A2 Palle, P. L., Regulo, C., & Roca Cortes, T. 1989,A&A, 224, 253 Parker, E. N. 1955,ApJ, 122, 293
Pires, S., Mathur, S., García, R. A., et al. 2015,A&A, 574, A18
Ricker, G. R., Winn, J. N., & Vanderspek, R. 2014,Society of Photo-optical Instrumentation Engineers (SPIE) Conference Series, 9143, 20
Ruediger, G., & Kichatinov, L. L. 1993,A&A, 269, 581
Sharma, S., Stello, D., Bland-Hawthorn, J., Huber, D., & Bedding, T. R. 2016, ApJ, 822, 15
Stello, D., Chaplin, W. J., Basu, S., Elsworth, Y., & Bedding, T. R. 2009, MNRAS, 400, L80
Stepien, K. 1993,ApJ, 416, 368
Strassmeier, K. G., Hall, D. S., Barksdale, W. S., Jusick, A. T., & Henry, G. W. 1990,ApJ, 350, 367
Strassmeier, K. G., Ste¸pie´n, K., Henry, G. W., & Hall, D. S. 1999,A&A, 343, 175
Weiss, A., & Schlattl, H. 2008,Ap&SS, 316, 99 Woodard, M. F., & Noyes, R. W. 1985,Nature, 318, 449