2017
Publication Year
2020-11-02T16:30:35Z
Acceptance in OA@INAF
Asteroid "one-sided" families: Identifying footprints of YORP effect and estimating
the age
Title
þÿPaolicchi, Paolo; Kne~evi, Zoran; Spoto, Federica; Milani, Andrea; CELLINO,
Alberto
Authors
10.1140/epjp/i2017-11628-0
DOI
http://hdl.handle.net/20.500.12386/28121
Handle
THE EUROPEAN PHYSICAL JOURNAL PLUS
Journal
132
Number
(will be inserted by the editor)
Asteroid “one-sided” families: identifying footprints of YORP
effect and estimating the age
Paolo Paolicchi1, Zoran Kneˇzevi´c2, Federica Spoto3, Andrea Milani4, and Alberto Cellino5 1 Dipartimento di Fisica, Universit`a di Pisa Largo Pontecorvo 7, 56127 Pisa, Italy
2 Serbian Academy of Sciences and Arts, Knez Mihailova 35, 11000 Belgrade, Serbia 3 Observatoire de la Cote d’Azur
4 Dipartimento di Matematica, Universit`a di Pisa Largo Pontecorvo 5,56127 Pisa, Italy 5 INAF, Turin Astrophysical Observatory
Received: 10/12/2016
Abstract. The reconstruction of the original properties of asteroids families, and the analysis of the changes due to the evolutionary effects (Yarkovsky, YORP, collisions and so on) is very difficult. Among the other problems, several families exhibit, in a plot magnitude vs. semimajor axis, a relevant asymmetry with respect to the largest remnant, which may be due to dynamical processes. In this paper, we introduce a mirroring tool, aimed to simulate the original properties of the families, and discuss how the mirrored families exhibit footprints of the YORP effect.
PACS. 96 Solar system; planetology
1 Introduction
In a recent series of papers [1] – [5], a new list of asteroid dynamical families has been defined, and for many of them an estimate of the age, based on the distribution of members in proper semimajor axis - inverse size plot, has been provided. The slope of the so-called V-plot has been considered as a signature of the Yarkovsky effect; in turn, this leads to an estimate of the time in which the effect has been at work, and thus of the age of the family.
In another recent paper [6] (hereinafter referred to as Paper I) the footprints of the YORP effect have been searched for in the similar V-plots (just considering the proper semimajor axis vs absolute magnitude H plane). The idea has been to look for the occurence of central depletion in the distribution of family members in proper semimajor axis ap,
the so-called YORP-eye, as function of the magnitude H. The best estimates of the locations of the YORP-eyes, based on the YORP age, have been shown to exhibit a strong correlation with these expected from the ages estimated by the slope method. However, the issue of the calibration of the expected values to get the same averages (the correlation is obviously insensitive to this procedure) remained unsolved, for which a theoretical analysis is urged.
There is, however, a more specific and limited problem, which will be discussed in the present paper. Many families exhibit an asymmetrical V-plot: in other words, the two wings of the proper semimajor axis distribution are not similar and the estimated slopes are different. This situation may arise for various reasons. Some families are originated in a cratering events, which are intrinsically anisotropical: the fragments may have been ejected all or most on one side with respect to the parent body, thus the V-plot can be asymmetrical. Note, however, that the instrinsic anisotropy of the cratering process causes asymmetry in the space of the proper elements, but not necessarily affecting the distribution of the semimajor axis (the asymmetry may appear only in the distribution of eccentricity, or of inclination). Moreover, some of these families (among them 4 Vesta) have undergone at least two major cratering events, thus the two wings may correspond to the ejecta of either of them: at least in principle, the two slopes of the plot, generally different in such a case, can indicate the individual ages of the two events. These cases are, however, not relevant for the present analysis.
A different source of asymmetry is present when the family is close to some resonant (or dynamically critical) region. In this case, the genuine family members, pushed into such a region during the family forming collisional event or subsequently drifting in it by the Yarkovsky effect, may have been removed or displaced. In other words, the family appears as truncated at a particular value of the semimajor axis, or at least severely depleted within the critical region. The present paper is devoted to discussion of a few cases of asymmetric families which may have been affected just by these dynamical processes.
2 Paolo Paolicchi et al.: Asteroid “one-sided” families: identifying footprints of YORP effect and estimating the age
2 The mirroring tool
In the V-plot of an asymmetrical family the proper semimajor axis of the largest remnant is usually strongly off-center, and thus different from the average (or the median) value of the family. The family appears less extended in a and with a smaller number of members on one side or the other of the largest remnant. As already noted, these features can be due to different causes, often connected to the formation process. In some cases, however, the family may have been born more symmetrical, and only the following dynamical evolution has given rise to the present properties. In these cases it is worth trying to reconstruct the original properties by means of the mirroring tool.
The idea is very simple. For a family under consideration we define a few “original symmetry axes”, i.e. values of ap for which the original V-plot is assumed to have been approximately symmetrical. Usually one or two of these
values are very close to that of the largest remnant, entailing a “natural” mirroring, but we have tested also other values, often, but not always, corresponding to a more moderate mirroring process.
Then, the mirrored family is created in the following way:
1. The wing which exhibits the larger number of members is kept as it is.
2. New “cloned” members are added to the original members of the other wing. The number of these new members is equal to the difference between the population of the two sides, in order to obtain a family with the two wings equally populated. They are chosen at random among the members of the “richer” wing, with a proper semimajor axis which is assumed exactly specular -with respect to the symmetry axis- to that of the cloned body.
3. In this way we obtain a new family with an increased number of members, which can grow close to twice the original membership, when the mirroring axis is chosen close to an extreme of the nominal family.
Fig. 1. The nominal 752 and four mirrored Sulamitis families.
In Figure 1 we show the result of this mirroring procedure. The family of (752) Sulamitis has been mirrored around four axes; note that the third is only slightly lower than that of the largest body (ap= 2.463 au), and the fourth one
immediately higher; thus the third and fourth mirrored familes are rather similar, with a similar number of members (346 and 349, from the “nominal” 189), with only a small offset in the ap of the mirrored bodies (and, in the latter
case, with a duplicated largest body). It is easy to see that the mirrored families are by far more symmetrical; their properties will be analyzed, in this paper, for the search of footprints of YORP effect. The task of this analysis is to understand how much this search is affected -unfavourably, we guess- by the dynamically driven evolution towards asymmetry.
Another example is represented in Figure 2. In this case the third mirroring is essentially around the largest mem-ber, while the fourth one refers to an extreme choice.
Fig. 2. The nominal 945 and four mirrored Barcelona families.
3 Some improvements to the YORP-eye analysis
In this paper we have analysed six families, and their mirrored siblings, using essentially the same method described in Paper I. After some additional work and testing we have, however, introduced a few moderate changes, also in view of a forthcoming improved and extended analysis of the whole sample of available families:
– We have redefined the H value of the computed maximum of the depletion parameter R; we are now associating the average value in the “box” (see below) and not the H value of the first (i.e. the largest) family member with the local value of R. Obviously this new choice moves the computed maxima to somewhat higher H values. The calibration (0.912 mag) discussed in Paper I, and required to obtain equal averages between computed and expected maxima, thus becomes too small and should be adjusted to account for the shift. As already implied above, we are not trying to solve this problem in the present paper, devoted to a low number of peculiar families. The problem will rather be discussed in the forthcoming general analysis.
– In general we are willing to extend our analysis to smaller families; already in the present paper we discuss a case with less than 250 members, the lower limit for reliable family analysis adopted in Paper I. Thus, we have decided to downsize the “running box” used for our computations, from the 100 bodies used in Paper I, to 50 for most families, and also to 30 for families with a small number of members. Several, even if not all, tests have demonstrated that the results are not significantly affected by the change.
– In Paper I we briefly discussed the similarity of our R, H test to a possible test based on the behaviour of the Kurtosis of the distribution as function of H. We have, therefore, implemented in the code the computation of various momenta of the a distribution, including Skewness and Kurtosis ([7]). In the present paper we are not performing a systematic comparison, but we rather show one example, confirming the agreement between the conclusions drawn on the basis of our R test and those obtainable from the analysis of the excess Kurtosis.
4 Results
In the present paper we have analysed six asymmetrical families, i.e. families of (25) Phocaea, (145) Adeona, (752) Sulamitis, (945) Barcelona, (1658) Innes and (3827) Zdenekhorsky. These families have been chosen due to the presence, in their pertaining range of semimajor axis, of resonant and unstable regions.
Among them (752) Sulamitis has a dominant (in size) largest remnant, thus it is probably a family formed by cratering, while (1658) Innes and (3827) Zdenekhorsky are the result of a very intense fragmentation. The others are intermediate cases. Obviously the mirroring tool may (or may not) work in the cases of cratering families (see the considerations above), and the identification of mirroring axis is less obvious for the intensely fragmented families. However we have applied the method to all these cases, also to understand how it works.
Since we have already presented plots for the families 752 and 945, the asymmetric V-plots of the other four are summarized in Figure 3.
Fig. 3. V-plots of the nominal families 25, 145, 1658 and 3827.
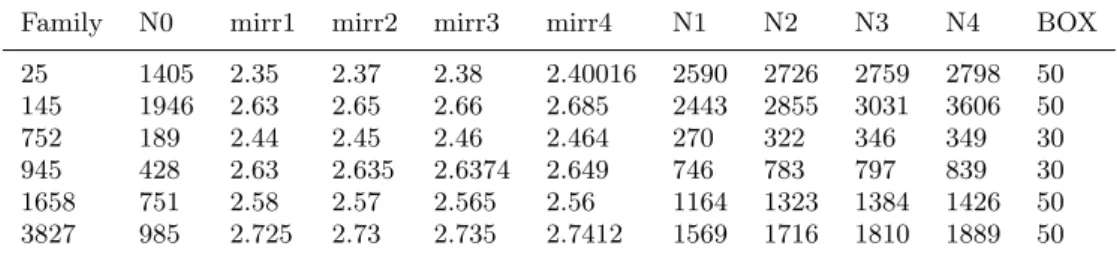
To these six families we have applied the mirroring procedure, according to the data presented in Table 1.
Family N0 mirr1 mirr2 mirr3 mirr4 N1 N2 N3 N4 BOX
25 1405 2.35 2.37 2.38 2.40016 2590 2726 2759 2798 50 145 1946 2.63 2.65 2.66 2.685 2443 2855 3031 3606 50 752 189 2.44 2.45 2.46 2.464 270 322 346 349 30 945 428 2.63 2.635 2.6374 2.649 746 783 797 839 30 1658 751 2.58 2.57 2.565 2.56 1164 1323 1384 1426 50 3827 985 2.725 2.73 2.735 2.7412 1569 1716 1810 1889 50
Table 1. “mirrn” is the n-th mirroring axis in au, and “Nn” is the corresponding new number of members (N0 refers to the original family). Note also that for the family of (1658) Innes we have a set of decreasing mirroring axes: only in this case the family is truncated towards smaller values of a. “BOX” is the chosen size of the running box.
Next, in Figures 4 – 9 we have plotted for each family R as a function of H, representing in the same figure the nominal and the mirrored families. In the plot we represent also, with a vertical dashed line, the expected location of the maximum, according to the age estimated by the V-slope method, and with the assumptions discussed in Paper I (including the re-calibration of 0.912 mag in H).
4 Paolo Paolicchi et al.: Asteroid “one-sided” families: identifying footprints of YORP effect and estimating the age
Fig. 4. R vs. H for the nominal family 25 and four mirrored Phocaea families.
Fig. 6. R vs. H for the nominal family 752 and four mirrored Sulamitis families.
6 Paolo Paolicchi et al.: Asteroid “one-sided” families: identifying footprints of YORP effect and estimating the age
Fig. 8. R vs. H for the nominal family 1658 and four mirrored Innes families.
Fig. 10. Excess Kurtosis vs. H for the nominal family 3827 and four mirrored Zdenekhorsky families.
The analysis of the six nominal and of the corresponding mirrored familes in terms of the search for YORP footprints gives interesting results. In general we remark that the possible footprints (high values of R or, in the example with Kurtosis, low Kurtosis excess values) are for the most part at larger H than expected. It is certainly -at least for most of the cases- a direct consequence of the new choice for the representative H value for the box, which affects the “computed maxima” especially for the older families (for which the H range of the relevant box is larger, since the “YORP-eye” is expected to be found in the region of the less numerous large objects). The revised calibration will be discussed in the forthcoming general analysis.
Apart from this point, we see that in general the mirroring process improves the results of the search. For instance, in the case of 25 Phocaea (Fig. 4), the nominal R − H plot exhibits no significant maxima, and the value of R is always below unity (hence, more objects in the center than close to the borders). The mirroring procedure creates several significant peaks; for the family mirrored at 2.40016 au (magenta curve) a very high peak (R ' 4) appears at H ' 13mag, which is not far from the expected value.
752 Sulamitis (Fig. 6) exhibits, in the extreme mirrored case, a very strong peak -in this case even at lower H than the expected value line; the peak could be found also in the plot for the nominal family, but being by far less evident. We recall that this family is probably the outcome of a cratering process. However, the mirroring tool seems to work, at least for what concerns the identification of the YORP-eye.
The nominal 945 Barcelona (Fig. 7) exhibits its first significant peak at very high H value, while the two most extreme mirrored families (magenta and blue) begin to exhibit significant local maxima for values of H not much exceeding the expected one.
The behaviour of 1658 Innes (Fig. 8) is more ambiguous. The nominal family presents a maximum not far from the expected H value, while the mirrored ones keep a similar maximum, but with a smaller value of R; moreover, they exhibit a new, strong maximum at higher H value, with an (acceptable) excess in H of about 1.5 mag, which might be the significant one. A more thorough analysis is probably needed.
The behaviour of 3827 Zdenekhorsky (Fig. 9) is as expected. The extreme mirrored family exhibits a very strong R maximum very close to the expected H. A similar conclusion can be obtained also from the analysis of the Kurtosis plot (Fig. 10): the strongly mirrored families have very low excess Kurtosis values around the region of H in which the ’eye” is expected. Note that the excess Kurtosis must always be higher than −2, as this corresponds to the situation in which all the bodies are at the edges of the distribution, thus a value such as −1.5 is rather significant.
The only completely unsatisfactory case in that of 145 Adeona (Fig. 5). Only the nominal family and a moderately mirrored version present a significant R maximum. All the other cases present a flat and always low R plot. However, the dynamical processes affecting Adeona are rather complex, and this negative result is not completely surprising.
4.1 Adeona
4.2 Conclusions
The present analysis of a few asymmetrical families shows that the mirroring tool can be helpful in improving the identification of the YORP effect footprints, but that the method has to be tested on the case-by-case basis, also with the aid of some independent theoretical considerations (relevance of dynamical processes, other possible causes of asymmetry). In principle also a sort of “inverse engineering” might work, i.e. using the results of the method extensively applied to many -or all- asymmetrical families to reveal the presence and to estimate the relevance of evolutionary dynamical processes.
Finally, we remark that the calibration of our search is for the most part arbitrary, and can be obtained only a posteriori, from the comparison of the expected and computed maxima. Apart from this comparison, a theoretical analysis of the YORP-Yarkovsky driven evolution, capable of taking into account also the presence of possible correla-tions (for instance, spin–ejection velocity) among the original properties, and then collisional disruption or reshaping, collisional spin reorientation and so on, is really needed.
Acknowledgements
8 Paolo Paolicchi et al.: Asteroid “one-sided” families: identifying footprints of YORP effect and estimating the age
References
1. Milani A., Cellino, A., Kneˇzevi´c, Z., Novakovi´c, B., Spoto, F. Paolicchi, P., Icarus 239, (2014) 46–73.
2. Kneˇzevi´c, Z., Milani, A., Cellino, A., Novakovi´c, B., Spoto, F. Paolicchi, P., Complex Planetary Systems (Cambridge Univ. Press, 2014) 130–133.
3. Spoto F., Milani, A. Kneˇzevi´c, Z., Icarus 257, (2015) 275–289.
4. Milani, A., Spoto, F., Kneˇzevi´c, Z., Novakovi´c, B. Tsirvoulis, G., Asteroids: New Observations New Models, (Cambridge Univ. Press, 2016) 28–45.
5. Milani, A., Kneˇzevi´c, Z., Spoto, F., Cellino, A., Novakovi´c, B. Tsirvoulis, G., Icarus, (2016) doi:10.1016/j.icarus.2016.12.030. 6. Paolicchi P. Kneˇzevi´c Z., Icarus 274, (2016) 314–326.
7. Dunn, O.J., and Clark, V.A. 1974, Applied Statistics: Analysis of Variance and Regression (Wiley, New York 1974) pp. 610–613.