customer engagement
Juan Francisco Calvo
797827
Ignacio Regusci
797632
Project Director
Dr Deborah Agostino
POLITECNICO DI MILANO
MSc MANAGEMENT ENGINEERING
COMO
2016
TABLE OF CONTENT
ABSTRACT ... 7 SOMMARIO ... 8 1. INTRODUCTION ... 9 2. AIRLINES ... 12 2.1 CONTEXT ... 12 2.2 CUSTOMER CHANNELS ... 16 3. SOCIAL MEDIA ... 18 3.1 CONTEXT ... 18 3.1.1 Fan pages ... 24 3.2 SOCIAL MEDIA: COMPARATIVE TABLE FROM A BUSINESS POINT OF VIEW ... 33 4. CUSTOMER ENGAGEMENT ... 36 4.1 SUCCESS CASES ... 38 5. METHODOLOGY ... 41 5.1 FACEBOOK: DATA COLLECTION ... 42 5.2 INDICATORS ... 44 5.2.1 Content categorization ... 44 5.2.2 Posting Time ... 47 5.2.3 Measuring engagement (KPI’s) ... 49 5.2.4 Comments: sample size ... 51 5.3 KRUSCAL WALLIS: POPULATION DIFFERENCES ... 52 5.4 TWITTER: DATA COLLECTION ... 52 5.4.1 Twitter Indicators ... 53 6. RESULTS ... 55 6.1 MATRIX: AIRLINES / SOCIAL MEDIA ... 55 6.2 GLOBAL INDICATORS: AIRLINES INDIVIDUALLY ... 58 6.4 DESCRIPTIVE STATISTICS: AIRLINES INDIVIDUALLY ... 60 6.4.1 Distribution: Content category ... 62 6.4.2 Distribution: Media type ... 63 6.5 DESCRIPTIVE STATISTICS: AIRLINE SET ... 64 6.5.1 Specific indicators ... 64 6.5.2 Type of media ... 64 6.5.3 Content category ... 65 6.5.4 Joint distribution ... 66 6.5.5 Time analysis ... 67 6.6 STATISTICS: KRUSCAL WALLIS ... 68 6.6.1 Media type ... 68 6.6.2 Content category ... 70 6.6.3 Day of post ... 74 6.6.4 Time of post ... 76 6.7 TWITTER ANALYSIS ... 776.8 COMPARATIVE DISCUSSION ... 78 7. CONCLUSION ... 80 8. BIBILIOGRAPHY ... 83 9. ANNEX ... 87
FIGURES
FIGURE 1: SURVEY N=148 AIRLINE EXECUTIVES (SIMPLIFLYING OUTLOOK 2015) ... 15
FIGURE 2: SOCIAL MEDIA USE RATE. SOURCE: PEW RESEARCH CENTRE ... 20
FIGURE 3: KLM FAN PAGE FACEBOOK ... 25
FIGURE 4: GENERAL QUERY FACEBOOK API ... 26
FIGURE 5: FACEBOOK INSIGHTS VILLA BERNASCONI FAN PAGE ... 27
FIGURE 6: FACEBOOK INSIGHTS VILLA BERNASCONI FAN PAGE ... 27
FIGURE 7. SOURCE: DELTA ASSIT TWITTER ACOUNT ... 29
FIGURE 8 [GENERAL MODEL OF BRANDING COMPONENTS AND RELATIONSHIP WITH SOCIAL MEDIA (ADOPTED AND GENERALIZED FOR SOCIAL MEDIA FROM JANSEN AND ZHANG 2009, BY PLETIKOSA CVIJIKJ, 2012] ... 37
FIGURE 9. SOURCE: JETBLUECHEEPS TWITTER ... 39
FIGURE 10. SOURCE: IATA. INTERNATIONAL AIR TRANSPORT ASSOCIATION. FORECAST 20 YEARS ... 87
FIGURE 11: SOCIAL MEDIA USERS AMONG ALL ADULTS ... 88
FIGURE 12: TWITTER USERS ... 88
FIGURE 13: INSTAGRAM USERS ... 88
FIGURE 14: LINKEDIN USERS ... 89
FIGURE 15: PINTEREST USERS ... 89
FIGURE 16. INTERFACE GRAPH API ... 90
FIGURE 17. QUERY GRAPH API ... 90
FIGURE 29. HISTOGRAMS TIME ID ... 99
FIGURE 31. HISTOGRAMS C3 ... 101
FIGURE 32. HISTOGRAMS V3 ... 102
GRAPHS
GRAPH 1: AIR TRAVEL EXPANSIÓN IN THE LAST 40 YEARS. SOURCE: ICAO, IATA, ... 12
GRAPH 2: PASSENGERS TRANSPORTED IN DOMESTIC AND INTERNATIONAL FLIGHTS IN THE DIFFERENT GEOGRAPHICAL AREAS. SOURCE: WORLDBANK ... 13
GRAPH 3: ACCEPTABLE WAITING TIME IN THE SECURITY CONTROL POINT (GREEN 2013, BLUE 2012), SOURCE: IATA ... 14
GRAPH 4: INFLUENCE OF THE FUEL IN THE TOTAL COSTS, IN PERCENTAGE. SOURCE: ICAO, AIRBUS ... 15
GRAPH 5:SOCIAL MEDIA SITES 2012-2014, % OF ADULTS THAT USE THE DIFFERENT PLATFORMS. SOURCE: PEW RESEARCH CENTRE. ... 19
GRAPH 6: PERCENTAGE OF INTERNET USERS THAT USE OF AT LEAST ONE SOCIAL MEDIA PLATFORM. SOURCE: PEW RESEARCH CENTRE ... 20
GRAPH 7:SOCIAL MEDIA INDUSTRY REPORT 2014, MICHAEL A. STELZNER ... 23
GRAPH 8. SOURCE: STATISTA 2015, EMARKETER Y AMERICAN MARKETING ASOCIATION ... 34
GRAPH 9. SOCIAL NETWORK USERS WORLDWIDE 2011-2017, BILLIONS AND % CHANGE SOURCE: EMARKETER, APRIL 2013. ... 34
GRAPH 10. SOURCE: SIMPLIFLYING ... 38
GRAPH 11. SOURCE: SIMPLIFLYING ... 38
GRAPH 12: SPECIFIRC INDICATORS - AVERAGE VALUE OF THE KPIS ... 64
GRAPH 13: TYPE OF MEDIA ... 65
GRAPH 14: CONTENT CATEGORY ... 65
GRAPH 15: JOINT DISTRIBUTION ... 66
GRAPH 16: JOINT DISTRIBUTION (CONT) ... 66
GRAPH 17: POST PER DAY DISTRIBUTION ... 67
GRAPH 18: POST PER HOUR DISTRIBUTION ... 67
GRAPH 19: KRUSCAL WALLIS – MEDIA TYPE ... 68
GRAPH 20: MEDIA TYPE - V3 KPI HISTOGRAMS ... 69
GRAPH 21: MEDIA TYPE - P3 KPI HISTOGRAMS ... 70
GRAPH 22: KRUSCAL WALLIS – CONTENTA CATEGORY ... 71
GRAPH 23: KRUSCAL WALLIS – CONTENT CATEGORY [MODIFIED] ... 72
GRAPH 24: TIMEID AD HISTOGRAM ... 73
GRAPH 25:P3 OST HISTOGRAM ... 73
GRAPH 26: V3 EST HISTOGRAM ... 73
GRAPH 27: EB C3 HISTOGRAM ... 73
GRAPH 28: KRUSCAL WALLIS – DAY OF POST ... 74
GRAPH 29: TIMEID FRIDAY HISTOGRAM ... 75
GRAPH 30: TIMEID SATURDAY HISTOGRAM ... 75
GRAPH 31: TIMEID MONDAY HISTOGRAM ... 75
GRAPH 32: TIMEID SUNDAY HISTOGRAM ... 75
GRAPH 33: KRUSCAL WALLIS – WORK DAYS ... 76
GRAPH 34: TIMEID WORKDAYS HISTOGRAM ... 76
GRAPH 35: TIMEID WEEKEND HISTOGRAM ... 76
GRAPH 36: KRUSCAL WALLIS – TIME OF POST ... 77
TABLES
TABLE 1 NETWORK VS LOW COST CARRIERS ... 16
TABLE 2 SOURCE: FACEBOOK PAGES, TWITTER, INSTAGRAM, PINTEREST, GOOGLE+, YOUTUBE ... 33
TABLE 3 SOURCE: EMARKETER, APRIL 2013. ... 35
TABLE 4 SOURCE AIRLINES-INFORMS ... 42
TABLE 5 ... 43
TABLE 7 EVALUATION FRAMEWORK FOR SOCIAL MEDIA BRAND PRESENCE, PLETIKOSA CVIJIKJ, PP. 135-138 ... 45
TABLE 8: SUMMARY TABLE OF THE POST CATEGORIES USED FOR THE ANALYSIS ... 47
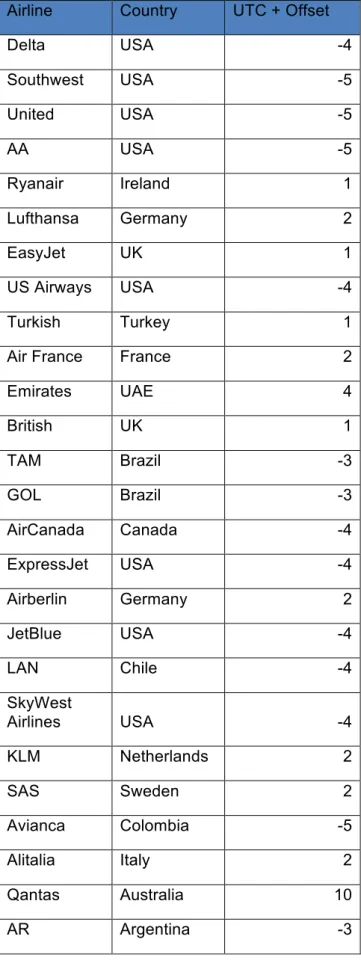
TABLE 9: OFFSET FROM THE UTC TIME ZONE ... 48
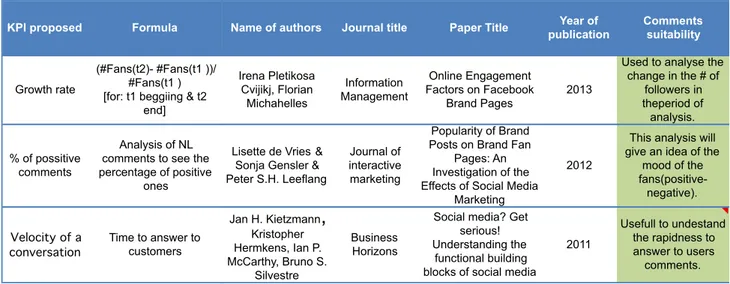
TABLE 10: ACADEMIC SOURCES – SPECIFIC KPIS ... 49
TABLE 11:ACADEMIC SOURCES - GLOBAL KPIS ... 50
TABLE 12: ACADEMIC SOURCES – GLOBAL KPIS (CONT) ... 50
TABLE 13: PRACTITIONER SOURCES - SPECIFIC KPIS ... 51
TABLE 14: PRACTITIONER SOURCES – GLOBAL KPIS ... 51
TABLE 15: JSON TO CSV CONVERSION ISSUES ... 53
TABLE 16: AIRLINE VS SOCIAL MEDIA ... 57
TABLE 17: GLOBAL INDICATORS: AIRLINES INDIVIDUALLY ... 58
TABLE 18: VELOCITY OF CONVERSATION ... 59
TABLE 19: DESCRIPTIVE STATISTICS: AIRLINES INDIVIDUALLY ... 61
TABLE 20: DISTRIBUTION CONTENT CATEGORY ... 62
TABLE 21: DISTRIBUTION MEDIA TYPE ... 64
TABLE 22: KPI STATISTICS ... 64
TABLE 23: SOCIAL POST KPI VALUES ... 72
TABLE 23: TWITTER ANALYSIS ... 77
TABLE 24. FACEBOOK METRICS FOR STAKEHOLDER ENGAGEMENT (BONSÓN & RATKAI, 2013) ... 91
TABLE 25. INDICATORS ACADEMIC SOURCES ... 92
TABLE 26. INDICATORS ACADEMIC SOURCES ... 93
TABLE 27. INDICATORS “PRACTITIONER SOURCES” ... 94
TABLE 28. INDICATORS DESCRIPTIVE VALUES ... 95
TABLE 29. MEDIA TYPE RESULTS ... 95
TABLE 30. INDICATORS DESCRIPTIVE VALUES ... 95
TABLE 31. CONTENT CATEGORY RESULTS ... 96
TABLE 32. KRUSCAL WALLIS TIME ID : DAY ... 97
TABLE 33. KRUSCAL WALLIS TIME ID: WEEKEND ... 97
TABLE 34. KRUSCAL WALLIS TIME ID: CONTENT CATEGORY ... 97
TABLE 35. KRUSCAL WALLIS P3: CONTENT CATEGORY ... 97
TABLE 36. KRUSCAL WALLIS C3: CONTENT CATEGORY ... 98
TABLE 35. KRUSCAL WALLIS V3: CONTENT CATEGORY ... 98
ABSTRACT
In the last years, there has been an exponential growth in technologies that facilitated the exchange of information; generating a more connected world and changing the way people make business; shortening travel times and the concept of distances between countries.
Various authors have highlighted the importance of social media use in companies to understand customers and extract meaningful information for product and service innovation. The mobile penetration has increased thanks to the new technologies that allow the creation of affordable and easy to use devices. This has changed the way people interact in social media platforms.
The development of this final project aims at analysing how airlines use social media in their customer engagement strategy. The purpose is to identify the most popular social networks and the specific content published by airlines. Analysing the content posted in the different platforms, we will create and use existing (validated in academic papers) general and airline specific KPI’s to measure costumer engagement. It is important to mention that the indicators are based on data retrieved from public information available in the official social platforms.
Our results based on academic papers, interviews of experts, case studies and information retrieved from social platforms show that an adequate social media management could increase the quantity and quality of customer interactions.
SOMMARIO
Nelle ultimi anni, si è verificata una crescita esponenziale nella tecnologia che ha facilitato lo scambio di informazioni; generando un mondo più connesso e cambiando il modo in cui le persone fanno affari; accorciando le distanze di viaggio e il concetto di distanza fra paesi.
Diversi autori hanno evidenziato l’importanza di utilizzare i social media nelle aziende per comprendere i clienti ed estrarre informazioni significative per prodotti e servizi innovativi. La penetrazione del mobile è aumentata grazie alle nuove tecnologie che permettono di accedere ai dispositivi economici e facile da utilizzare, questo ha cambiato il modo in cui le persone interagiscono nelle piattaforme di social media.
Lo sviluppo di questo progetto finale ha l’obiettivo di analizzare come le compagnie aeree utilizzano i social media nelle loro strategie di customer engagement. Lo scopo è quello di individuare i più popolari social network e il contenuto specifico pubblicato dalle compagnie aeree. Si utilizza questo contenuto per misurare il customer engagement utilizzando indicatori generali e specifici sviluppati per gli autori ed esistenti (validati in altri studi academici). È importante ricordare che questi indicatori si basano su dati recuperati da achivi ed informazione pubbliche disponibili nelle piattaforme di sociali ufficiali.
I risultati sulla base di pubblicazioni academiche, interviste di esperti, casi di studi, e le informazioni recuperate dai social media mostrano che un’adeguata gestione dei social media potrebbe aumentare la quantità e qualità delle interazioni con i clienti.
1. INTRODUCTION
In previous years smartphone penetration and other mobile devices has increased thanks to new technologies that enabled companies to build easy to use and affordable devices. This has changed the way people interact, every day more connected, proactive and demanding on social platforms. The use of the social media channels has also expanded from sharing grateful moments to posting claims, demands and directly interacting with companies.
These deviations create new opportunities and threats to enterprises. As an opportunity, emerges the possibility to obtain large amount of data about customer behaviours; which could be used to generate improvements in products and services. Additionally, companies can use crowdsourcing or gamification to interact with users and create value by attaining different solutions to problems, increasing word of mouth and brand loyalty. Last but not least, they result in great tools for advertisements, promotions and managing customers relationships as social media allows companies to access and interact with large number of users and possible buyers.
On the other hand, the negative news and experiences can get viral, damaging the company’s reputation and image. In addition, response time is very important as users can express their discontent at any time, making it crucial for companies to constantly monitor social channels. Directly engaging selected comments and enquiries can assist with alleviating possible situations (Simpliflying, 2015).
According to a study (NIIT Technologies), the aeronautic industry is the second industry most dedicated and committed to social media. As it is highly affected by social media channels it’s interesting to analyse which are the main practices adopted by the principal airlines and how they engage with customers to build and maintain long-term relationships.
Airlines have been going through a turbulent phase, as competition in the sector and high exit barrier costs have led to a vicious circle of loses. Their profitability strongly related on their ability to perform a strong marketing strategy and create strong brand loyalty. The key of this strategy is to reach out and tap all segments of active customers and attract prospective customers (NIIT Technologies). Their solutions must be innovative and their practices could be extrapolated to other industries, which are not actively using social media in their marketing strategy to interact with their customers.
There are numerous articles and studies, which show that customer engagement strategies in airlines are improving and that in the last years they have been strongly investing on social media and online marketing. For 2015, 63% of airlines executives say that social media budget is likely to increase, 40% pretend to see an 25% increase and 19% pretend to see a 40% increase. (Airline Social media outlook
2015, Simplifying). According to an article by Bain & Company the average company spends U$S 750.000 a year but other earlier adopters spend significantly more, reaching tens of millions of dollars.
Additionally, the main objectives of the airline companies are to create customer engagement, brand loyalty, customer service and profitability. To reach these objectives, most airline companies assure they must increase their resources allocated to social media channels. The main problem appears as there is no best practice; which integrates all channels in a consistent way, generates internal value and at the same time provides a consistent and integrated experience to customers. “Social media leaders understand and appreciate the magnitude of the shift in customer empowerment and the opportunities and risks that these tools create. As a result, they approach their social media efforts differently.” (Bain&Company 2011) On the other hand, the smartphone industry reaches 1750 million users, with the forecast that this number keeps growing, reaching 4500 million users by 2017 (emarketer, 2014). Its remarkable how the Internet access increases through the use of tablets and smartphones. Almost one third of consumers have Internet access through their cell phones, these users want comfort and mobility. Also we know that the social media platforms are changing the way that people interact, for this reason a successful social media strategy is one of the priorities for companies that operate globally.
Finally, if we specifically analyse the airline passengers, they are part of the most innovative and technologically friendly sector of society. Faithful to the tendencies described above, demanding better services and low answer times.
With this research we plan to provide an overall view about the use of social media platforms in Western airlines so as to determine actual strategies and set best practices according to customer engagement. The level of customer engagement will be measured using general and specific KPI’s that have been validated in academic papers. Public information from the most popular social platforms will be the input for the metrics followed by a qualitative analysis. In addition, this research tries to identify which factors promote the level of customer engagement. For this purpose, we gathered information from one hundred airline companies according to a rank based on the number of passengers carried by (Airline-inform, 2014) in order to determine the most popular social platforms used by these companies. A second more detailed analysis of the top twenty-five western airlines was carried out analysing only the platforms with the highest presence
From this research one can observe the flexibility and the utility that social media has as a communication tool to generate direct contact with the client and also observe the potentiality of the API that most social media have. These can be of great use for future studies not just for a company, but also to evaluate the use and impact that the competition is having using its social platforms. We expect that our results will
motivate and guide social media managers to create clear strategies to increase customer engagement and fans numbers. Facilitating decisions such as what content category, type of media and time to post. Our results show (1) that the level of customer engagement can be increased if the previous variables are selected adequately, (2) The level of customer engagement can be measured according to their actions in social media, for example: likes, shares and comments. (3) Photo and video posts are preferred to link or status posts to increment the amount of likes and shares.
2. AIRLINES
2.1 CONTEXTNow a days, there are more than 36.000 air routes that connect the world, 3.1 billion passengers where carried by the world airlines in 2013 and more than 50 million tons are carried by air transport annually (ATAG, 2014) on nearly 100,000 flights per day, while the real price of air travel fell by 7.4% (IATA, 2013).
Airlines have a large impact on the global economy; over 58 million people are employed worldwide in aviation and related tourism. Of which 8.7 million people work directly in the aviation industry (ATAG, 2014). If aviation were a country, it would rank 21st in the world in terms of gross domestic product (GDP), generating $606 billion of GDP per year.
Air transport plays a primary role in promoting commerce with distant markets, investments in remote locations, boosting tourism, transports goods and people. In this way it creates value and increases the quality of living of millions of people. The following graph 1 shows examples of these changes.
In addition, the total air traffic forecast of the next 20 years, sets an increase of 4,1% average annual growth. More than doubling the passengers expected to travel in this year and reaching a massive 7,4 billion by 2034. We can also expect aviation to be supporting around 105 million jobs and $6 trillion in GDP. (IATA forecast 20 years, 2014)
This sector is a critical player in the economy, moreover, taking into account that the movement of people and goods around the globe has been constantly increasing. In the following graphs we can observe the increase in number of passengers per year. (Worldbank, 2015)
Therefore airlines have benefited from new customers, new connections and higher passenger frequency.
At the start, commercial aviation was property of the state and therefore they were highly regulated. In many cases, the state decided how many seats they could sell and at what price, resulting in many inefficiencies and losses. “Deregularization has opened markets first in the US (1970s), later in Europe (1980s), and then to some degree also in other regions.” (IATA, vision 2050). Companies began to have mixed capital from both state and private sectors and even completely private capital leading to a greater competition. This competition devastated many companies that operated inefficiently. Afterwards, “Costs have fallen significantly, driven by better technology and more sophisticated operational management.” (IATA, vision 2050). Despite this airlines still struggle with low margins and stakeholder’s high cost of capital.
In parallel to these problems airlines had to deal with the installed monopolies in airports, the controlled air space and practically only two aircraft manufacturers, Airbus and Boeing. Additionally, nowadays they are very much affected by external events as the variation in the price of petroleum, increasing regulations due to anti-environment contamination policies and even excessive controls against terrorism.
Graph 2: Passengers transported in domestic and international flights in the different geographical areas. Source: WorldBank
Another impact that airlines are facing is the change of customer behaviour. Initially a flight was a very important event, however nowadays it is more common and frequent. “In the course of merely ten years, low-cost airlines have transformed planes into a casual and common means of transportation, such as the car and the train.” (Nils Kernchen, 2004). Giving rise to frequent flyers, that are consumers familiarized with procedures and time schedules becoming pickier and demanding. Surveys have been launched to study what people think when facing a flight; 51% agreed that the worst part about flying were security checks and that they were willing to wait 5 to 10 minutes in queue of security lines before becoming impatient. (IATA Global passenger survey)
Keeping in mind this panorama of high costs and low margins it becomes very difficult to fulfil demands and captivate customer loyalty. Particularly when aspects that annoy passengers are out of airlines influence and reach.
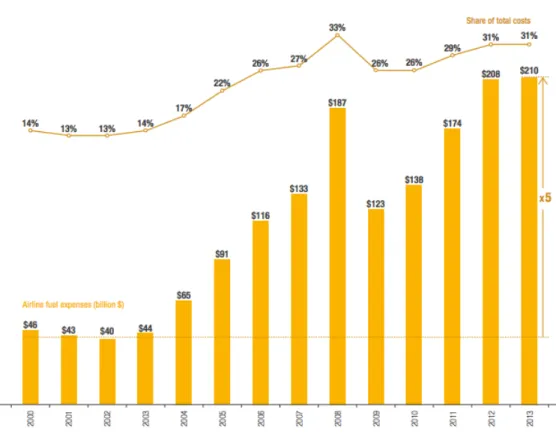
This is the context in which airlines are progressively searching for improvements and means to be efficient and distinct. Many airlines for example, use financial options to fight variations in fuel prices given that these can result in the most outstanding cost (up to 30% of the total cost) (Airbus, 2014). They also opt for alliances or directly mergers to achieve better results by purchasing in bulk quantities.
Airlines apply various methods to optimize costs and increase profitability. Some of the approaches include cutting non-core operations, outsourcing activities like maintenance and ground handling, using yield management, adding new revenue sources, introducing loyalty programs and establishing alliances with global reach. (IATA, Vision 2050). One of the approaches to mitigate these problems is to look for innovative alternatives that include new technologies. Particularly those related with Internet and social media to capture mayor audiences and provide better information flow to and from companies. Many of these practices have begun with little expectations, however in the last years there have been significant cases and impacts on businesses and therefore they are becoming must have tool (figure 1).
Graph 4: Influence of the fuel in the total costs, in percentage. Source: ICAO, Airbus
Figure 1: Survey n=148 airline executives (Simpliflying Outlook 2015)
This research concentrates in the use of social media to understand customer engagement. Nevertheless, it is important to keep in mind that many factors are involved in the way value is created and distributed. This is illustrated in a Porters Five Forces framework created by IATA that identifies the underlying drivers of the industries profitability. (See Annex)
To better set the framework it is important to mention that the strategies of airlines vary and so do their business models. Today, there are two main business models adopted, the network carriers and the low cost carriers. The network carriers include the main and mayor airlines of the world and the low cost carriers the typical cost-saving airlines achieving inexpensive fares. The following table better highlights their differences. (Market Outlook 2014-2015, Boeing)
Category Network Carriers Low cost Carriers
Airports used Main Airports Secondary Airports
Fleets Numerous Single type airplanes
Alliances Pursue Avoided
Luggage Always included Charged separately
Advertisement Not during flight During flight
Products offered Broad Single
Table 1: Network vs Low Cost carriers
Another important aspect in which these business models differ is in their ideals. “The problem for traditional airlines is today that they still create services first, and sell these services through advertising without knowing if there is a need […] The key point is that low-cost airlines exanimate through market research what the customers really need. If, and only if, the research shows that there are potential customers for a service (e.g. flight route between two cities) or product, it is planned and produced. (Kils Kernchen 2004) This approach requires access to information and direct contact with customers; a mean that gathers these requirements is social media.
2.2 CUSTOMER CHANNELS
Traditionally the travel agencies were the dominant channel for airlines, they were paid by commissions, which supported prices. This channel has become less dominant as a whole and changed their role. Websites have taken most of its volumes for individual customers travelling for leisure and business. Travel agencies still remain important for corporate customers but their strategy is to lower costs. Aggregator websites have become the dominant sales channels for lower price tickets. As they allow easy comparison of prices between airlines and increased price transparency. Some offer also package flight itineraries and lowest price guaranty. Global distribution systems (GDS) aggregate seat price and availability data from airlines and provide it to travel agencies and aggregator websites. The market is dominated by three main GDSs: Amadeus, Sabre, and Travelport. Some of
them have their own aggregator websites where they sell airline tickets directly to end customers. (IATA, vision 2050)
Airline websites: These websites intend to bypass GDS, being more attractive because of the lower ticket costs due to fewer handling steps. They also offer check-in check-information, seat assignment, boardcheck-ing pass generation and handlcheck-ing frequent flyer miles, as different customer services1.
The newest direction for ticket purchase is the use of social media platforms. For now just a few have the option “Book Now” on their Facebook page but they redirect you directly to the airline’s booking website. Plans to add Facebook applications to buy on site are on course. However, social media plays a more important role today in offering users access to information that is user based. Potential clients before buying can now share experiences with hundreds of other passengers to then judge and select their carrier (Bain & Company, 2011). This is why airlines that enter social media destine many resources to control their platforms and the spread of bad reviews.
3. SOCIAL MEDIA
The purpose of this section is to review the standing academic work in the ground of social media; we will provide general definitions of the different key concepts, explain and analyse the functionalities of the existing platforms. Subsequently we will focus on the most popular media platforms Facebook and Twitter.
3.1 CONTEXT
“We talk about the quality of product and services; what about the quality of our relationships, and the quality of our communications, and the quality of our promises to each other?” (Measure What Matters, Katie Delahaye Paine, 2011). This is a question that’s implicit between social interaction and businesses. Since the very beginning many have been interested in measuring the relationships of businesses with customers and society, being a key aspect for business growth and performance (Measure What Matters, Katie Delahaye Paine, 2011).
In the last years the world of public relationships has changed given that social media channels have integrated into our lives. Social media can be defined as “a group of Internet based applications that build on the ideological and technological foundations of Web 2.0 and allow the creation and exchange of user generated content” (Kaplan and Haenlein 2010, pp. 61). In other words the Web 2.0 does not mean a significant development in technology but a change in the usage patterns. For example, consumers have passed from being passive clients, to become active participants that share information, personal experiences and opinions with pairs on the social media platforms (Berthon et al. 2007, pp. 39-48). In addition an analysis done by Murugesan 2007, the Web 2.0 can be sensed as the technological platform for social media, facilitating: Web design, Responsive user interfaces and establishment of social networks of people.
In addition, social media can be defined as “web-based services that allow individuals to (1) construct a public or semi-public profile within a bounded system, (2) articulate a list of other users with whom they share a connection, and (3) view and traverse their list of connections and those made by others within the system.” (Boyd and Ellison 2008, pp. 210)
Companies and users can foster their relationships by interacting in the social platforms; millions of people use these to share information, doubts, blame companies for bad services and expect an answer in a few minutes. (Bain & Company, 2011)
The first significant expansion of Social networks started in 2003 with LinkedIn, MySpace, and Flickr; many of which are still active now a days (Richter et al. 2011, pp. 89-103). But most certainly, the major expansion of social media started in the early 2004 when Facebook was launched. It success is mainly attributed to the fact that it uses a different approach from previous social networks, preventing the public
access to the user profile. Now a days, Facebook is the by far the largest social network with 1.3 billion active users.
As described, social networks are becoming a mainstream part of our lives, as people form different ages and background interrelate in the social media platforms. This has created an exponential growth in the number of interactions and social media usage. The following graph shows the percentage of Internet users that belong to the most popular social networks.
Facebook has the largest percentage of users 71% and remained constant in its growth rate in the last year while the other social media platforms are growing at high rates.
On the graph 6, we can observe the adoption curve of social media in the last years considering the total Internet users community. Furthermore, the tendency and magnitude of growth of this graph is outstanding and gives us an idea of the development of the social platforms. Additional graphs and tables extracted from the PEW research Center (Annex) show the mobile device usage tendencies of the past years and percentage of social media usage among all adults US adults (not only the percentage which use internet).
Graph 5:Social media sites 2012-2014, % of adults that use the different platforms. Source: Pew research centre.
Social media adoption considering the Internet users community
The following figure 2 shows the frequency of social media usage according to the survey carried out by Pew research center. Due to the increase in usage of mobile devices, more people have constant Internet access and make heavy use of the social networks.
Frequency of social media use (Pew research center)
The traditional means and the marketing sectors have been shifting their funds from traditional advertising towards social media channels in an exponential order. In this shift, companies have lost the control sensation they had upon their stockholders and the general public. (Measure What Matters, Katie Delahaye Paine, 2011). A research made by Gallup in 2014 about the American market shows that U.S. companies spent $5.1 billion on social media advertising in 2013, as they believe this will lever with a return on investment. However, a solid majority of American adults surveyed said that social media had no influence at all in their buying behavior. On the other hand, customers who are fans of the company in social media platforms tend to be more loyal and therefore are more open in receiving company’s information about the brand (Bagozzi and Dholakia 2006). Furthermore, some cases have been reported of an effective carefully managed advertising campaign in Facebook, which increased the consumer’s frequency in the stores of the Houston Bakery chain (Dholakia and Durham, 2010). Another study showed that effectiveness in company’s WOM communications could increase sales (Godes and Mayzlin, 2009).
Furthermore, according to results of a study of social media use and corporate reputation, that analyses a survey amongst customer and non-customers of an international airline, “The customer’s intensity of social media use is positively related to their engagement in the airline’s social media activities.” Consequently this has a positive correlation with corporate reputation (Dijkmans et al, 2015). This argues that company’s online activities in the social platforms are beneficial for corporate reputation.
Additionally, firms tend to integrate their digital tools to obtain a global view and avoid uncoordinated efforts throughout the different customer touch points (Bain & Company, 2011). This is achieved by gathering information from social media channels and using it as input of predefined metrics to evaluate if the company’s performance is aligned with its objectives. But this can be misleading as companies may continue to treat social media as a one-way channel, focusing on how to push these platforms with their marketing agenda.
One could argue that consumers have always talked about their thoughts and desires. Social channel just make it easier to debate in a more public and widespread scale. The State of the American Consumer Report made by Gallup states that “consumers are more likely to engage with companies through social media if they believe their intentions are genuine.” Consequently, to be part of the conversation, company’s social media initiatives must be authentic, responsive and compelling. (Gallup, 2014)
There are numerous studies that highlight the positive effect of successful social media campaigns in customer engagement and financial benefits. On the other hand, according to our research of academic references there is just one method for
an effective evaluation of social media brand presence (Cvijikj 2012). This is partially because there are no clear goals and objectives, which define the measures and methods to be used, as well as a concrete definition of “success” (Dubach Spiegler 2011). Also, due to the relatively limited knowledge about the new communication medium rules and that marketers try to transfer the old rules of traditional advertising to social media marketing (Hoffman and Fodor, 2010).
There has been additional empirical research to investigate what factors enhance brand post popularity, results show that brand posts with vivid and interactive characteristics enhance the number of likes and that interactive brand posts enhance the number of comments (De Vries et al, 2012).
There is still a lot of controversy about the online customer engagement strategies used by companies and the potential of social media; a large majority is interested in this subject as the investments in social media are forecasted to increase to $15 billion by 2018 in the US (BIA/Kelsey). Companies will have to experiment to figure out what works best to create long lasting relationships with theirs customers, but there is potential in social media and companies can now build communities with their customers in ways that did not exist in the past.
In this context of discussion and uncertainty, is where our research adds to the debate by understanding how do airlines use social media in their customer engagement strategy.
Facebook is the most popular social network in the world, consisting of 1.3 billion active users (March 2015).
This platform started as an exclusive media for Harvard students in 2004; later in 2006 it launched a new interface that could be accessed with any email account. From a beginning, Facebook has grown exponentially and broadened its functions. The company has developed technologies that facilitate the exchange of information through different web and mobile platforms, from which users connect and share their experiences in a secure environment.
Facebook states that their mission is: “to give people the power to share and make the world more open and connected. People use Facebook to stay connected with friends and family, to discover what’s going on in the world, and to share and express what matters to them.” (Facebook, 2015)
According to a study made by Social examiner about the marketing industry in 2014, Facebook is the most used social network. The following graph 7 shows the percentage of marketers, which use the different social platforms in their campaigns. In addition, 54% of marketers chose Facebook as their most important platform. (Stelzner 2014)
Graph 7:Social media industry report 2014, Michael A. Stelzner
To further explain the main concepts and the use of the platform for marketing purposes we will describe the basic terminology as retrieved form the official Facebook page (Facebook glossary).
94% 83% 71% 57% 55% 54% 47% 28% 0% 10% 20% 30% 40% 50% 60% 70% 80% 90% 100%
Facebook Twiter LinkedIn You Tube Blogging Google+ Pinterest Instagram
% of m ar ke te rs u si ng S N
• Profile is the collection of the photos, stories and experiences that tell your story. Your profile also includes your personal information such as name, birthday, school you have studied, etc.
• Like is a way to give positive feedback and connect with things you care about. By clicking Like below a post you are letting people know that you enjoy it, as it remains visible, without leaving an actual comment. Another possibility is to like a page, this means you are connecting to the page, and you will start to see stories from the page in your News feed. These pages will also appear in your profile and you will appear on the page as the person who likes the page.
• News feed is the constantly updating list of stories in the middle of your home page. News Feed includes status updates, photos, videos, links, app activity and likes from people, Pages and groups that you follow on Facebook.
• Friends are the individuals to whom you connect in Facebook, a friend request is sent and if accepted it allows the person to see your profile and interact with you sharing content and updates.
• Timeline is where you can see your posts or posts you've been tagged in displayed by date. Your Timeline is also part of your profile.
• Posts are messages users post in their profile, they can be classified in different types: Video, photos, links or status.
• Comments are the specific message a user writes on a post or on a post comment.
• Share is a way to promote a content posted by others on your own profile wall. It is used to promote ideas and content.
• Top stories are stories published since you last checked News Feed that Facebook thinks you will find interesting. They may be different depending on how long it’s been since you last visited your News Feed.
Facebook is free and registered users can manage their own personal space, create photo albums, share videos, create events, write notes, announce, share news and even create company profiles.
Its principal use is to share different type of information with friends and family, allowing people to keep up with the latest new and tendencies and most importantly it allows you to meet new people, promote brands, events and keep a dynamic relationship with your businesses clients. Therefore, the interaction is the most important feature because it generates traffic and allows businesses to gather greater information from a user.
3.1.1 Fan pages
Fan pages are specific profiles for businesses, companies and organizations to share their stories and connect with people. Just like personal profiles, you can customize fan pages by posting stories, hosting events, contests and more. People
can access your News Feed by just liking your page and can get updates in News Feed. In this way you can follow pages you are interested in but are not friends with. If you want to create a fan page to represent a business, brand, organization or celebrity, you must be an official representative. This allows people to trust the page profiles as they are usually verified.
They offer unique analytic tools for businesses, brands and organizations to understand their interactions with their fans and measure how effective are their campaigns. People who have a personal profile can manage pages and a single person can manage multiple pages.
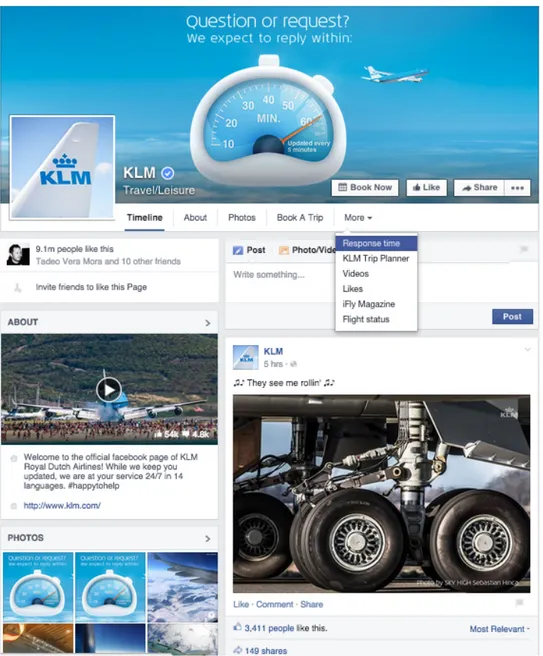
The following illustration shows the KLM brand page, it has a total of 9.1 million likes and posts regarding the airline information. These types of pages have evolved from just posting content to increasing the possibility of interaction and access to
information. KLM includes a Book Now buttons, together with a response time indicator, which measures the time of response to fans questions.
As described previously the posts can differ not only in content but in media type (Video, photo, link and status). The central part of the brand page illustration is referred as the Timeline or wall. When a person likes the page he/she automatically becomes a Fan, therefore KLM has a total 9.1 million fans.
These fans can interact with the brand page by: tagging the Brand in a wall post, pressing like on a post made by the brand, commenting on a post made by the brand, sharing the post on their profile wall and posting content in the brands page (depending on the brand policy). All these actions increase the content reach as friends of the user can see their wall post and are used to measure the level of engagement of the fans towards the brand.
We analyzed a Facebook article discussing posting tips and best practices for business, focusing on the post consistency, post targeting, post quality of photos and the review of post performance. All of these factors should be taken into account to establish a brand presence that will expand the relationship between the brand and the user, increasing engagement. Therefore, post performance should be monitored to understand the engagement level of the fan community.
There are two different methods to evaluate and review the customers interaction with the brand page: Facebook insights and Graph API.
Graph API
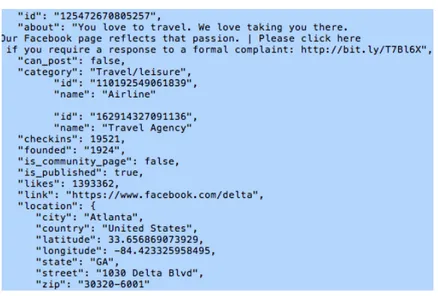
The Facebook Graph API provides access to information about people and pages, the interaction between them such as likes, comments, shares, etc. Every object has a specific ID number, which can be used to retrieve information using a query. For example to retrieve general content from a brad page, we can use the <PAGE_ID> referred as the brand ID.
To better explain this tool the following figure 4 shows the general information retrieved of Delta airlines. Using the general query “http://graph.facebook.com/delta”
The information is retrieved has a JSON format and the query can be modified to collect different fields such as: number of likes, comments, shares, posts, number of fans talking about count, time of creation of comments and other information.
To access specific information about connections an authorization token is required. This is done, by allowing certain access to the users personal information. All the information related to the access token and the reach of the Graph API is explained in the Facebook developer’s page. The data collection used in our investigation will be explained in the methodology section and a more detail description of the query will be provided. In the annex you can visualize the Graph API panel used.
Facebook insights
It offers fan pages an automatic gathering and display of traffic information. This section allows the administrator of the page to analyze different indicators of their page. The following images provide a clearer view of the visualization panel.
Figure 5: Facebook insights Villa Bernasconi fan page Figure 6: Facebook insights Villa Bernasconi fan page
Finally, comparing both data collection tools used, Graph API main advantage with Facebook insights is that it can collect public information of wall posting and comments of all brand pages, own pages and the competitors pages.
Twitter is a social network that allows users to send and receive short messages, maximum of 140 characters, called tweets. Registered users can post tweets, while non-registered users can only visualize if the account is set on public.
To understand the magnitude of this social network we can take a look at some figures, today there are 302 million active monthly users, 500 million tweets are sent per day and 80% of the active users are mobile. (Twitter home page entered 5/2015) According to a social media marketing industry report 67% of marketers have plans to increase their activities on twitter. (Michael A. Stelzner 2014)
To better explain the platform some terms definitions will be given according to the twitter glossary of terms.
• Timeline is a real-time stream of Tweets. A persons own timeline for instance, is where one can see all the Tweets shared by friends and other people this individual follows.
• Tweet is the message of maximum 140 characters a user can post in the social network.
• Retweet is a Tweet that you forward to your followers. Often used to pass along news or other valuable discoveries on Twitter, Retweets always retain the original attribution.
• Reply is a response to another user's Tweet that begins with the @username of the person you are replying. One Replies by clicking the "reply" button next to the Tweet you would like to respond to.
• Following is done by subscribing to a Twitter account. Once you are following someone you can to see their Tweets as soon as they post something new. Anyone on Twitter can follow or unfollow anyone else at any time, with the exception of blocked accounts.
• Favoring a Tweet is used to indicate that you liked a specific Tweet. To favorite a tweet, click the star icon and the author will see that you liked it. • Mentioning other users in your Tweet is done by including the @ sign
followed directly by their username. It also refers to Tweets in which your @username was included.
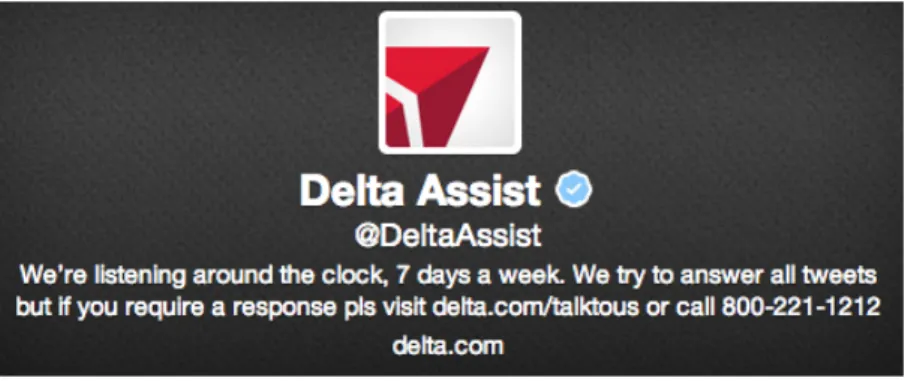
Businesses use twitter to share information about their services, gather real-time market intelligence, and build relationships with customers, partners and influencers. Today, twitter is widely used in customer attention and assists services. Generally businesses create a secondary twitter user focalizing in this topic, which allows an immediate and direct interaction with the customer. Just like the @DeltaAssit example illustrated below. Companies are aware of the necessity of being responsive to their customers and are acting accordingly.
In addition, companies are using this service to engage customers through unique promotions and benefits. With twitter, companies have the potential to inform millions of followers instantly and stay updated in real time. Given all these benefits this is definitely an important platform to manage.
To collect information from twitter one can use professional software’s that need a license and allow the access to sensible information. To search for information regarding the analyzed twitter accounts, we decided to use the Twitter API.
Twitter API
As described in the Facebook graph API, Twitter also allows users to access information through an API. So we decided to use this tool to collect information about the different tweets posted on the platforms.
In a similar way as Facebook API, Twitter API allows the user to recollect tweet information in a personalized manner selecting the forms that want to be retrieved. It allows accessing the tweets that have been previously indexed by the search
interface.
In order to use Twitter API an authorization needs to be emitted by using a personal twitter account. Once the account is validated, one can start retrieving tweet’s and replies specific information of public account in twitter.
Given that this research makes focus on Facebook, the retrieved data is used to understand the overall use of the platform.
To obtain further information about Twitter API one can enter the webpage of twitter: (https://dev.twitter.com/rest/tools/console)
Other social networks LinkedIn
LinkedIn is the world's largest professional network with 300 million members in over 200 countries and territories around the globe.
Has the mission connect the world's professionals to make them more productive and successful. When you join LinkedIn, you get access to people, jobs, news, updates, and insights that help you be great at what you do.
LinkedIn started out in the living room of co-founder Reid Hoffman in 2002, and it officially launched on May 5, 2003.
Jeff Weiner is the CEO, and the company's management team is made up of seasoned executives from companies like Yahoo!, Google, Microsoft, TiVo, PayPal, and Electronic Arts.
LinkedIn is publicly held and has a diversified business model with revenues coming from member subscriptions, advertising sales, and talent solutions.
Google+
Google executives subsequently described Google+ as "a social layer across all of Google's services" (Google inc, 2014), allowing them to share a user's identity and interests.
In the last years it has grown tremendously reaching 540million active users. Some of its features include the ability to post photos and status updates to the public or interest based communities rather than just simply friends as in Facebook. One of the most interesting and core features of Google plus is “Circles” which enables user to organize users into groups of sharing using a drag and drop interface. For example, work themed content can be shared with only work colleagues, and one's friends and family could see more personal content and photos.
Additionally, the option to share Public or with Everyone is always available.
Google+ has also an alliance with YouTube, which allows users to access comments directly form their Gmail. It also has the “+1”button that allows people to recommend
sites, the larger the number of “+1”in one page increases its Google ranking in the search.
The Google+ profile is public and its connected with other Google services. This includes basic social networking elements such as profile photo, previous work and school history, interests, places lived and an area to post status updates.
Similar to Facebook, Google+ allows companies to create their own fan pages. This can be used by organizations, individuals and companies which publish their results and send messages to the community.
Additionally, it has a section called communities Google+ where users can associate to the different available communities according to their personal interests.
Pinterest is a web and mobile application company, used as a tool for people to get ideas about different projects and interests. The user can upload, save and organize images, called “Pins” or other media content such as videos known as “Pinboard”.
Users can then save individual pins to one of their own boards using the "Pin It" button, with Pinboards typically organized by a central topic or theme.
Like Facebook and Twitter, Pinterest now lets marketer’s access the data collected on its users. Technology providers including Salesforce,Hootsuites, Spredfast, Percolate, Piqora, Curalate, and Tailwind are presently the only companies granted access to the data. By granting access to users data, Pinterest lets marketers investigate how people respond to products. If a product has a high number of repins, this generally tells the producer of the product that it is well liked by many members of the Pinterest community. Now that Pinterest lets marketers access the data, companies can view user comments on the product to learn how people like or dislike it. A 2013 study on Pinterest practices found that "repinning" was the most popular action by users, followed by likes, and lastly, commenting. According to Salesforce, Pinterest has become a key part of corporate digital marketing strategies (Bussiness clud news).
Youtube
YouTube is a website built to share videos, it was created in 2005 and had a huge world impact with millions of views per day. It uses Adobe flash Video technology to reproduce a large variety of user-generated videos, corporate videos, video clips, TV clips and music videos. There are also other categories such as video blogging and educational videos.
Individuals uploaded most of the content on YouTube, as it is easy to create your own channel and save your favourite videos.
Since Google bought YouTube, they started including videos in the search engines rankings. Artists, politicians and companies upload videos as advertisement, because it’s possible to reach a large audience without investing in publicity. The user-content can be used to obtain information about the company’s reputation, as the number of views can be recorded. YouTube has to possibility to like or unlike the videos. Allowing the user to have both positive and negative feedback.
Instagram is an online mobile photo sharing, video sharing and social networking service which allows users to take photos and videos and share them in a variety of social platforms. As a distinctive feature it confines photos to a square shape and has different filters, which can be applied to enhance the photos, similar to Polaroid images. The maximum duration of Instagram videos is 15 seconds.
It was created in 2010 and rapidly gained popularity with over 100 million users in 20122 and over 300 million users in December 20143, after Facebook acquired it in April 2012. In 2012, it also created web profiles that allow users to use their Instagram account like a social media site. This offered users a web profile featuring a selection of recently shared photographs, biographical information, and personal details.
2
http://www.techhive.com/article/2025801/facebooks-instagram-says-it-has-90-million-monthly-active-users.html?null
3.2 SOCIAL MEDIA: COMPARATIVE TABLE FROM A BUSINESS POINT OF VIEW
Social media Number of
users Focus Platform Relationship interaction Type of Publicity
Facebook 1.3 billion
active Share >News >Stories >Content B2C “Likes” “Comments”, “Shares” “fans” “tags” Facebook Ads Premium Ads Sponsored stories Twitter 240 million
active Share >News >Stories >Content B2C/ B2B “Mentions” “Retweets” “Favoriting” & “following” Promoted Tweets Promoted trends Promoted account
YouTube +1 billion Share >videos informative entertaining B2C “Like” “Dislike” “views” “subscribers” Video Ad Reached Ad Display Ads Google+ 540 million
active Share >News >Stories >Content B2C “Shares” “Comments” “+1” & “add to circles” N/A
LinkedIn 300 million Share >News >Discussions >Enterprise >Industry B2B “Likes” “comments” LinkedIn Ads Pinterest 20 million
active Share >products >Web pages B2C “Likes” “comments” “Repins” ( shares) N/A Instagram 200 million active Share >News >Stories >Content B2C “Likes” “tagging” “mentioning” “comments” N/A (Work in process) Table 2 Source: Facebook pages, Twitter, Instagram, Pinterest, Google+, YouTube
The previous table shows some of the main characteristics of the different social media platforms. Facebook stands out with an amazing 1.3 billion of active users, however all of the platforms have millions of users making it attractive for companies. Finally, many of them have similar type of interaction possibilities, “Likes”, “Comments”, “shares” and “tags”.
Social media forecast
There are several companies that build forecasts about social media platforms in the coming years. We added some graphs and tables that resume values and tendencies of the use of these platforms at a world scale.
Graph 8, displays the number of social media users in the world from 2010 until 2014 and then estimates the tendencies until 2018. We can visualize a positive growth tendency with a small decrease in the percentage of growth due to saturation.
[Note graph 9: Internet users that use some social media platform al least once per week from any type of device]
Graph 9 illustrates the number of social media users with a forecast from 2014 until 2017. Also on the chart one can evaluate the reduction of the relative growth between years. For a more detailed analysis one can observe table 3, which disaggregates the growth between region and the most important countries of each region.
Graph 8. Source: Statista 2015, eMarketer y American Marketing Asociation
Graph 9. Social Network Users Worldwide 2011-2017, billions and % change Source: eMarketer, April 2013.
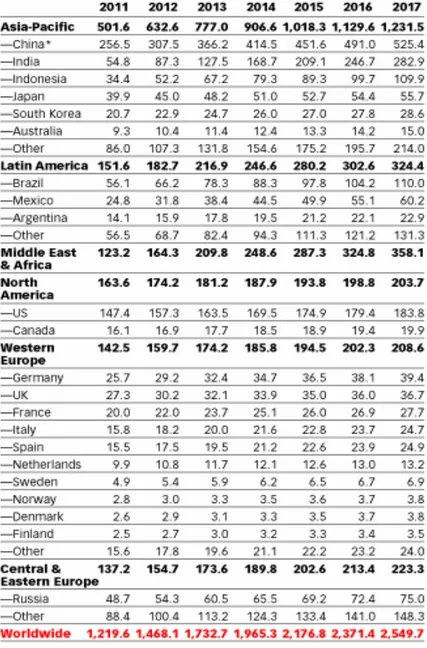
Social media users by region and country 2011-2017. [Millions]
[Note table 3: internet users that use social media at least once per month from any kind of device. The overall percentage sum may not add up due to rounding up]. Finally, taking into consideration a forecast made by eMarketers, we consider that the fan pages growth of the different airlines will have a median greater or equal than the one forecasted by the different studies, as people that fly are the sector which makes more use of the social media platforms.
Table 3 Source: eMarketer, April 2013.
4. CUSTOMER ENGAGEMENT
Posting content is a necessary activity for social media management but it is not a trivial activity, posting the right content is the key to engage customers. If no one is engaging with the content then what is the point? Engaging customers is what really matters in social media and this is what gives added value. Thus, understanding and measuring it, is the first step to a successful social media management.
Customer engagement has become a very popular term to use and appears frequently when researching social media. Along our study we encountered different definitions and approaches when referring to this term.
• “consumer’s intrinsic motivation to interact and cooperate with community
members” (Algesheimer, 2005)
• The intensity of an individual’s participation and connection with the
organization’s offerings and activities initiated by either the customer or the organization. (Vivek, Beatty, and Morgan 2010)
• Customers’ behavioral manifestation toward a brand or firm, beyond
purchase, resulting from motivational drivers such as word-of-mouth activity, recommendations, helping other customers, blogging, writing reviews. (Van Doorn, 2010).
These are just some of many definitions form various authors. However, even though they differ in the exact choice of words, the bottom line to all of them is that customer engagement is equivalent to some kind of action between customer and organization.
The main advantage of social media is that no matter the company’s magnitude it is possible to talk, respond and promote directly to customers. In other words, it allows companies to interact with their customers. As explained in the social media chapter, each platform grants organizations similar interaction possibilities differing sometimes just in their terminology. For example the Facebook shares or Twitters retweets.
The first important step is to define what is important, what the company is looking for with its presence in social media. This way they can set appropriate KPIs to track and measure for later making decision on what and when to post; and to understand the impact of those decisions in the level of engagement. Companies will have to find out what content, features and interactions will increase customer engagement. Yet, given the broad ways to interact with a company through social networks it is necessary to have not only one KPI but a combination of different metrics. According to our study we believe these KPIs should be guided towards understanding engagement.
To better understand the importance of customer engagement, we will explain a model of branding components and relationship with social media (Jansen and Zhang 2009). From the figure below, it can be seen that brand knowledge, which may be affected by social media content, fosters brand awareness and brand image. Also positive customer experiences will increase word of mouth communications that if, correctly managed through social media, can influence brand trust and brand satisfaction. Finally, the creation of social media strategies that raise brand knowledge and brand relationship could increase sales.
Figure 8: [General model of branding components and relationship with social media (adopted and generalized for social media from Jansen and Zhang 2009, by Pletikosa Cvijikj, 2012]
According to an article posted by (Forbes, 2014), customer engagement is highly correlated with revenues and profits and in the future it will become a key metric of business performance. This is given to the fact that engagement is an accurate measure of customer perception and is a primary indicator of customer loyalty. Additionally, a study that analyses the customer experience and engagement in retail (People Metrics, 2008), posted in its key findings that “companies with high levels of Customer Engagement perform better financially than companies with low levels of Customer Engagement.”
4.1 SUCCESS CASES
Case studies are used in many disciplines for teaching purposes to show and explore real world situations. The examples evidence existing work done by airline companies on social media illustrating the impact that social media has, their diverse use and effects on customer engagement.
Westjet Christmas miracle
Westjet took it out of the park when talking about application of social media for marketing campaigns; this Canadian airline surprised the world with its initiative. In the holiday season, Westjet placed a booth containing a life-size screen which turned on when a passenger scanned his boarding pass. This activated the screen and a Santa Claus appeared asking the passenger what they wanted for Christmas. Passengers at this point asked for many things from underwear to Tv sets. Nobody at this point believed that this was all about to become real. The employees where taking note from the audio of the booth and during the flight of the passengers they went off into a frenzy to buy all of what was asked. When the passengers arrived to their destination their luggage was not the only thing that was waiting for them, they had presents wrapped and tagged with their names according to what they had asked for.
Where does social media enter in this amazing stunt? This was documented and edited into a video that was then uploaded on YouTube. Richard Bartrem, Westjet’s vice president of communications and community relations, told Forbes magazine that they had expected approximately 800.000 views from the video. But just days after the video went online it had 13 million views and had been seen in more than 200 countries and made the news in the UK, Japan, Poland and Malaysia. He then added “For a traditional commercial, you could spend well into the mid-six figures for the production alone,” he says. While WestJet won’t disclose how much it spent on the video, Bartrem calls it “a mere fraction” of that. And that’s before the ad buys, which, he says, could normally run well into the millions.”
Graph 11. Source: Simpliflying Graph 10. Source: Simpliflying
According to a case study of this campaign: “The average engagement score that WestJet received in the last 30 days is 120. This was calculated by the number of Likes, Comments, Shares and Estimated Impressions each of its posts got. The post about the Christmas Miracle video saw an engagement score of over 1,700, 14 times more engaging than the average WestJet post and a staggering 35 times more engaging than the sector average engagement score of 50.
Before the video, WestJet was getting an average of 15 fan posts a day. After the video, well, just take a look at the chart below, which shows how many fan posts WestJet has received in comparison to other airlines in the past week.”
Jetblue “Cheeps”
Jetblue airline has given twitter an unique use, they have created a specific twitter account @JetblueCheeps to provide followers updates of last minute deals. They post last minute flights every Tuesday that are offered for a limited amount of time and limited availability.
"We noticed that our main Twitter page was working very well," said Tara Carson, manager-consumer promotions at JetBlue. "And we wanted to evolve that account into a Cheeps page where we could really communicate special deals and offers."
As it can be observed that the offer comes in the format of a friendly language “Go Wild” including a picture and a direct link to Book the flight.
“Ms. Carson wouldn't divulge the number of ticket sales the site has helped generate but she said, "We are absolutely selling tickets" through the Cheeps page. You don't have to be a follower to take advantage of the offers, which they post once a week on Tuesdays and are available until 6 P.M. that day or until all of the available tickets are sold. The offers link to a landing page that highlights exactly where the Cheeps are located within the route system and on what dates.”
This use of Twitter helps fill capacity of unfilled flights, it increases the user traffic, it increases revenue and tells the company what consumers want and what they like, therefore becoming a very powerful tool.