A
Al
lm
ma
a
M
M
at
a
te
er
r
S
St
tu
ud
di
io
or
ru
um
m
–
–
U
U
ni
n
iv
ve
er
rs
si
it
tà
à
d
di
i
B
Bo
ol
lo
og
gn
na
a
DOTTORATO DI RICERCAGEOFISICA
Ciclo XXV
Settore Concorsuale di afferenza: 04/A4 Settore Scientifico disciplinare GEO/10
TITOLO TESI
Continuous geochemical monitoring by mass-spectometer in the Campi Flegrei geothermal area. An application at Pisciarelli-Solfatara (diffuse and fumarolic gases) and at the mud gases during drilling of
the CFDDP pilot hole
Presentata da: Alessandro Fedele
Coordinatore Dottorato Relatore
Prof. Michele Dragoni Dott. Giuseppe De Natale Correlatore
Dott. Renato Somma
TABLES OF CONTENTS
ABSTRACT………..1
1. CAMPI FLEGREI: INTRODUCTION………...2
1.1 Tectonic setting………..3
1.2 Volcanic Setting……….5
1.3 Stratigraphy………12
1.4 Geophysics and subsurface surveys………...15
1.5 Hydrothermal fluids circulation………...16
1.6 The Bradyseism at Campi Flegrei………..17
1.7 Solfatara Geological Setting………...19
1.8 Recent seismicity: the 07.09.2012 event……….25
2. GEOCHEMICAL MONITORING STUDIES……...25
2.1 Monitoring and sampling methodologies volcanic gases in discrete………...25
2.2 Geochemical Continuous Monitoring Techniques…..28
2.2.1 Spectrometer in correlation COSPEC………….29
2.2.2 LI-COR infrared analyzer: rate measurement of CO2 emissions………...31
2.2.3 FTIR (Fourier transform infrared spectrometer).32 2.2.4 DOAS (Differential Optical Absorption Spectrometry)………..32
2.3 Geochemical Discontinuous data at the Solfatara and Pisciarelli from 1996 to 2006………….33
3. A CONTINUOUS GEOCHEMICAL MONITORING AT PISCIARELLI: METHODS OF STUDY……….36
3.1 Field Studies: Pisciarelli geological setting…………..36 3.1.1 Gas emissions in the locality
Pisciarelli - March 2009………...37
3.2 Construction of the gas-line monitoring station (May 16-30 2012, June 1-5, 16-23 2012)……37
3.2.1 Construction of the gas line: different experimental test………...38
3.3 Installation of the Quadrupole Mass Spectrometer …...40
3.3.1 Calibration of the QMS………...40
3.4 Online Monitoring data evaluation………41
4. GEOCHEMICAL EVIDENCE FROM DATA SET MAY-JUNE 2012: CO2/CH4 RATIO AS POWERFUL TOOL TO DETECT MAGMA DEGASSING EPISODES AT CAMPI FLEGREI……42
4.1 Geochemical evidence from previous data (January – June 2009)………..…45
5. DISCUSSION AND CONCLUSIONS………...47
5.1 Implication for the Campi Flegrei unrest and eruption forecast….49 6. CONTINUOUS GEOCHEMICAL MONITORING BY MASS-SPECTOMETER AT THE MUD GASES DURING DRILLING OF CFDDP PILOT HOLE…....50
6.1 The Campi Flegrei Deep Drilling Project: introduction...50
6.2 The pilot hole site……….51
6.3 Drilling updates………....51
6.4 Geochemical monitoring………..53
6.5 Results………..54
ACKNOWLEDGMENT………..56
Abstract
During this work has been developed an innovative methodology for continuous and in situ gas monitoring (24/24 h) of fumarolic and soil diffusive emissions applied to the geothermal and volcanic area of Pisciarelli near Agnano inside the Campi Flegrei caldera (CFc). In literature there are only scattered and in discrete data of the geochemical gas composition of fumarole at Campi Flegrei; it is only since the early ’80 that exist a systematic record of fumaroles with discrete sampling at Solfatara (Bocca Grande and Bocca Nuova fumaroles) and since 1999, even at the degassing areas of Pisciarelli. This type of sampling has resulted in a time series of geochemical analysis with discontinuous periods of time set (in average 2-3 measurements per month) completely inadequate for the purposes of Civil Defence in such high volcanic risk and densely populated areas. For this purpose, and to remedy this lack of data, during this study was introduced a new methodology of continuous and in situ sampling able to continuously detect data related and from its soil diffusive degassing. Due to its high sampling density (about one measurement per minute therefore producing 1440 data daily) and numerous species detected (CO2, Ar, 36Ar, CH4, He, H2S, N2, O2) allowing a good
statistic record and the reconstruction of the gas composition evolution of the investigated area. This methodology is based on continuous sampling of fumaroles gases and soil degassing using an extraction line, which after undergoing a series of condensation processes of the water vapour content - better described hereinafter - is analyzed through using a quadrupole mass spectrometer
This methodology has also been applied successively, during the drilling operations of the 500 meters depth pilot-hole, within the frame of the International project Campi Flegri Deep Drilling Project (CFDDP) in order to analysis the formation gases brought to the surface and extracted out from the drilling mud.
1. CAMPI FLEGREI: INTRODUCTION
Located in the Campanian region (South Italy), the Phlegraean Volcanic District (PVD) is a densely populated active volcanic area, including the Campi Flegrei (CF) caldera, the islands of Procida and Ischia, plus a number of submerged volcanoes. Volcanological, geophysical and geochemical evidences (De Vita et al., 1998; De Vita et al., 1999) support the hypothesis that remnants of the magma source feeding the two large eruptive events of Campanian Ignimbrite (37 ky BP) and Neapolitan Yellow Tuff (14.9 ky BP) are involved in more recent volcanic episodes (e.g. Agnano-Monte Spina eruption, 4 ky BP). Volcanic risk has increased through time as a consequence of rapid population expansion in such active and potentially active volcanic areas of the Earth. The reconstruction of the temporal evolution and the definition of the present state of the magmatic system feeding an active volcano are essential data for hazard assessment. Therefore the restless Campi Flegrei caldera (CFc) is one of the most dangerous volcanic areas on Earth. It is inhabited by more than 1.5 million people, most of whom live in the city of Napoli. The magmatic system is still active as demonstrated by the widespread fumaroles and thermal springs (Allard et al., 1991 Caliro et al., 1997), and by recent bradyseismic episodes that occurred in 1969–1972 and 1982–1984 (Corrado et al., 1977; Barberi et al., 1984, 1989; Orsi et al., 1999).
Since the beginning of their activity the Phlegrean Fields have been characterized by an impressive series of volcanic eruptions from many eruptive vents, the proximal products of which cover an area of about 200 Km2 west of Naples. The Campi Flegrei is an area of extreme tectonic instability. An uplift of about 1.8 m occurred in the area from June 1982 to December 1984, and a swarm of moderate earthquakes lasted from March 1983 to December 1984 (Berrino et al., 1984). Only one minor eruption has occurred in historic time, but the area is known to have experienced major caldera-forming events, and due to the high population it is considered a high-hazard volcanic area (Barberi et al., 1984). The area is currently the target of a comprehensive research and surveillance program (Barberi et al., 1984).
The Campi Flegrei caldera system is similar in size and other characteristics to others which contain major epithermal mineral deposits associated with subaerial caldera volcanism (Guilbert and Park, 1986). The attention of many researchers has been focused recently on these types of deposits; this attention has resulted in a variety of ore-forming models (Bonham, 1986 and references therein). However, the Campi Flegrei volcanic products are mostly trachytic (undersaturated) in contrast with the more common intermediate to felsic calc-alkalic igneous systems. The Campi Flegrei geothermal system can thus provide an analog hydrothermal system, developing in a trachytic resurgent caldera.
The Campi Flegrei volcanic area, has been known and used for its thermal springs since before the Roman Empire. Geothermal exploration of the area from 1939 to 1954 was unsuccessful. An extensive exploration and drilling program was resumed in 1978 as a joint venture of the national utilities, AGIP and ENEL, and the Italian Geodynamic Project (Rosi and Sbrana, 1987). Several wells have been drilled to depths of 3 km (Carella and Guglielminetti, 1983). At shallow depths, partially hydrothermally altered volcanic, volcano-clastic and sedimentary rocks are encountered. At greater depth, their thermo-metamorphic equivalents are encountered. The deep wells have indicated the presence of a saline water-dominated geothermal field with multiple reservoirs (Carella and Guglielminetti,1983). Long-term production and injection tests are underway to ascertain the main characteristics of the field (Carlino et al., 2012).
1.1 Tectonic setting
The Campanian Province, the southernmost sector of the Plio-Quaternary volcanic belt along the Italian peninsula, is formed by the active volcanoes Somma-Vesuvius, Ischia and Campi Flegrei and by the islands of Procida and Vivara. Sometimes the Pontine islands (Ponza, Palmarola, Zannone, Ventotene and Santo Stefano) are included in the Campanian Province even if petrological data suggest that just Ventotene, Santo Stefano and the youngest rocks of Ponza (1 Ma) have similar composition with those from Campanian Volcanoes.
The volcanic centers of the Campanian Province developed in Quaternary extensional basins along the Tyrrhenian Sea border at the intersection between NE-SW and NW-SE fault systems. The Pontine Islands form a row of volcanoes (W-E trend) along the 41st parallel tectonic Line (Serri 1990; Bruno et al., 2000). The thickness of the lithosphere along this transect varies from about 50 km along the Tyrrhenian Sea border to more than 110 km in the Apulia foreland. The depth of Moho has a range between 20-25 km offshore the Tyrrhenian Sea cost, 40 km beneath the central zone of the Apennine chain and 30km beneath the Apulia foreland (Piromallo and Morelli, 2003). The area between the Campanian Province and Vulture (located east of the Apennine chain on the western border of the Apulia foreland) is characterized by a moderate elevation and positive Bouguer anomaly, which crosses the Apennines from Tyrrhenian sea to Apulia. Such a lineament is sited along the continuation of 41st Parallel Line which divides the northern and southern section of the Tyrrhenian basin (Bruno et al, 2000).
The Campi Flegrei Volcanic District lies in the Campanian Plain (CP), between the western side of the Southern Apennine Chain and the eastern border of the Tyrrhenian abyssal plain. Since late Miocene-early Pliocene, the Tyrrhenian Sea has been opening (Scandone, 1979; Doglioni, 1991) and the Calabrian arc has migrated to the SE following rollback of the subducted Ionian plate under Calabria (Selvaggi and Chiarabba, 1995; Piromallo and Morelli, 1997; Gvirtzman and Nur, 2000). Extension in the Tyrrhenian basin was accompanied by contemporaneous compression in the Apennine chain (Meletti et al., 2000). As a result of motions of the Tyrrhenian and Ionian blocks, the CP became a structural depression bordered by NW-SE and NE-SW trending faults (D’Argenio et al., 1973; Ippolito et al., 1975; 1994). Geological, geophysical and petrologic evidence (Selvaggi and Amato, 1992; Serri et al., 1993; Peccerillo, 1999) suggest that subduction of oceanic lithosphere (from the relict Ionian basin) beneath the Apennines occurred concomitant with thinning of the continental lithosphere in the region of the Adriatic Sea, Sicily and North Africa.
1.2 Volcanic Setting
The Campi Flegrei is a restless, nested caldera structure resulting from two main collapses related to the two most powerful eruptions of the volcanic system (Orsi et al., 1992, 1995, 1996.): the Campanian Ignimbrite CI. eruption (37 ka, Deino et al., 1992, 1994; Armienti et al., 1983; Rosi and Sbrana, 1987; Rosi et al., 1983, 1996; Barberi et al., 1991; Fisher et al., 1993; Civetta et al., 1997) and the Neapolitan Yellow Tuff (NYT) eruption 12 ka (Alessio et al., 1971; Orsi and Scarpati, 1989; Orsi et al., 1992, 1995, 1996). The structural boundaries of both CI and NYT calderas result from partial reactivation of earlier regional faults (Orsi et al., 1996.). The central part of the younger NYT caldera is uplifting since its formation, likely as a consequence of the arrival of new magma in the system (Orsi et al., 1996).
The uplift occurs through a complex simple-shearing block resurgence mechanism (Orsi et al., 1991). Because of this mechanism, the conditions for magmas to rise to the surface were established only in those parts of the caldera floor subject to extensional stress (Orsi et al., 1996). Thus, the caldera structure strongly constrains the areal distribution of volcanism active during the past 12 ka. Volcanism in the Campi Flegrei began more than 60 ka ago and was essentially explosive and subordinately effusive (Orsi et al., 1996; Pappalardo et al., 1999). The sedimentological characteristics of deposits erupted before the CI eruption indicate that volcanism was highly explosive and that vents were located also outside the Campi Flegrei depression (Orsi et al., 1996). The products erupted before the CI eruption range in composition from latite to phono–trachyte. The CI is the largest pyroclastic flow deposit of the Campanian area. The products range in composition from trachyte to phono– trachyte. They covered an area of 30,000 km2 with an estimate volume of erupted magma of 150 km3 DRE (Fisher et al., 1993; Civetta et al., 1997).
Volcanism between the CI and NYT eruptions was explosive, mostly hydromagmatic, with products ranging in composition from latite to phono– trachyte. The morphological and sedimentological characteristics of the exposed rocks suggest that vents were active inside the CI caldera (Orsi et al., 1996;
Pappalardo et al., 1999). The NYT was the most powerful phreatoplinian eruption of the Campanian area. The volume of the erupted magma is estimated at more than 40 km3 DRE. The area covered by the tuff was about 1000 km2 including the bays of Napoli and Pozzuoli. The products range in composition from alkali– trachyte to latite, although the complex chemostratigraphy has allowed us to infer that the eruption was fed by three geo-chemically distinct batches of magma (Orsi et al., 1992, 1995; Wohletz et al., 1995). The evolution of the Phlegraean magmatic system before the eruption of the Neapolitan Yellow Tuff was characterized by an open-system behavior with involvement of geochemically distinct magmas interplaying in a complex behaviour (Pappalardo et al., 1999). After the NYT eruption the CFc has been the site of both volcano-tectonic activity and intense volcanism located inside the younger caldera depression. About 72 eruptions occurred in three epochs of volcanic activity, between 12 and 9.5 ka, between 8.6 and 8.2 ka, and between 4.8 and 3.8 ka (Di Vito et al., 1999), generated by vents located either inside the NYT caldera or along its structural boundary (Fig. 1).
Fig. 1. Campi Flegrei sketch map (from Mormone et al., 2011b) showing the main tectonic structures, the eruptive vent locations in the last 14.9 ka, the ground movements, the distribution of the temperature at <200 m, the ground water circulation (De Vita, 1990) and the location of AGIP’s (1987) boreholes.
During the first epoch (12–9.5 ka), vents were located along the structural boundary of the NYT caldera, except those of the St. Teresa, La Pietra and Rione Terra eruptions. They were dominantly tuff rings and tuff cones, suggesting that the eruptions were mostly triggered by efficient water magma interaction. The vents of the second epoch (8.6–8.2 ka) were mostly located along the northeastern boundary of the NYT caldera, except that of the Fondi di Baia eruption. After a quiescence of about 3000 years, volcanism resumed. The vents of the latter epoch (4.8–3.8 ka) were mostly located in the northeastern sector of the caldera floor which was subject to extensional stress, except for the Averno eruption which occurred in a compressive regime sector. The volcanic activity was mostly explosive with phreato-magmatic phases, and subordinately effusive
(Orsi et al., 1996; Di Vito et al., 1999). The subsequent and most recent eruption formed the Monte Nuovo tuff cone in 1538 AD, after a quiescence of about 3000 years.
After the Neapolitan Yellow Tuff eruption and related caldera collapse that occurred within the 39 ka-caldera, at least 70 eruptions, took place in three epochs of intense activity (15.0÷9.5, 8.6÷8.2 and 4.8÷3.8 ka) and followed one to another at mean time intervals of a few tens of years. The last event was in 1538 AD, after about 3.0 ka of quiescence, and formed the Mt. Nuovo tuff cone (Di Vito et al., 1987; Piochi et al., 2005a). Sixty-four of these eruptions were phreatomagmatic to magmatic explosive events, and 76% of these eruptions occurred from vents active in the central-eastern sector of the caldera (Mormone et al., 2011).
Fig 2. Chronology of the volcanic activity in Campi Flegrei
Fallout deposits of the I epoch were distributed manly toward north-east sector of the caldera and the Camaldoli hill, 15 km from the caldera centre (Fig.2). Only fallout beds of the Pomici Principali Tephra are widely distributed and are 20 cm thick along the western margin of the Apennines, at about 50 km from the vent.
Pyroclastic currents travelled within the caldera floor and reached the Campanian plain.
The eruptions of the II epoch were all low-magnitude events. Fallout deposits covered only the caldera and its immediate surroundings, while most of the pyroclastic currents deposited their load within the caldera lowland. The fallout deposits of the III epoch and of the Mt. Nuovo eruption covered the caldera floor and its surroundings. Only beds of the Agnano-Monte Spina Tephra, the largest sub-plinian postcaldera event, covered a large area up to the Apennines. Pyroclastic currents travelled across the caldera floor and subordinately over the northern slopes of the Camaldoli hill (Orsi et al., 2004; de Vita et al., 1999).
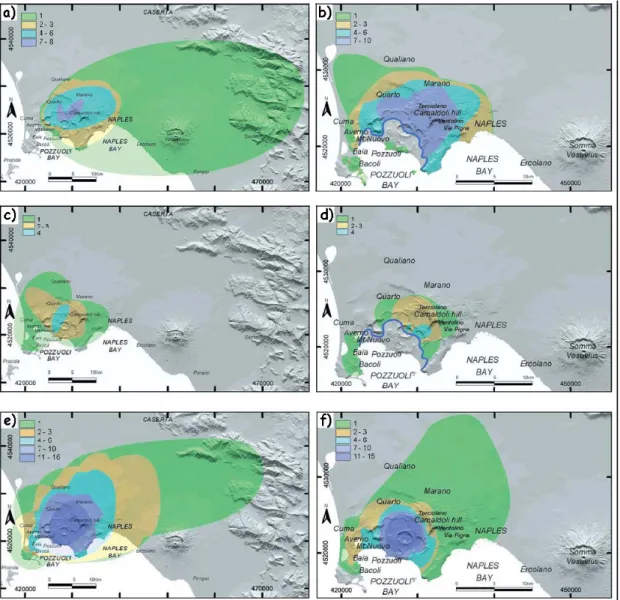
Figure 3 . Distribution of the pyroclastic deposits of the past 15 ka at the Campi Flegrei caldera (from Orsi et al., 2004). a, c and e: frequency of deposition of fallout beds thicker than 10 cm of the I, II and III epoch, respectively; b, d and f frequency of deposition of pyroclastic-current beds cm of the I, II and III epoch, respectively.
In the past 15 ka, the caldera floor has been affected by tectonic resurgence causing a maximum net uplift of about 90 m at the La Starza marine terrace which determined the definitive emersion of the terrace at about 4000 years BP (Isaia et al., 2010). Ground movements are also documented during the past 2.0 ka and, in particular, since late 1960s, unrest episodes have been recorded by the Osservatorio Vesuviano monitoring system; the largest ones took place in 1969-72 and 1982-84 and generated uplifts of 170 and 180, respectively, and the evacuation of part of Pozzuoli town. Geometry of these short-term deformation
events is very similar to that of the long-term deformation, likely indicating a similar stress regime over at least the past 5 ka.
Seismicity has been documented in the Campi Flegrei caldera since the 15th century. Historical chronicles describe many earthquakes felt by Naples’ inhabitants in the 2 years preceding the last Monte Nuovo eruption. Moreover, seismic data recorded in the last 30 years has evidenced the occurrence of mostly volcano-tectonic events connected to the uplift phases of the unrest. The seismic sequence (De Natale and Zollo, 1986; D’Auria et al., 2011) clustered in two major epicentral areas: one between the town of Pozzuoli and the Agnano Plain, ellipsoidal in shape with a 5 km long major axis, and the other one between Baia and Monte Nuovo within the Gulf of Pozzuoli, with an elongated NNW-SSE shape. Troise et al. (2003) explained the volcano-tectonic seismicity in terms of the Coulomb stress changes due to a shallow overpressure source, superimposed to the regional tensional stress field. The authors invoked the main role of the geothermal systems in the volcano seismicity and deformation.
1.3 Stratigraphy
The most striking structural element of the Phlegrean Fields is represented by a 12 km wide caldera, mainly resulting from collapse following the emplacement of the Campanian Ignimbrite a huge ash flow deposit that, about 35.000 years ago, covered the entire Campanian Plain between Roccamonfina and Salerno (Rosi and Sbrana, 1986).
The recent geothermal exploration in Campi Flegrei is concentrated in two inner areas of the major caldera: (1) Mofete, in the western sector, and (2) San Vito, in the central sector (De Vivo et al. 1989).
The remnants of the Mofete cone are located at the northwestern end of Pozzuoli Bay. The name "Mofete" is derived from the numerous occurrences of hydrothermal manifestations between Lucrino Lake, Baia and Fusaro Lake. The Mofete volcano is located in an inner position compared with the grossly annular
distribution of other volcanoes of similar age. The stratigraphic sequence (Fig. 4) reconstructed by the Mofete 1, Mofete 2 and Mofete 5 wells is quite uniform. In the first 250 m are found recent pyroclastics deposits with yellow tuffs at the base. From 250 m to 800 m, the sequence consists of chaotic marine tuffites with trachytic-type lava at the bottom. From 800 m to 1300 m there is a homogeneous trachytic lava complex probably corresponding to a lava dome. From 1300 m to 2000 m pyroclastic products alternating with lavas and subordinate siltites of marine environment are found. Below 2000 m, the lithology is quite heterogeneous with sedimentary rocks alternating with trachylatitic lava layers. The primary rock types were difficult to recognize at this depth because of the pervasive thermometamorphic recrystallization.
The San Vito plain is located in the central portion of the Campi Flegrei, about 2 km north of the city of Pozzuoli. The plain formed as a result of volcano-tectonic collapse that occurred after the building of the Gauro tuff cone (10,000-11,000 yr B.P.), the largest volcano of the Campi Flegrei area. The geology of the plain is characterized by a deep pyroclastic cover formed in the recent subaerial post-caldera period. The pyroclastics filled up the collapse structure (Bruni et al., 1985).
Fig. 4. Cross section including wells MF5, MF2 and MF1 in the Mofete geothermal field. Well MF3 is projected onto the cross section and the oblique well MF7D is also shown. MF5, MF2, and MF1 are vertical. Total depth (t.d.) is indicated at the bottom of each well (meters). 1 = pyroclastics from Baia ~ 8400 yr. B .P. ); 2 = yellow tuff; 3 = chaotic tuffites; 4 = subaerial tufts; 5 = trachytic lavas; 6 = latitic lavas (lava domes ); 7 = interbedded tuffites, tufts, and lavas ( submarine environment ); 8 = interbedded shales, siltstones, and sandstones (marine); 9 = top of thermometamorphism; 10-- isotherms ( ° C ) from measured down-hole well temperature. No vertical exaggeration. From (De Vivo et al. 1989).
The stratigraphy of the uppermost 1000 m of the San Vito 1 and San Vito 3 wells consists of a rather chaotic sequence of pyroclastic products of pumice and cinder tuffs, tuffaceous breccias, and chaotic tuffites belonging to the post-caldera period. From 1000 m to 1350 m homogeneous trachytic rocks occur. Below this lava body, down to 1900 m there are again chaotic tuffites alternating with trachytic volcanics and a complex sequence containing siltites with subordinate volcanics. Below 1900 m the effects of thermometamorphism are observed; the thermometamorphism obliterates completely the primary structure of the rocks in the deepest portions of San Vito 1 well (De Vivo et al. 1989).
1.4 Geophysics and subsurface surveys
Geophysical surveys and analyses yielded a quite good knowledge of the very complex subsurface structure of the Campi Flegrei caldera. In particular, seismic wave velocities (Aster et al., 1989; Judenherc and Zollo, 2005), attenuation (De Siena et al., 2010) and scattering (Tramelli et al., 2006) tomographies evidenced a ring-shaped high P wave velocity zone mainly at 1.5 km b.s.l. offshore in the southern part of the Gulf of Pozzuoli that also extends onshore along the western border of the Gulf, in the Capo Miseno area, coinciding with a positive gravity anomaly (Barberi et al., 1991). It represents the buried trace of the southern caldera rim, evidenced by positive gravity anomaly onshore. The same data also excludes the presence of molten rocks with volume larger than 1 km3 but it indicates high probability for the existence of fractured over-pressured gas-bearing rocks at depth shallower than 4 km. Low attenuation values, north-east of the Solfatara crater, are compatible with the presence of a gas-rich volumes between a depth of 0 and −2.5 km. The medium appears to be more homogeneous below -4 km, where, Battaglia et al. (2008) found P wave velocity of 5.5 km/s and inferred the (doubtful on the base of sedimentological data) presence of limestone as the basement of the caldera. Interestedly, a large-amplitude seismic reflection zone occurs at ~7.5 km depth and probably corresponds to the top of an extended melt-bearing crustal volume beneath the caldera (Zollo et al., 2008). The Campi Flegrei subsurface has been investigated ‘40s years (AGIP, 1987; Rosi and Sbrana, 1987; De Vivo et al., 1989, Carlino et al., 2012) by drilling that reached depth down to 1600 m to 3000 m bsl. The maximum measured temperatures within the caldera are >350° C at depth of 3000 m, with a geothermal gradient between 100° and 170°C/km (Rosi and Sbrana, 1987). Cored samples provide a picture, although inhomogeneous and discontinuous, of the rock types and physical properties: density and porosity and, subordinately, permeability and P and S-wave velocity of subsurface sequences (e.g., AGIP 1987; Rosi and Sbrana, 1987; De Vivo et al. 1989; Mormone et al., 2011b). The drilling investigations evidenced tuffites bearing marine fossils emplaced during the marine ingression inside the Campanian Ignimbrite caldera and displaced at different depths and
elevations during the following activity, and a well developed and depth-dependent mineral alteration zoning related to the increasing temperature of hydrothermal activity (Rosi and Sbrana, 1987; Mormone et al., 2011b). This investigations did not reach the exploitation phase due to technological and communication problems. Recently, the Campi Flegrei Deep Drilling Project (De Natale and Troise, 2011), sponsored by the International Continental Scientific Drilling Program, foresees the realization of medium-to-deep wells in the caldera with the ambition of stimulating interest in geothermal energy exploitation and technology development and, in addition, of installing downhole monitoring systems.
1.5 Hydrothermal fluids circulation
Permeable zones characterized by the presence of hydrothermal fluids have been recognized at various depths in Phlegrean Fields. Available information refers only to the drilled areas (Mofete, S.Vito, Agnano).
In the Mofete area the first important aquifer occurs at the base of the yellow tuff formation at a depth of 150-300m showing temperatures in the range 100-130 °C. The impervious base is formed by deeply argillified lithified tuffites while the permeability of yellow tuff is mainly due to intense fracturation. A sequence of nearly pervious deposits follows downward with a thickness exceeding a thousand meters until a second aquifer with good lateral continuity is crossed within the calc-aluminum silicate zone (1,250-1,600 m depth, about 300 °C).
The rocks of this zone acquired a remarkable rigidity and brittle behavior by hydrothermal alteration and became permeable by fracturing. Other permeable horizons with fluid circulation occur within the thermo-metamorphic zone (top at 1850 m about 350 °C) where decarbonation reactions have induced porosity and permeability. The lateral extension of such aquifer cannot be evaluated on the basis of the deep wells that have presently reached the thermo-metamorphic zone. The hydrothermal circulation in the S.Vito area appears poorly defined because of the lake of reliable well test data. Permeable horizons occur in both calc-alluminum silicate and thermo-metamorphic zones at greater depth than in the
Mofete area. In this area there is no evidence of widespread aquifers in the first 2,000m with the exception of the near-surface phreatic water tables interbedded within both the yellow tuffs and the recent loose subaerial pyroclastics.
Scattered data from the Agnano plain suggest a first relevant deep aquifer at a depth of 1,400m with temperatures exceeding 250 °C (AGIP 1987; Rosi and Sbrana, 1987).
1.6 The Bradyseism at Campi Flegrei
Several theories were formulated regarding the dynamic of eruptions in Campi Flegrei area, but they are all based on limited evidence. The only eruption occurred in ancient period at Campi Flegrei described by contemporary reporters is the eruption that generated Monte Nuovo, a little volcanic cone with elevation of 150 m near Pozzuoli. We know that Monte Nuovo represents one of the minor events of the eruptive history of Campi Flegrei, consisting in the eruption of a relatively small volume of magma (about 25 millions of m3). Reading contemporary chronicles it is possible to assess the existence of remarkable bradyseismic events during the period before the eruption.
At the beginning of XVI century the area between Baia and Pozzuoli developed a progressive elevation, evidenced by the migration of the coast line. This bradyseismic phenomenon is confirmed by several seismic events occurred two years before the eruption of 1538 A.D. First interpretations of bradyseismic events were in 1792, when some scientists started to study the traces of marine organisms on the Roman column of Serapide Temple, the ancient market of Roman Age, near the Port of Pozzuoli. From that moment the variation of the sea level in Serapide Temple and in general of bradyseismic phenomena were interpreted in various ways. A good description is given by Parascandola (1947), where the author reconstructed the variations of level in Serapeo Temple relatively to the last 2000 years sea level. The reconstructed trend shows a general subsidence starting from the eruption of Monte Nuovo.
In the last 30 years bradyseisms at Campi Flegrei made often the news, because of an abrupt inversion of ground movement, characterized by two episodes of fast uplift occurred within a decade from one another. The first of this episodes occurred between 1970 and 1972 when the ground, accompanied by several earthquakes, raised about 70 cm in the Port of Pozzuoli.
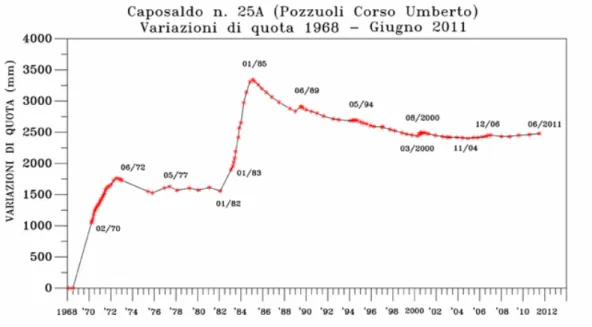
The most important episode occurred between 1982 and 1984 when a very fast uplift of the ground level was recorded (Fig. 5); this level didn’t change in the previous ten years but showed only few oscillations. The ground uplift started during summer 1982 and continued with a mean velocity of about 6 cm every month (but it pikes of 0.5 cm per day were recorded) until 1984, when the total uplift reached the value of 1.80 m. During the autumn of 1984 uplift velocity decreased, and at the end of that year inflation ended and a new phase of deflation started which continues today. Uplift episodes are also characterized by horizontal deformations whose value is approximately equal to the half of vertical uplift.
Fig 5. Ground deformations in Pozzuoli from 1968 to 2012 (from Del Gaudio et al. 2010)
Ground deformations in volcanic areas are generated by the rising of the pressure of the rocks at a certain depths; the expansion source depth is determined by the amplitude of deformed area. Ground deformations in Campi Flegrei, limited to a
circular zone with radius from Pozzuoli less than 3 km, showed a source centre at a depth of 2-3 km.
In this area proposed causes for the deformations are: 1) the migration of hot flows under pressure (Oliveri del Castillo and Quagliariello, 1969; Casertano et al., 1976; Oliveri del Castillo and Montagna, 1984); 2) overpressure in a magmatic chamber (Corrado et al., 1977; Berrino et al., 1984; Bianchi et al., 1987); 3) overpressure of the magmatic chamber and heat convective transfer to confined superficial aquifers (Bonafede, 1990; De Natale et al., 1991).
The latter hypothesis is supported by De Vivo et al. (1989) controlla ed inserisci l’ultimo lavoro di De Vito et al., 2012) who suggest that ground deformations could be generated by the heating of the aquifers overlying the magmatic chamber. Heated fluids would remain under lithostatic pressure for long periods and the heat, supplied by continuous input of magma, could determine overpressure in the upper area confined by impermeable rocks, causing uplift of overlying rocks (positive bradyseism). A crisis would occur with a change from lithostatic to hydrostatic pressure, with consequent boiling, hydraulic fracturing, volcanic tremor and then pressure release. At this point the area would experience maximum rising, then followed by pressure release and beginning of subsidence. Afterward the system, saturated with boiling fluids, begins to seal again. The beginning of a new positive bradyseism phase will occur only after several years when the system “reloads” with new lithostatic pressure. Ground deformations and the seismicity are associated with the presence of intense fumarolic and hydrothermal activity, concentrated in the crater of Solfatara where CO2and H2O fluxes are particularly intense and probably originated by a magmatic degassing system (Chiodini et al., 2001).
1.7 Solfatara Geological Setting
The Solfatara volcano, about 2 km east-northeast of Pozzuoli, is a tuff cone (180 m above sea level) characterized by a sub rectangular (0.5x0.6 km) crater, shaped by NWSE and SW-NE trending faults (Fig. 6) along which the vegetation lacks. The volcano generated a low-magnitude explosive eruption that deposited a tephra
over a small area (<1 km2), named Solfatara Tephra, during phreatomagmatic and subordinate magmatic explosions (Di Vito et al., 1999). This tephra overlies the Monte Olibano and Accademia lavas, both younger than Agnano-Monte Spina Tephra (4.1 ka), and underlies the Astroni Tephras (3.8 ka), from which it is separated by a thin paleosoil containing many charcoal fragments.
Fig 6. The Solfatara crater. The photo evidence the degassing area (white area) and the structural features: main faults depicted as red lines, craters as green dashed lines and the marine terrace of “La Starza” as white dashed line (from Isaia et al. 2010).
The Solfatara Tephra comprises a phreatomagmatic coarse breccias overlain by a sequence of stratified, dune-bedded deposits composed of accretionary lapilli-bearing ash surge layers, alternating with thin, well sorted, rounded pumiceous lapilli beds pyroclastic pumiceous fallout beds. The breccia contains large blocks of green tuff, altered lavas and dark scoriaceous bombs engulfed in a hydrothermally altered matrix. The scoriae of the basal breccia are porphyritic containing crystals of sanidine, plagioclase, clinopyroxene, biotite and Fe-Ti oxides, in order of decreasing abundance. Rare crystals of leucite converted to analcime are also present. The late erupted pumice fragments are alkali-trachytic in composition, crystal-poor to subaphyric pumice (upper sequence), and contain
rare crystals of plagioclase. A thin massive fallout layer, grey to yellowish in color, consisting of fine-to-coarse ash with scattered pumice clasts and interbedded pumice beds represents the distal counterpart of the Solfatara Tephra. It is a deposit dispersed towards the north-east with a minimum measured thickness of 5 cm at Verdolino, at about 7 km from vent.
Fig 7. - CO2 fluxes in December 1998 (a) and in July 2000 (b) and main structural features within the Solfatara crater. Contour lines of log CO2 were drawn by ordinary kriging, every 0.2 g m−2 day−1. Modified from Chiodini et l. (2010).
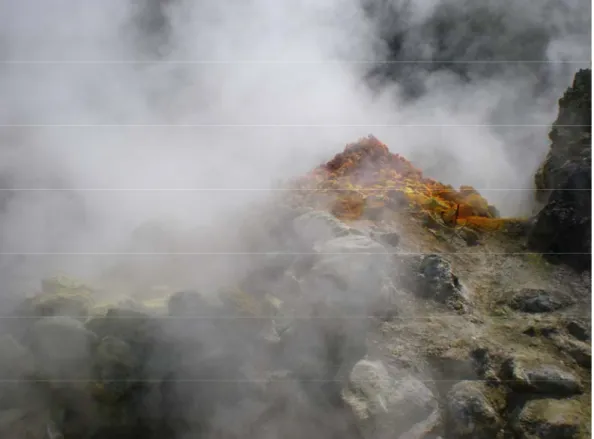
The crater of the Solfatara has been the site of an intense hydrothermal activity since Greek times. It is the most impressive manifestation of the present hydrothermal activity of the caldera, which includes both focused vents, with a maximum temperature of about 160°C (Bocca Grande fumarole), and large areas of hot steaming ground. The average molar composition of the fluids is H2O about
82 %, CO2 17.5%, H2S 0.13% and minor amounts of N2, H2, CH4 and CO.
Systematic measurements of the gas fluxes from the soil evidenced up to 1500 tonnes/day of CO2 emission (Chiodini et al., 2001) through the main fault system,
coinciding with temperature up to 95°C (Granieri et al., 2010); the degassing area is enlarging since the first analytical campaign (Fig. 7). The isotopic compositions of H2O, CO2 and He suggest the involvement of magmatic gases in the feeding
by an aquifer system as suggested by the absence of the soluble acid gases SO2,
HCl and HF, typical of the high-temperature volcanic gas emissions. Boiling of this heated aquifer(s) generates the Solfatara fumaroles. Based on geochemical data, the hydrothermal system at the Solfatara crater consists of a heat source, possibly represented by a relatively shallow (few kilometers deep) magma batch, a geothermal system located above the magma, and the shallow hydrothermal system.
In the Fig. 8 (Chiodini et al., 2010; Troiano et al., 2011) is shown a diagram of operation of the hydrothermal system of Solfatara obtained from the comparison of the results of previous studies and simulations physical-numeric. In particular, the figure 8 shows the expected temperatures and the relationship vapor-liquid made the approach to physical conditions stable, after 2000 years of simulated injection of steam and carbon dioxide at 350 ° C and with a composition similar to that of fumarolic fluids obtained before bradyseism crisis of 1982 - 84 and with a flow rate similar to that measured currently Solfatara. The numerical simulations predict the entire center column of fluids upward, below the injection zone, the presence of a vapor phase separate, either as a single area in the gaseous phase (as mea 1500-1400 300-100 m depth ) or as an area in two phases (gas-liquid). In this central area of the plume, the flow moves from an area of high temperature, near the injection zone, a zone consisting of a single gaseous phase at temperatures from 190° C to 230° C in agreement with the zone of steam indicated by the geochemical analyzes.
An important issue for discussion is the implication of this new geochemical model for fumaroles of Solfatara surveillance geochemistry of the Phlegraean Fields. During the last 24 years of monitoring of the geochemical composition of the fumaroles the ratio of the concentration of CO2/H2O showed three clear peaks
in 1985, 1990 and 1995 which was followed a few months later, a lifting of the ground. According Caliro et al. (2007) these peaks reflecting the composition of the fumaroles rich component of magmatic, probably due to episodes of degassing of the magma in depth during periods of lifting the soil.
Other physical and numerical simulations have shown that periods of intense degassing of fluids rich in CO2 can explain other relevant characteristics of the
crisis of 1984, 1990 and 1995, such as ground deformation and gravity anomalies (Todesco et al., 2004; Todesco and Berrino, 2005). After 2000, the ratio of the concentration of CO2/H2O fumaroles showed no peaks but a slow upward trend
still underway. This different behavior of the composition of fumarolic reflect a change in the style of degassing at depth. If this growing trend is the ascending portion of fluids rich in CO2 then this is easily relatable to an episode of
outgassing from the deepest portion of the magmatic system. Alternatively, this behavior could be related to a magmatic source that Degas constantly compared to isolated periods as previously thought. In particular a slow lifting of the soil is started in 2004 and continues to this day and is characterized by a deformation longer and slower than previous episodes of lifting (Troise et al., 2007).
Cioni et al (1989) suggest that the relationship CO2/H2O behave like a true
precursor of the crisis of 1984 as it was thought that a geochemical indicator for monitoring the boiling hydrothermal confined aquifer.
In this first interpretation, the decrease in the ratio CO2/H2O observed
before the crisis of 1984 and even before the smaller crisis that followed, it could indicate an increase in the boiling process and overpressure of the aquifer due to an increase in the flow of heat from magmatic body. Unlike Caliro et al. (2007) show that the ratio CO2/H2O is controlled by the mixing zone of magmatic gases
and liquid of meteoric origin. The decrease of the ratio CO2/H2O corresponds to
periods in which there is a low flow of magmatic component and underpressure of hydrothermal plume in agreement with the subsidence of the soil always accompanied by periods of decrease of the ratio gas/vapor.
Fig 8. Geochemical conceptual model of Solfatara modified after Caliro et al (2007), considering results from simulation (Chiodini et al., 2010; Troiano et al., 2011).
At the present the Solfatara is one of the most active geothermal areas where the geochemical surveillance of the chemical compositions of both the fumarolic fluids than the CO2 fluxes from the soil. Strong variations involving both main
and minor gas species were observed during the bradyseismic crises in 1982– 1984, 1989, 1994, and 2000 and minor in most recent years. The monitoring activities highlighted a strong correlation between chemical compositions at the fumaroles, seismicity and ground movements (D’Auria et al., 2011), likely as the results of periodic injections of hot CO2-rich fluids at the base of a shallow
1.8 Recent seismicity: the 07.09.2012 event
Since 2005 there is an uplift of the CFc, at different speeds, with a total rise of about 15 cm and a speed increase during the end of the 2012. Previously the area was characterized by a slow decrease began in 1985, when it ended the crisis that began in 1982. This crisis saw an increase in total soil greater than 1.5 meters in Pozzuoli. These movements were accompanied by earthquake swarms. Swarms have occurred since 2005 have been characterized by a degree of magnitude comparable to the current year. The Vesuvius Observatory, Naples section of the INGV, performs continuous monitoring of such phenomena using permanent networks for seismic measurements, ground deformation and geochemical, installed in the Phlegraean area.At 09:15 of September 7th 2012 began a seismic swarm at Campi Flegrei. There were about 200 events, all characterized by low energy, and only some felt by the population in the interested area. Those of greater magnitude, the maximum value of which did not exceed 1.6 Ml, were localized in the central area of the CFc (Pozzuoli). Major events occurred at 09:34 (Ml 1.6), 10:03 (Ml 1.1) and 10:25 (Ml 1.5). (from bulletin of Osservatorio
Vesuviano)
2. GEOCHEMICAL MONITORING STUDIES
2.1 Monitoring and sampling methodologies volcanic gases in discrete
Gases dissolved in magma provide the main energy of volcanic eruptions, but only recently have been introduced new techniques for measuring the different types of volcanic gases released into the atmosphere. Sulphurous volcanic gases and vapors visible are usually the first things that people warn when visiting an active volcano. There are also a number of other invisible gases escaping from fumaroles, active vents and porous surfaces on the ground. These gases are
released, reaching the surface, both when the magma explodes and when this cools and crystallizes to below it.
One of the main objectives of gas monitoring is to determine changes in the release of certain gases from a volcano, mainly carbon dioxide and sulfur dioxide. These variations can be used with other control data to provide warnings in case of imminent eruptions. The gas from most of the volcanoes are difficult to be sampled especially when the volcano is restless. In fact the direct gas sampling requires that scientists are positioned in the vicinity of fumaroles very hot or even within the crater itself. Often, intense and dangerous fumes, also accompanied by bad weather and the possibility of sudden eruptions can ensure that the sampling be hazardous or even impossible. Currently it seeks to address a very important challenge, and that is able to sample the acid gases such as SO2, easily soluble in
water. Thus, volcanic eruptions with abundant surface water or underground water can prevent the scientists to measure the emissions of acid gases, even after the explosive eruptions. Since CO2 is less likely to be masked by the presence of this
water is measured when the volcano begins to be restless and this can be important to determine if there is a significant degassing of the magma.
The direct sampling of gases escaping from fumaroles is currently the only way: (1) to fully characterize the composition of the gases emitted by volcanic eruptions, and (2) to collect the data needed to determine the origin of certain gases.
As in all types of volcanic monitoring is important to identify the phenomena typical of precursors of an impending eruptions; therefore is fundamental to record a large amount of data of volcanic gases during the quiescence period in order tto determine the normal geochemical compositions of baseline so that they can be distinguished from a future anomalous geochemical signal that could instead indicate an imminent eruption.
The volcanic gases are one of the most important sources of information on the current degassing from the interior of the Earth. The chemical nature of these gases is highly variable, and not only differs from volcano to volcano, but also from fumaroles fumaroles.
Recent surveys carried out fumarolic fluids began in France in the second half of the eighteenth century in which they classified the fumarolic emissions manly into three types (Scandone, Giacomelli L., 2004)
a) high temperature (fumaroles dried), T = 1000 ° C; b) average temperature (fumaroles acid), T = 300 ° C; c) low temperature (fumaroles neutral), T = 100 ° C.
Often, the number of samples collected for each area is insufficient to provide a full spectrum of chemical and isotopic data that you want. In the past, the geochemical studies on volcanoes has been widely discontinuous, thus implying the collection of a large amount of data for periods of time too short. In many cases, these data represent only brief moments in the life of a volcano and are insufficient to provide a complete model of its geochemical behavior. The volcanic gases during the migration to the surfacare, are subject to processes of expansion, cooling, and oxidation. Therefore, all samples collected at fumaroles represent only the fraction of low pressure gas originating, which has probably interacted with the shallow hydrothermal system. Furthermore, phase changes may occur due to sublimation and condensation. The volcanic volatile phase is therefore divided into two components: the volcanic gases emitted in a gaseous state and sublimated that, because of the cooling into the atmosphere come as solid phase or liquid. The latter are often deposited around the fumaroles.
Before 1975, the sampling of the gas phase was carried out by entering the gas in a container in which it was possibly a vacuum. The method most commonly used currently is being developed by Giggenbach (1975) and involves the use of a bottle partially filled with a 4 N solution of caustic soda (NaOH). The container is attached to a dewar silica tube (to avoid condensation), inserted into another pipe silica or titanium that is placed inside the fumaroles. During sampling, the gas bubbling through the solution NaOH; the H2O condensate and acid gases (CO2,
SO2, H2S, HCl, HF) are absorbed by the solution (Symonds et al., 1994).
The non-condensable gases (H2, CO, CH4, COSN2, Ar, O2) are collected in the
upper space of the container. In the laboratory are then analyzed the uncondensed gases through gas-chromatography, while the solutions are analyzed with various chemical techniques.
2.2 Geochemical Continuous Monitoring Techniques
The measurement of flow due to degassing from the floor of the main volcanic gases involves measuring a wide area, typically using a mesh with a sampling interval of 10x10 meters across the main structures of the volcano which systems of fractures and rift zones that can be identified by geological maps or aerial photographs. Currently you can analyze up to 50-100 sites per day, thus allowing a more rapid localization of fractures of exit gases and the determination of their distribution and their chemical characteristics. The anomalies of the gas can be associated with fractures both hidden and visible, and their origin can be assessed by their geographical distribution, their chemical nature and their relationship with fluid sources and fumaroles in the area. The data can be used to produce a map of geochemistry (Lombardi et al. 1984) that shows the extension and the type of abnormalities of gas and their possible relationship with the presence of a reservoir of magma or hydrothermal localized in the subsoil.
The volcanic gases coming from the soil (Fig. 9) are normally analyzed at depths of 0.1-0.7 meters below the ground surface, in order to minimize the effect of changes in the weather.
The monitoring of degassing at Solfatara is achieved through the continuous operation of stations regularly measure the flow pattern in the selected sites. These monitoring stations measure the amount of CO2 released by the soil and the
Fig 9. measure the amount of CO2 released by the soil (from Chiodini et al., 2001)
2.2.1 Spectrometer in correlation COSPEC
It's the most widely used technique to monitor SO2 emissions from volcanoes. The
spectrometer uses correlation to the solar UV radiation as the source diffused into the atmosphere. The instrument (Fig. 10), through a system of calibration, measures the percentage of absorbed radiation dall'SO2 and estimate the
concentration of sulfur dioxide along the optical path. The product of the absorption profile of the gas and the wind speed corresponds to the speed of emission of the SO2.
Measurements can be made either from the ground plane. However, high flows of SO2 emitted during explosive eruptions can not be measured with this method due
to the absorption of light by particles of ash. This technique is used in the phases of stagnation between explosive eruptions or steps of degassing during the effusive eruptions. The SO2 concentration can also be measured using
instrumentation installed on artificial satellites as one called Total Ozone Mapping Spectrometer (TOMS) for measurement of ozone in the atmosphere. The SO2 has
a large absorption band at wavelengths around 300 υM, as well as ozone. We can then discriminate the contribution of ozone from that of sulfur dioxide, so as to estimate the amount of the latter emitted in the course of an eruption. The first case of use in the field of volcanology TOMS was carried out during the eruption of El Chichon in Mexico in 1982. The estimated annual emission of sulfur anhydrite from 1978 to 1992 (Bluth et al., 1993) gives a value of 4 million of tonnes per year (Krueger et al., 1993).
2.2.2 LI-COR infrared analyzer: rate measurement of CO2 emissions
The use of a small infrared analyzer of carbon dioxide (LI-COR), has become, recently, a standard method for the measurement of the emission rates of carbon dioxide.
The LI-COR can be mounted on a small plane configured for the sampling of external air. The plume is traversed at different altitudes until the entire section is analyzed. From these data, one can calculate a rate of emission of carbon dioxide. This technique has been used by scientists at the USGS volcano Popocatepetl in Mexico in 1995.
Fig. 11 - LI-COR infrared analyzer
A typical set-up inside of an aircraft comprises the LI-COR analyzer of carbon dioxide and a unit of flow control, a GPS receiver, and laptop computer for performing data acquisition software.
2.2.3 FTIR (Fourier transform infrared spectrometer)
A further technique for the measurement of volcanic gases involves the use of a Fourier transform system with infrared (FTIR) (Fig. 12). The FTIR is able to simultaneously analyze more gases with a path opened or closed. The open method uses an optical path such as to point the telescope toward a FTIR gas source magmatic placed at a certain distance. The source of infrared light is simply the natural sunlight. The method of the closed path implies instead of the emission gas that comes from a plume or fumarolic gas passes through a cell located within the FTIR. Recently, a prototype of a closed path FTIR has been used successfully at Kilauea volcano in Hawaii to measure the concentration of SO2.
Fig 12.. FTIR (Fourier transform infrared spectrometer).
2.2.4 DOAS (Differential Optical Absorption Spectrometry)
The DOAS system works by exploiting the principle that many species pollutants emitted into the atmosphere absorb energy, in a selective manner and characteristic for each of them, only certain wavelengths in the spectrum of
electromagnetic radiation ranging from the ultraviolet and infrared and therefore this absorption can be correlated to the amount of airborne substance.
The DOAS system allows the automatic and continuous monitoring of the average concentrations of greenhouse gases into the atmosphere.
The integrated computer system provides for the management and control of the instrumental parameters, acquisition of the frequency spectrum, the calculation of the concentration values and to data storage. The duration of the acquisition of the spectra is selectable according to the conditions of analytical sensitivity required, by some tens of seconds up to some minutes. The management software processes the measured spectra and comparing them with a library of reference spectra previously stored. Through this procedure, the computer program determines the amount of the test compounds and the margin of error (deviation) for each determination.
The analysis result obtained is represented, for each pollutant, from the average value over the entire optical path, to which is associated a deviation value that will allow the validation of the entire analytical process.
2.3 Geochemical Discontinuous data at the Solfatara and Pisciarelli from 1996 to 2006
The experimental studies performed at Campi Flegrei, especially the volcano Solfatara, are focused on the volatile component, as the study of their distribution in the primary magmas is useful for understanding the nature of volcanic eruptions and the interpretation of monitoring data hydrothermal activity.
Since 1983 began on periodic sampling of the fumaroles at higher temperatures (BG, Large Mouth T = 160 ° C) of the Solfatara of Pozzuoli, and subsequently began systematic sampling of fumaroles BN (Bocca Nuova crater of the Solfatara, data from 1995) and Pisciarelli (data from 1999).
Fig.13 – Solfatara volcano, fumarole BG
The following table shows the number of samples taken at discrete for each year from 1996 to 2006 to the fumaroles of Bocca Grande (BG), Bocca Nuova (BN) and Pisciarelli (PISC).
Anno
BG
BN
PISC
1996
8
0
0
1997
10
1
0
1998
9
8
0
1999
6
8
3
2000
16
38
6
2001
9
9
2
2002
12
12
3
2003
13
12
5
2004
12
12
5
2005
14
11
6
2006
13
13
10
Table 1 - Number of samples taken at discrete from 1996 to 2006 (Unit Functional Fluid Geochemistry - INGV section of Naples, Vesuvius Observatory)
CO2/CH4 0 2000 4000 6000 8000 10000 12000 14000 16000 24/07/98 06/12/99 19/04/01 01/09/02 14/01/04 28/05/05 10/10/06 22/02/08 CO2/CH4
CO2/CH4 ratio from 1999 to 2006 (discontinuous measures from Surveillance Report Osservatorio Vesuviano)
3. A CONTINUOUS GEOCHEMICAL MONITORING AT PISCIARELLI: METHODS OF STUDY
3.1 Field Studies: Pisciarelli geological setting
The Pisciarelli area is located slightly outside the caldera rim of the Solfatara with NO direction. This area is characterized by the presence of fractures and is affected by phenomena of emission of gases and fluids.
The main component of the fumaroles is H2O followed by CO2 and H2S and with
a range of temperature between 100-110 °C (Chiodini, 2009)
During field surveys in the Pisciarelli made during the year 2006 were observed, compared to similar surveys conducted in the past (the year 2005), changes in the most affected by the phenomena of gases and fluids. Particularly in the first characterized by several point sources of emission of fluids. In addition, along the eastern side of the small hill to the east of this place pool have increased the points of greenhouse gas emissions. Fractures are mostly trending N110-120E and the area is dominated by two main features NWSE and NE-SW. Also were not observed accumulations of material from surface gravitational movements of recent formation. 24.10.06 The day the area has been the subject of an initial investigation with camera
Portable thermal, both for carrying out a first thermal relief that identify a favorable area for the installation of a thermal fixing station. On 30 October, the station has been installed TIR Mobile (TITANO: Thermal Infrared Transportable Apparatus for Nearby Observation). the average distance is about 150m field of view which shows an average resolution of pixels of about 15cm. From that date shall be acquired and the control unit of the network TIIMNet 6 images at night.
3.1.1 Gas emissions in the locality Pisciarelli - March 2009
In surveys carried out in the Pisciarelli days 09/03/09 and 10/03/09 were observed important changes in the area most affected by the phenomena of gases and fluids, compared to similar surveys conducted in the past (late 2005 and 23.10. 2006 surveillance Report November 2006).
A first variation had been detected already in October 2006, when in the first characterized by several point sources of emission of fluids has been found the presence of a pool of boiling water (condensed fumaroles) wide and about 3 m. During the inspections carried out on the dates 9 and 10 March 2009 was observed the formation of an additional pool of boiling water that is larger than the first (diameter 6.5 m). The presence of mud in the walls of the escarpment adjacent to the new emission suggests that the emission is formed by a sudden event and rapid, similar to a phreatic explosion of entities very weak. The event took place in the afternoon of Friday, March 6, when the Vesuvius Observatory operators in the area had not detected the presence of the new issue, and on the morning of March 9 when it was first reported. During the inspection it was decided to sampling of fumaroles adjacent (systematically sampled since 1999) and the liquid output from the spring. (Chiodini et al. Since preliminary report, Vesuvius Observatory INGV-Naples, Functional Unit Fluid Geochemistry, 2009).
3.2 Construction of the gas-line monitoring station (May 16-30 2012, June 1-5, 16-23 2012)
The on-line gas monitoring station is localized close the fumaroles field (100mt). The equipment used in the on-line monitoring station consists of a Quadrupole Mass Spectrometer (Pfeiffer Omnistar©) for on-line gas analysis a field computer and a data logger for data storage.
Air condition was used to stabilize the temperature of the station and 1 UPS (Uninterrupted Power Supply) units were used for data retrieval in case of power cut off.
Silicon tubings, a temperature probe, an gas plastic trap and some additional devices (eg. Water trap, connection plastics, metal rings) were also used during the construction of the gas line between the station and the bubbling pool.
3.2.1 Construction of the gas line: different experimental test
Test 1
For the construction of the gas line, a Teflon tube with 6 mm diameter was placed in the ground of the main fumaroles (T=114 °C) where gas was discharged. The gas was pumped by a membrane pump located in the monitoring station. We used one water trap to remove the condensation during the gas line. Nevertheless, in this test the temperature of the fumaroles was too high and the Teflon tube was blocked by steam.
Test 2
In the second test we sampled in a thermal pool close the main fumaroles. In this case we used an inverted gas trap inserted in the pool. Gas was pumped by the membrane pump but the problem we had was that the pressure in the gas trap became too high and in this case the gas line was blocked by the rise of mud along the Teflon tube.
Test 3
In the third and last test we sampled in a fumaroles situated at a height greater than the other sampling points. This is because its lower temperature allows to have a lower condensation inside the Teflon tube. In fact the best results were obtained by considering this point of sampling.
3.3 Installation of the Quadrupole Mass Spectrometer
After setting up all the electrical connections, the QMS and the computer were turned on.
After turning on the QMS and waiting for some time for the Turbo Molecular Pump to reach its maximum speed, we were ready to begin monitoring gases from the pool/fumarole. For the operation of the QMS the Quadstar software were installed on the computer. The Quadstar program generated daily files consisting of gas compositions (vol.% and ppm).
During the routine field visits performed nearly within weekly intervals, the data regarding the gas composition measured by the QMS recorded by the computer were all downloaded and compiled in separate daily EXCEL files. The QMS was arranged to analyze the composition of gases in every one minute.
3.3.1 Calibration of the QMS
For quantitative analysis, the QMS was calibrated with air, pure CO2, and certified gas mixtures, the composition of which are selected according to the expected nature of gas. With calibration, the measured ion currents are put to a solution matrix and the individual concentrations of the components in the gas to be analyzed are determined via calibration factors. For calculating the gas concentrations from ion currents, the mass spectrometer sensitivity for the individual gas components must be known. Those relative mass spectrometer sensitivities are determined by the measurement and stored as calibration factors. Calibration gas files were prepared via the PARSET menu of the Quadstar software. After the preparation of the calibration files, from MEASURE menu, the QMS was calibrated with air and the calibration gas. With these calibrations, a table containing the gases and their respective calibration factors was generated. During air calibration, the capillary of the QMS was disconnected from the gas line and exposed to air. Air was used to calibrate for Oxygen, Nitrogen, and Argon. As internal standard, Ar was used.
During calibration with gas standards, the QMS was disconnected from the gas line and then connected to the calibration gas flask. After establishing the connection, the “dead volume”, i.e. the space between the inlet capillary of the QMS and the calibration flask was evacuated by using the QMS for some time until a pressure inside the chamber of <10-7 mbar was achieved. Then the calibration gas flask was opened to the QMS for measuring. Once calibrated, the QMS was ready to proceed with the quantitative analysis.
3.4 Online Monitoring data evaluation
As a first step before data evaluation, the seismic events data were all compiled. The seismic data were routinely compiled from the website records of the “Osservatorio Vesuviano” (Fig. 15). The raw data (comprising gas compositions (in ASCI format), and pool temperature) from the QMS and the data logger were all gathered in separate monthly files using the EXCEL software. The data files in EXCEL were then transformed into temporal variation diagrams for every single monitored parameter using the GRAPHER (graphical design) software.
Magnitudo eventi sismici Campi Flegrei 2012
0 0,2 0,4 0,6 0,8 1 1,2 1,4 1,6 1,8 2 23/12/2011 11/02/2012 01/04/2012 21/05/2012 10/07/2012 29/08/2012 18/10/2012 07/12/2012 Data Ma gni tudo Magnitudo seismic swarm 19/04/2012 seismic swarm 07/09/2012
4. GEOCHEMICAL EVIDENCE FROM DATA SET MAY-JUNE 2012:
CO2/CH4 RATIO AS POWERFUL TOOL TO DETECT MAGMA
DEGASSING EPISODES AT CAMPI FLEGREI
The best result obtained during the development of the continuous monitoring system has occurred during the months of May-June 2012. In particular from 16th May to 5th June have occurred the best conditions for performing the continuous extraction of gas 24 hours a day. In the following it will be discussed the geochemical composition trends from the Pisciarelli degassing field as well as the main relationships of good tracer of magmatic fluids injection such us CO2/CH4
and H2S/CO2
Methane is a gas species which differentiates in hydrothermal systems, where it is present in relatively high concentrations, from high temperature volcanic magmatic fluids where it is normally absent or present in very low concentrations. Measured CO2/CH4 in fumaroles from 23 hydrothermal systems on the world
range from 10 to 104 roughly in agreement with the theoretical values expected for a gas phase in chemical equilibrium at temperatures from 200°C to 400°C and redox conditions fixed by hydrothermal buffers (Chiodini and Marini, 1998). The CO2/CH4 is a good tracer of magmatic fluids injection because CO2
concentration increased, due to its the higher content of the magmatic component, and CH4, a gas species formed within the hydrothermal system, is lowered both
by dilution and by the more oxidizing, transient conditions caused by the arrival of SO2 into the hydrothermal system (Chiodini, 2009, Chiodini 2012). This
opposite behaviour causes rapid increases of the CO2/CH4 ratio in fumarolic fluids
CO2/CH4 2000 2500 3000 3500 4000 4500 5000 5500 6000 CO2/CH4 16/05 19/05 24/05 27/05 01/06 04/06 08/06
Fig 16. CO2/CH4 ratio from 16/05/2012 to 05/06/20 measured by Quadrupole Mass Spectometer
This trend seems to be confirmed by the data of GPS ground deformation (Fig. 17) that show a general tendency to uplift with an acceleration of the phenomenon in the period spanning from June to August 2012 (25 mm/month in average) and increasing during the last month beginning on December 2012 (10 mm/month).
Fig. 17 ‐ GPS ground deformation (from Osservatorio Vesuviano website)
The total lifting from January 2012 is about 8 cm. The black points represent weekly averages calculated with the GPS final products.
In general systematically every ground inflation corresponds to an increase of CO2/CH4, and systematically a decrease of the ratio accompanies any deflation for
each of the four minor bradyseisms in the last 25 years (Chiodini 2009).As shown by the results of Chiodini et al. (2008) (Fig. 18) the progressive increase of the CO2/CH4 ratio starts from 2000:
Fig. 18 - CO2/CH4 ratio (from Chiodini et al., 2012)
Therefore, the numerous CO2/CH4 peaks observed at Solfatara fumaroles can be
interpreted as the result of the injection of new magmatic fluids into the hydrothermal system, a process that occurs some time before the geochemical signal is observed at the surface.
Another geochemical parameter particularly important as tracer of magmatic fluids injection is the H2S/CO2 (Chiodini et al., 2012) (Fig. 19)
H2S/CO2 0,0000 0,0005 0,0010 0,0015 0,0020 0,0025 0,0030 0,0035 0,0040 H2S/CO2 16/05 19/05 24/05 27/05 01/06 04/06 08/06
Fig 19. H2S/CO2 ratio from 16/05/2012 to 05/06/20 measured by Quadrupole Mass Spectometer
In this case the ratio H2S/CO2 shows a constant trend without showing significant
variations during the measurement period.
4.1 Geochemical evidence from previous data (January – June 2009)
The methodology for continuous sampling of fumarolic gases by mass spectrometry in the Pisciarelli began in January 2009. During this initial phase of sampling data were acquired continuously from 24th January until the beginning of June. Then the measurements were interrupted for re-calibration and maintenance of the instrument. It should also be noted that the hydrothermal system that characterizes the area has undergone several times Pisciarelli changes in the composition of the fumaroles (richer in H2O) which led to the
implementation of changes in the line of gas extraction. During the first measurement period there was an increase in the ratio CO2/CH4 followed by a
progressive decrease from the end of April (Fig.20). This type of behaviour could indicate a lower contribution of magmatic fluids in the shallow hydrothermal system.
CO2/CH4 ppm (24.01.2009 - 05.06.2009) 10000 11000 12000 13000 14000 15000 16000 17000 CO2/CH4 ppm 24/01 15/02 30/03 14/04 29/04 11/05 30/05 10/06 23/06
Fig 20. CO2/CH4 ratio from 24/01/2009 to 05/06/2009 measured by Quadrupole Mass Spectometer
also the H2S/CO2 ratio (Fig. 21) does not seem to show significant variations
during the same period of measurement.
H2S/CO2 0,0024 0,0025 0,0025 0,0026 0,0026 H2S/CO2 24/01 15/02 30/03 14/04 29/04 11/05 30/05 10/06