3
Table of Contents
Table of Contents ... 3 Table of Figures ... 6 Table of Abbreviations ... 8 Introduction ... 9Chapter 1 – BICY Project ... 11
1. Main courses of European Transport Strategies ... 11
2. BICY – Cities and Regions of Bicycles ... 12
3. Structure and Flow of BICY Project ... 15
3.1. WP0 – Project preparation ... 18
3.2. WP1 – Project management and coordination ... 18
3.3. WP2 – Communication, knowledge management and dissemination ... 19
3.4. WP3 – Trans-national harmonization of experiences in cycling ... 20
3.5. WP4 – Implementation actions and mutual learning ... 21
4. Work Package 3 as application field of theses ... 23
4.1 Common relationship between WP3 activities ... 24
4.2 Structure of Common Indicators identification ... 26
4.3 Stage 1 of Common Indicators activity ... 27
4.4 Stage 2 of Common Indicators activity ... 29
4.5 Stage 3 of Common Indicators activity ... 31
5. Main objectives of theses in the perspective of BICY project ... 32
Chapter 2 – Analysis of Good Practices ... 35
1. Historical development ... 35
1.1 The earliest years of cycling development ... 35
1.2 SHT study ... 36
2. Dutch bicycle use in a European perspective ... 39
3. Cycling cities ... 42
4. The requirements for bicycle-friendly infrastructure ... 46
5. The Cycle Balance ... 47
1.1. History and aims... 47
1.2. The four surveys of the Cycle Balance ... 48
4
1.4. Good cycling policy works ... 53
1.5. Publicity and “Cycle City” elections ... 54
6. Conclusion of Chapter 2 ... 55
Chapter 3 – Automated Analysis Method for Bicycle Demand Assessment ... 56
1. Introcution ... 56
2. Survey, its development and types ... 56
2.1. Types of Survey ... 57
2.2. Advantages and Disadvantages of Surveys Using ... 57
3. Mobility Survey of the BICY project ... 58
3.1. Aim of Moility Survey ... 58
3.2. Localization and adaptioan of questionnaires ... 59
3.3. Choice of survey sites and budgeting ... 59
3.4. Preparations and carrying out the survey event ... 60
3.5. Questionnaire design/ Detailed instruction for questionnaire compiling ... 61
4. Surveymaster ... 62
4.1. Scanning of questionnaire ... 62
4.2. Surveymaster interface ... 63
5. Conclusions of Chapter 3 ... 64
Chapter 4 – Automated Analysis Method for Bicycle Infrastructure Assessment ... 66
1. Introduction ... 66
1. OpenStreetMap as data source ... 66
1.1. History and development of OpenStreetMap ... 67
1.2. OSM map production ... 68
1.3. OSM data structure... 71
1.4. Download the OSM data ... 75
1.5. Map rendering ... 79
1.6. Using the OSM data and license ... 81
2. Bicycle infrastructure data and its analysis ... 81
2.1. Required infrastructure data ... 82
2.2. Approaches for the assessment of bicycle infrastructure data ... 85
3. OSM software ... 86
3.1. Development Environment ... 87
3.2. Software structure ... 87
5
3.4. Perspectives for the future development ... 102
4. Conclusions of Chapter 4 ... 103
Discussions and Conclusions ... 104
1. Introduction ... 104
2. Bicycle Policy as implemention field for created methods ... 104
References ... 112
Annexes ... 115
A. Tables of Data for Quantitative Analysis ... 115
6
Table of Figures
Figure 1.1 – BICY logo (source bicy.it) ... 13
Figure 1.2 – Partner cities on the BICY project (Source: bicy.it) ... 13
Figure 1.3 – Short-distance trips by different modes of transport (Source: Trendy Cycling) ... 14
Figure 1.4 – Progress of the BICY project in the perspective of documents output ... 16
Figure 1.5 – Progress of the BICY project in the perspective of the course of events taken place ... 17
Figure 1.6 – Influences of the planned activities on the transnational strategy development ... 24
Figure 1.7 – Direct interactions between WP3 activities ... 26
Figure 1.8 – The basic flow-chart relationship of Common Indicators... 27
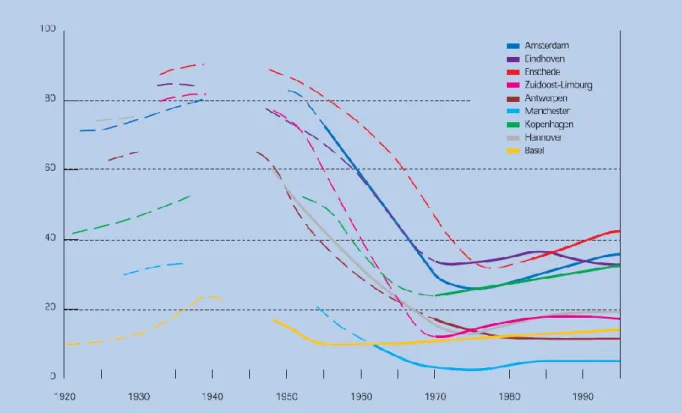
Figure 2.1 – Reconstructed trend lines of bicycle shares in the total number of car, bicycle, moped and public transport journeys, in %, 1920-1995 (source: Fietsberaad Publication № 7) .. 37
Figure 2.2 – Bicycle share in all journeys in some other European countries (source: Cycling in the Netherlands 2009) ... 39
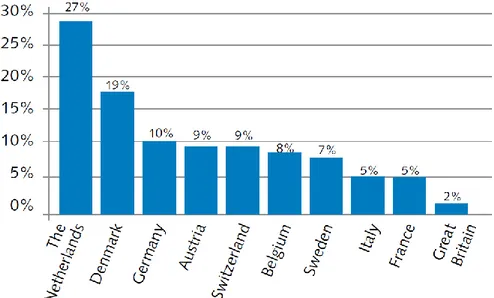
Figure 2.3 – Bicycle ownership in a number of European countries in 2004 (source: Cycling in the Netherlands 2009) ... 40
Figure 2.4 – Kilometers cycled per inhabitant per day in Europe and the USA (source: Pucher, John and Buehler, Ralph (2008)) ... 40
Figure 2.5 – Trend in kilometers cycled per inhabitant per day in the Netherlands, Denmark, Germany and the UK, 1978–2005 (Source: Pucher, John and Buehler, Ralph (2008)) ... 41
Figure 2.7 – Dutch bicycle infrastructure measurement bike [21] ... 50
Figure 2.8 – The Cycle Balance score of Veenendaal ... 53
Figure 2.9 – Correlation between bicycle-use and score on the Cycle Balance ... 54
Figure 3.1 – Carrying out an interview... 60
Figure 3.2 – The one page mobility survey ... 61
Figure 3.3 – Sample of questionnaire ... 63
Figure 3.4 – Surveymaster interface ... 64
Figure 4.1 – The statistics of OpenStreetMap usage by the end of February 2011... 68
Figure 4.2 – Example of XML-file of OpenStreetMap data (user identification number is highlighted with bold type) ... 69
7
Figure 4.4 – OSM primary element NODE ... 72
Figure 4.5 – Open polyline as type of OSM primary element WAY ... 72
Figure 4.6 – Closed polyline as type of OSM primary element WAY ... 72
Figure 4.7 – Area as type of OSM primary element WAY ... 73
Figure 4.8 – OSM primary element RELATION ... 73
Figure 4.9 – A common structure of tag idea ... 74
Figure 4.10 – Elements of each data primitives in the XML-files example ... 75
Figure 4.11 – Randomly chosen part of a city ... 76
Figure 4.12 – Code of OSM XM- file related to randomly chosen part of a city ... 77
Figure 4.13 – Choice of a reference area to download it as bounding box ... 78
Figure 4.14 – XML-file of API restrictions ... 79
Figure 4.15 – An example of Standard OpenStreetMap ... 80
Figure 4.16 – Bicycle infrastructure classification accordning to OSM data ... 83
Figure 4.17 – Classification of surface types according of OSM data ... 85
Figure 4.18 – Correlation between cycling index and bicycle mode share ... 86
Figure 4.21 – Example of a XML-file ... 91
Figure 4.22 – Example of coordinates conversion ... 94
Figure 4.23 – Example of graph processing for city Budaors: from initial one (on the left) to graphs of roads (green on the right) and administrative boundaries (red on the right) ... 96
Figure 4.24 – Example of getting a road graph in which is covered only administrative territory (colors: red – administrative boundary graph, blue – auxiliary graph, green – road graph) ... 97
Figure 4.25 – Example of graph with weighted nodes (yellow nodes – weight equals 3, green node – weight equals 4) ... 99
Figure 4.26 – An image example of an intial graph ... 100
Figure 4.27 – An example of color image of graph layers: red color – administrative boundary graph, blue color – auxiliary graph, green color – “RoadsGraf” ... 101
8
Table of Abbreviations
OSM – OpenStreetMap
WP – work package (consequently, WP3 – work package 3 and so on) PP – Project Partner
CE – CENTRAL EUROPE LP – Lead Partner
SC – Steering Committee UniBO – University of Bologna DICAM
EU – European Union MA - Managing Authority JTS – Joint Technical Secretariat
CROW – The National Information and Technology Centre for Transport and Infrastructure in the Netherlands
9
Introduction
Transport sector was and is one of the fundamental parts of peoples’ everyday life for a long time. But only during the last decades it brought a great number of problems including increase of demand for movement, growth of motorization level, increase of private car usage, efficiency impairing of public transport, congestions and air pollution. Many of the named problems are closely connected to each other and require weighed common solutions. That is why countries and the whole regions start to pay great attention to the development of a sustainable mobility and as a result to the policy of the transport sphere.
One of the possible decisions for the above-listed negative aspects is promotion and support of bicycle usage as an alternative for individual transport. Some steps and actions have already been done and are being done today not only by the governments of different countries, but also by local cities and municipalities in different regions. In the EU, especially, were done a lot in the direction of cycling development at all levels:
A number of appropriate principles was decelerated as part of the goals or as part of the approaches for achievement of these goals in the European Union policies and White Paper of European transport strategy.
There is an amount of EU foundations which supports different projects on the regional and country levels.
Also local programs are carried out to promote and to increase a bicycle usage in a concert place.
These theses are closely connected with one of the European regional project named the BICY project. That is why in the first chapter this project will be considered in details: its main goals, role, connections with the common European Strategy will be described; also the project structure and all processes flow will be explained. In the end one of the BICY project part – Work Package 3 (WP3) – and its component will be considered and discussed in details as the main focus of these doctoral work. Here not only connections between WP3 activities and theses will be considered, but also the sense of theses topic and its development directions will be cleared. An explanation will be given how named action of the BICY project helped to realize
10 and to develop the main ideas of this doctoral research. Finally, also a role of activity “Analysis of Good Practices” for theses will be presented.
Chapter 2 will be devoted to one element of the BICY project which was mentioned in the end of the previous chapter – Analysis of Good Practices. Here the following subjects will be studied: history of cycling in Europe, cycling mobility in the Netherland and its cities compared with other countries, Dutch experience in case of bicycle-friendly infrastructure planning. In the end of chapter 2 the project Cycle Balance will be described in details. It is every good example which presents a complex study of cycling mobility and cycling conditions in different places in the Netherlands. It can be considered as preparation phase for research done within the scope of theses. Also it returned a number of orientating points which helped to cover the main topic of doctoral dissertation and to reach its main goals.
Automated analysis methods for the assessment of bicycle infrastructure and demand, their creation and development are the main aims of this doctoral dissertation. These two methods will be considered in details in chapters 3 and 4.
The first of two automated analysis methods will be considered in chapter 3. Chapter 4 will describe the second method in details.
11
Chapter 1 – BICY Project
1.
Main courses of European Transport Strategies
As was written above, the EU has its main transport strategy documents where development of cycling mobility was marked directly and indirectly as one of the priorities for the future. But the real growth of interest to this issue can be seen only by comparing two latest White Papers (of the year 2001 and of the 2011). Table 1.1 presents the main goals of these two fundamental European transport strategy documents.
Table 1.1 – The main goals of White Papers Main goals of White Paper
2001
Main goals of White Paper 2011 Introducing new regulations Revitalising railways Optimal usage of infrastructure
Linking up the modes of transport
Reducing emission Multimodal urban
transport
Efficient usage of exicting infrastructure
According to this table, the most named topics of both Papers are very similar or very close to each other. For example, The White Paper 2001 was promoted to make railway usage possible for urban and suburban areas which can be defined as the first step for creation of multimodal urban transport system – one of the White Paper 2011’s aims. Another example is connected with organization of cost-effective transport network by establishing better connection between inland waterways, sea and rail transport which was described in the earlier document. Realization of this aim helped to reach an optimality in the infrastructure usage which was a precondition for usage of improved traffic management and information systems. Utilization of these systems is provided by the White Paper 2011.
The total new aspect of White Paper 2011 in comparison with White Paper 2001 is a reducing CO2 emission. To be exact, EC wants to reduce emission by 60%. Of course, other goals of strategy have direct and indirect positive influences on this point (especially, development of
12 traffic management systems can be mentioned). But to reach this concrete aim some special priorities were defined:
new transport patterns must emerge according to which large volumes of freight and great numbers of passengers are carried to their destination by the most efficient modes; individual transport must be preferably used only for the final kilometers of the journey; clean vehicles must be developed and utilized;
bicycle must become more popular as a separate mode of transport
The last priority connected with growth of the bicycle usage has not only one outcome as decrease of CO2 emission, because bicycle as a mode of transport does not generate any exhaust gases. It also keeps the people healthy and gives a possibility for urban mobility not to depend on other transport means which has a positive effect on an urban transport sector.
For increasing a cycling rate, a number of actions must be provided according to the White Paper 2011. For example, one of them is to support bicycle by other modes of transport: creation of possibilities and backgrounds for taking bike on the bus, train, tram or whatever public transport. It will extend the opportunities to use bicycle on the connections with short distances which are normally done on foot or with other modes of transport (between bus stops and travel destinations, etc.). Other example is a development of a cycle infrastructure or modernization of existing transport network to make it more bicycle-friendly: building of cycle ways, adaptation of some roads for bicycle usage with help of special traffic signs, etc.
2.
BICY – Cities and Regions of Bicycles
There is a number of approaches used by EU government to support and to realize the ideas and priorities established in the strategy and policy transport documents. One of these approaches is to organize and to finance an amount of different programs and projects in Europe which activities will be aimed at declared goals.
A sample of such programs is the European Territorial Co-operation which is financed by the European Regional Development Fund and includes cross-border, transnational and interregional co-operation programmes. On the transnational level it divides into 13 different parts. Each part corresponds to one of the transnational cooperation areas. The largest one between these areas is Central Europe which is directly connected with the CENTRAL EUROPE Programme.
CENTRAL EUROPE is an EU programme which supports the cooperation between the countries of Central Europe. During the Structural Funds Period from 2007 until 2013 it encouraged projects which goals met one of the following priorities:
13 2. Improving Accessibility of and within Central Europe
3. Using our Environment Responsibly
4. Enhancing Competitiveness and Attractiveness of Cities and Regions
“BICY – Cities and Regions of Bicycles” was one of the projects approved by CENTRAL EUROPE. The short name of this project is BICY which was reflected in the logo (Figure 1.1).
Figure 1.1 – BICY logo (source bicy.it)
The official duration time was from February 2010 until January 2013. During this time 11 partners from 10 regions of 7 different Central Europe countries participated in collaboration activities (Figure 1.2).
14 The common goals of the BICY corresponded to the second priority declared by CENTRAL EUROPE and, specifically, to its part connecting with promoting a sustainable and safe mobility. By looking more in details, the project wanted to make more people use bikes or walking as a mode of transport trying in such way to change the trend of private motorization increasing in Central Europe and, as a result, to reduce all its negative effects inclusive of traffic congestion and air pollution.
Considering that 80% of all trips in urban areas are less than 5 km, it is natural that walking and cycling would be the best modes of transport: they do not generate any CO2, improves people’s mobility without depending on any other modes of transport and promotes a healthy life-style. Figure 1.3 shows the advantage of bicycle for the short-distance trips versus other modes of transport. But this still does not mean that public transport should become extinct, instead of that, walking and cycling should be integrated into it.
Figure 1.3 – Short-distance trips by different modes of transport (Source: Trendy Cycling) So in particular, the BICY project:
developed integrated urban-regional bike planning as strategic part of urban-territorial planning;
promoted cycling as a key component of public transport;
rose awareness of local authorities and citizens about bicycle as a good replacement for a car for shorter trips;
promoted bicycle as a safe and ecological means of transport;
strengthened the frontrunners experience and develop new and innovative technologies; provided quantitative evidence that shift towards cycling improves quality of life;
15 promoted a trans-national cross-fertilization between similar projects and partnerships
working in the same field
3.
Structure and Flow of BICY Project
Here the whole structure of BICY will be described paying attention on the main events and outputs concerning the organization and results of the project. All kinds of documents and reports done during the project will be understood as outputs. All meetings, workshops, conferences, trainings, campaigns, etc. provided during the flow of the BICY will be understood as events.
According to work plan of the project, there are 5 main work packages including all activities starting from preparation of the future project and finishing with realization of actions concept:
Work package 0: Project preparation
Work package 1: Project management and coordination
Work package 2: Communication, knowledge management and dissemination Work package 3: Trans-national harmonization of experiences in cycling Work package 4: Implementation actions & mutual learning
Each of these parts will be shortly described further.
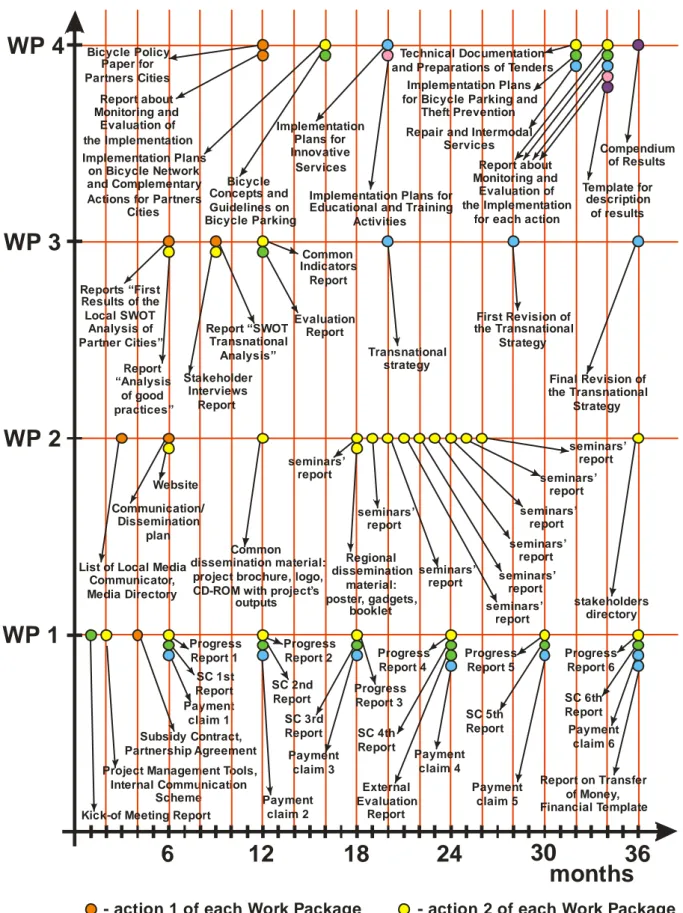
Two figures – Figures 1.4 and 1.5 – will help to look through the whole BICY project in common. They present graphs which show the progress of BICY in time. The first image is the progress of the project in the perspective of documents’ output. The second scheme is the project progress in the perspective of the course of events which were taken place.
X-axis is the flow of time: the duration of the project is 36 months. Y-axis is work packages starting from first of them. Each point on the graphs corresponds to one event or to one output document for concrete action of one work package. The time axis shows, normally, the month when the event took place or the deadline until which document must be ready or activity must be finished.
Special mention must be made that work packages have different numbers of actions (minimum is 2 and maximum is 6). That is why both graphs have the common legend which is relevant for every work package separately. For instance, action 2 according the legend is yellow circle. It means that such kind of circle for each WP is action 2.
The both graphs do not take into account project preparation phase, because this time isn’t counted as a part of the whole BICY project duration.
16
WP 1
WP 2
WP 3
WP 4
6
12
18
24
30
36
months
Payment claim 1 Project Management Tools,Internal Communication Scheme Subsidy Contract, Partnership Agreement
- action 1 of each Work Package - action 2 of each Work Package - action 3 of each Work Package - action 4 of each Work Package - action 5 of each Work Package - action 6 of each Work Package
Progress Report 6 Report on Transfer of Money, Financial Template Progress Report 1 Progress Report 2 Payment claim 2 Progress Report 4 Payment claim 4 Progress Report 3 Payment claim 3 Payment claim 5 Progress Report 5 SC 4th Report
* not every Work Package has 6 actions
SC 1st Report
Kick-of Meeting Report
SC 2nd Report SC 3rd Report SC 5th Report SC 6th Report List of Local Media
Communicator, Media Directory Communication/ Dissemination plan Website Common dissemination material:
project brochure, logo, CD-ROM with project’s
outputs Regional dissemination material: poster, gadgets, booklet seminars’ report seminars’ report seminars’ report seminars’ report seminars’ report stakeholders directory seminars’ report seminars’ report seminars’ report seminars’ report Reports “First Results of the Local SWOT Analysis of Partner Cities” Report “SWOT Transnational Analysis” Report “Analysis of good practices” Stakeholder Interviews Report Common Indicators Report Evaluation Report Transnational strategy First Revision of the Transnational Strategy Final Revision of the Transnational Strategy External Evaluation Report Payment claim 6 Bicycle Policy Paper for Partners Cities Report about Monitoring and Evaluation of the Implementation Implementation Plans on Bicycle Network and Complementary Actions for Partners
Cities
Technical Documentation and Preparations of Tenders
Report about Monitoring and
Evaluation of the Implementation
for each action Bicycle
Concepts and Guidelines on Bicycle Parking
Implementation Plans for Bicycle Parking and
Theft Prevention Implementation
Plans for Innovative
Services
Repair and Intermodal Services
Implementation Plans for Educational and Training
Activities Template for description of results Compendium of Results
17
WP 1
WP 2
WP 3
WP 4
6
12
18
24
30
36
months
Kick-off Meeting 1st Steering Committee (SC) Meeting- action 1 of each Work Package - action 2 of each Work Package - action 3 of each Work Package - action 4 of each Work Package - action 5 of each Work Package - action 6 of each Work Package * not every Work Package has 6 actions
2nd Steering Committee (SC) Meeting 3rd Steering Committee (SC) Meeting 4th Steering Committee (SC) Meeting 5th Steering Committee (SC) Meeting 6th Steering Committee (SC) Meeting Regional Seminar in Ferrara Regional Seminar in Ravenna Regional Seminar in Kosice Regional Seminar in Budaörs Regional Seminar in Koper Regional Seminar in Graz Regional Seminar in Velenje Regional Seminar in Prague Regional Seminar in Erfurt Transnational Workshop in Slovakia Transnational Workshop in Slovenia Transnational Workshop in Czech Republic Transnational Workshop in Hungary Transnational Workshop in Austria Transnational Workshop in Italy European Conference Study visits and
training activities in Ferrara
Study visits and training activities
in Graz Campaigns, Educational and Training Activities in different Partner Cities and
Municipalities
Stakeholders interviewing
18
3.1. WP0 – Project preparation
As it was mentioned above, the first stage was the project preparation phase. It started at the beginning of the year 2009 (around one year before official BICY project start). 11 partners from 10 regions of 7 different Central Europe countries were involved in the cooperative work. The main aims were:
to spread the first draft of project proposal and a questionnaire among potential partners; to collect all possible feedbacks about this drafts from the future project members; to create an interactive environment for potential partners;
to develop the final version of the project construction; to prepare the financial tables.
Also trans-national preparatory seminar took place on the 20th of February of the same year in Ferrara.
3.2. WP1 – Project management and coordination
As the work package name can indicate, the main goal of this phase was to make management and coordination of BICY project more efficient and clear for every partner. According to conditions of CE programme, this stage must be divided into 4 actions which are the following:
1. Fulfillment of start-up requirements:
During the first 4 months from the project beginning two main documents must be signed: Subsidy Contract (between the LP and the Managing Authority of CE programme) and Partnership Agreement (prepared and signed by all partners for establishment of management and coordination rules).
2. Day-to-day project management, coordination and internal communication:
a. The LP selected the Project Manager and the Financial Manager. Each partner in its side designated a Local Project Manager and a Local Financial Manager.
b. During the first 2 months the LP prepared Project Management Tools package which must ensure the effective project management and the day-to-day coordination. c. Also during the first 2 months a special scheme for internal communication was set
up. It included new and traditional communication tools. The project website was created with the option to be used by every partner, as well as, to share different kinds of documentation.
d. Every partner made a number of Progress Reports which were delivered in the end of every 6 months.
19 3. Steering and monitoring of the project implementation:
The Steering Committee was established by the start of the BICY project. This authority consisted of all project top-management and also of two local managers. Its aims, besides the management work, were also control and monitoring how project activities and financial flows were going on during the whole period of work. To make the work of Committee more efficient, a number of meetings was organized including 1 kick off-meeting in the first project month and also 5 trans-national SC off-meetings in the end of every half-year during the whole project period. External evaluations of the project implementation were also foreseen.
4. Financial management, certification of expenditure:
As it was mentioned above, the main Financial Manager and a number of Local Financial Managers were selected in the beginning. This group worked together keeping track of all financial questions of project: they prepared certifications of expenditures, controlled that this documents were conformed to the reporting obligations and that PPs received the reimbursements in time, made the financial flow monitoring.
3.3. WP2 – Communication, knowledge management and
dissemination
The main goal of this work package was to promote the project output and results. Based on this idea, a detailed communication/dissemination plan was designed at the kick-off meeting and was divided into 2 main actions:
1. Media communication/ dissemination:
Every partner created a list of local media communicators, established relations with them, set up a media directory. The objective was to involve as much as possible national and regional mass media vehicles to cover the activities of BICY project.
2. Non-media communication/ dissemination and website:
a. A stake-holders directory was being created during the whole 3 year of BICY project and included all parties concerned.
b. Non-media dissemination plan was designed.
c. A number of public trans-national workshops and also regional seminars were held during the second half of the project period.
d. European Conference on cycling mobility in Prague was organized in January 2013. This event gathered all the potential stake-holders and other people and organizations working on similar problems.
20 e. Common dissemination material were produced (number of brochures, CD-ROMs,
etc.)
f. Already existing networks as BYPAD and others and also different conferences were used to disseminate information about BICY project and its outputs.
g. The BICY project webpage played an important role. It was not only a place of partners internal communication concerning documentation up- and downloading (as it was mentioned above), but also an open source for public visitors and a platform where actual information and all kinds of materials can be exchanged.
h. A large amount of associated partners (cities, clubs, federations of bikes, etc.) helped to spread information about BICY activities in different ways.
3.4. WP3 – Trans-national harmonization of experiences in cycling
The cycling mobility rate of the total urban trips is one of the important characteristics which helps to estimate a level of bike-usage for a certain place. It fluctuates strongly depending on city or region, and sometimes difference between parameter values for two neighbor regions or countries can be very large. That is why the work package 3 of the BICY had an aim:
to contribute to harmonization of the cycling mobility rate for the cities and regions which were involved in the project and
to achievement of the best parameter standards.
To reach the above-mentioned goal, the working groups were created which included representatives of PPs and external experts. These groups worked together to perform 4 actions:
1. SWOT analysis:
Every partner did a SWOT analysis on cycling for its home location. This work was finished until the end of the first half-year from BICY project start. This analysis helped to understand existing situations in the different cities and regions and their advantages and disadvantages, to find the main possibilities for cycling development and also problems which can appear by this development. As a result, the transnational SWOT analysis was done by the DICAM team in the end of the first 9 months.
2. Common Indicators:
The main objective of this action was to determine common performance indicators, including costs-benefits analysis. These parameters helped to find the keys how the cycling mobility and the bicycle traffic can be improved on the different levels: from small cities till the whole CENTRAL EUROPE area. As a consequence, common
21 indicators development was a very important part of the BICY which had influence on the all project realization and, especially, on trans-national strategy.
To establish the common indicators (and also to make costs-benefits analysis included in the final report), a number of activities were done and carried out: analysis of good practices, data collection including mobility survey, OSM data analysis. The first results were available after 12 months from project start, but this work did not stop during the whole project life. Also these results were used during the all events held during the BICY: workshops, seminars, conferences, etc.
3. Study visits & training seminars:
Two trans-national study visits & training seminars were organized in Ferrara and Graz (on the 7th and 18th months of the project) which were visited by representatives of all partners involving in the last stage of the BICY – Work package 4. The aim was to give necessary information about bicycle as a mode of transport and everything connected with it: from basics of policy formulation till monitoring and control of influences after realization of actions concept. All this knowledge was used by PPs during the WP4. Also the trans-national dimension of customer satisfactions was evaluated during the seminars and, according to this evaluation, the common report was elaborated.
4. Trans-national strategy:
All above-mentioned activities were the basis for formulation and construction of a trans-national strategy. This strategy was described in the final paper and explained how to achieve the main aim of WP3 declared above using suitable benchmarking activities and designing required solutions in realistic perspective.
The process of trans-national strategy development was in progress during the whole project life. The first complete version was prepared until the end of 20th month of the project duration. Then there were also two revisions: according the first feedbacks coming during project implementation described in the WP4 (on the 28th month of project duration) and according the final results in the end of the project.
3.5. WP4 – Implementation actions and mutual learning
In concordance with trans-national strategy getting from WP3, a number of activities and actions were developed as parts of a multilevel implementation approach. Every certain action was conducted in different places in close collaboration with partners. The main goal was to achieve mutually concrete results regardless of special conditions and specifics of a city or region. The actions were the following:
22 1. Policy formulation and strategy building:
The first step for all partners was to prepare a cycling policy papers which established the main goals and approaches to achieve them. Some cities and municipalities had already had their policies: they needed only to be revised and adapted. Other ones did this work from the beginning on the basis of existing policies of other partners and of output coming from WP3 (SWOT analysis, common indicators, etc.). This action was finished until the end of the first project year.
2. Bicycle network and complementary actions:
Bicycle networks and their development were one of the important aspects by the cycling policy formulation. Until the end of 16th month from the project beginning, a number of partner cities developed to each its own implementation plan on bicycle network and complementary actions. Near to the BICY project end (32th month), some partner towns had already prepared planning and technical documentations for building new cycle ways and for new signposting about bicycle routes. Also they were ready to implement these construction activities.
3. Bicycle parking and theft prevention:
Equipments of bicycle parking are playing an important role for increasing of bike share in the modal spilt. Theft prevention must be also taken into account: person will never use bicycle as a mode of transport if its two-wheeled vehicle is stolen more than 3 times. One of the action ideas was to create a concept (until the end of 16th month) and implementation plan (until the end of 32th month) for bicycle parking and theft prevention for some partner cities.
4. Innovative services (intermodal and rental; new technologies):
Today an amount of different innovative and technological services for bicycle and cyclists exists which can make a bike usage more attractive. The following examples can be attributed to these services: rental and repair stations, intermodal services (to mix cycling with different means of public transport), exchange parking, bicycles equipped with GPS navigators, etc.
Until the 20th month of the BICY project, some partner cities and municipalities prepared their own concepts of different innovative bike services which can be installed there. Then (until the 32th month), on basis of these concepts, a number of implementation plans for proposed services was appeared.
23 The main goal of this action was to raise the image of cyclists and cycling. To reach this aim a number of events was held by PPs.
By analogy with the previous point, concepts of activities were created by partners until the 20th month of the project. And until the 32th month, all scheduled activities took place in the partner cities and municipalities. There were, for example, educational meeting in Graz and Budaörs, promotional campaigns in Prague, Kosice and Erfurt, etc. 6. Compendium of implementation action results:
In common, the compendium is an amount of materials concerning activities and their results according to implementation actions of the WP4. It includes articles, CD-ROMs, files which can be downloaded from BICY website, etc. They were prepared, published and collected during the whole project duration. A structure of the compendium was made according the above-described actions of WP4: each action corresponds to each chapter. To make a system and to get an in the right way described information about undertaken activities, a common template for results description was developed and given to each partner.
The compendium had both local and trans-national importance. On the one hand, for example, with help of information uploaded on the website, people were informed about activities and events which were planed and accomplished by PPs, also could find results reports. On the other hand, the trans-national compendium was presented on the Final European Conference in the end of the BICY project. This amount of examples how to promote cycling mobility and to improve bicycle culture in different regions of CE can be a good handbook for stakeholders and decision-makers in the whole European Union by making cities and regions more liveable and accessible.
Regular monitoring and evaluation of the implementation were carried out for each WP4 action and, consequently, appropriate reports were written until the end of each action. It means that the results reached by certain city or region were analyzed according to a common trans-national indicators grid.
4.
Work Package 3 as application field of theses
The common description of work package 3 was given above. But as the main focus of these doctoral theses is directly connected with WP3 and, especially, with some of its activities (Analysis of good practices and Common Indicators), this part of BICY project will be considered more detailed in this subchapter.
24
4.1 Common relationship between WP3 activities
As it was mentioned above, the transnational strategy is the core output of the whole work package. This paper is a basis to plan and realize an amount of implementation actions which must ensure harmonization of cycling level of the partner cities and regions and at the same time achievement of necessary standards.
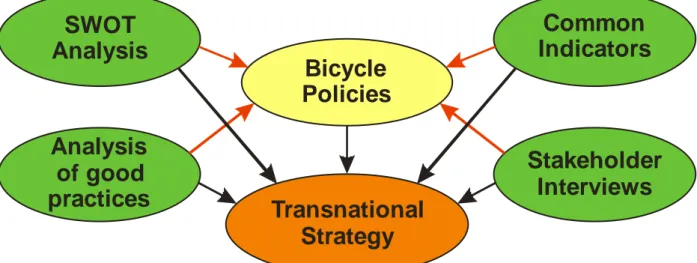
A number of activities according to the project work plan was done to develop this strategy. They included a compared analysis of existing and new bicycle policy papers, SWOT analysis, analysis of good practices, interviews with stakeholders and common performance indicators (or also called Common Indicators). The influence of all these components on the transnational strategy development is shown in the Figure 1.6 with black arrows. The tasks of the work package 3 have green background on the picture, of work package 4 – yellow (transnational strategy is also a part of WP3, but it is marked with orange color as a main aim gathering all influences).
SWOT
Analysis
Transnational
Strategy
Common
Indicators
Stakeholder
Interviews
Analysis
of good
practices
Bicycle
Policies
Figure 1.6 – Influences of the planned activities on the transnational strategy development All above-mentioned activities have not only impacts on the strategy, but also relations between each other and impact on each other. For example, in the Figure 1.6 it is possible to see red arrows which show what kind of direct connections bicycle policies of partners have with others: they were based largely on the tasks of WP3. The relationships of the WP3 activities will be described further.
The aim of the SWOT analysis is to assess the situation with cycling mobility in each partner region, to find out its advantages and disadvantages, also potential problems the future development of cycling could face. The SWOT transnational analysis is a final result of a common cycling state in the perspective of all partners. Between all WP3 activities it had a direct linkage with good practices analysis: on the one hand, it was carried out looking through the
25 prism of SWOT analysis results, on the other hand, it helped partners to do SWOT analysis by giving a number of main directions and focuses. SWOT analysis had also a direct influence on Common Indicators: its information about existing situation was an orienting point for organization and carrying out data collection activities which were one of the necessary conditions for indicators assessment.
The analysis of good practices (also called State of the Art) was made with the following goals: to search and analyze of the results from different similar projects which are in progress
or were realized within the European Union;
to look through research methodologies of cycling mobility and its indicators for finding possibilities to use or to adapt them for BICY project needs;
to find leader cycling countries and cities (with the high bicycle usage), to analyze their network systems and mobility situations comparing each other and with partner cities, to establish their main tendencies in the cycling development
As it was written above, analysis of good practices is connected with the SWOT analysis. It also has a direct linkage with Common Indicators: realization of all its goals has influenced the development and calculation of cycling indicators.
The interviews with stakeholders were carried out to get a feedback and different new ideas and opinions related to the BICY project from the experts and cycling stakeholders. This activity had a direct influence on common performance indicators: it helped to correct the approaches used for measurements, calculations and analysis.
The main objectives of the common performance indicators (or Common Indicators) were to collect data about cycling mobility and its potential, to make analysis and assessment of this data, to search patterns and to develop models based on obtained information, and, finally, to make prediction for the future of bicycle usage and other relevant parameters. Its relationships with other relevant WP3 tasks have already been described above. Special mention must be made that Common Indicators had the strongest linkage with analysis of good practices.
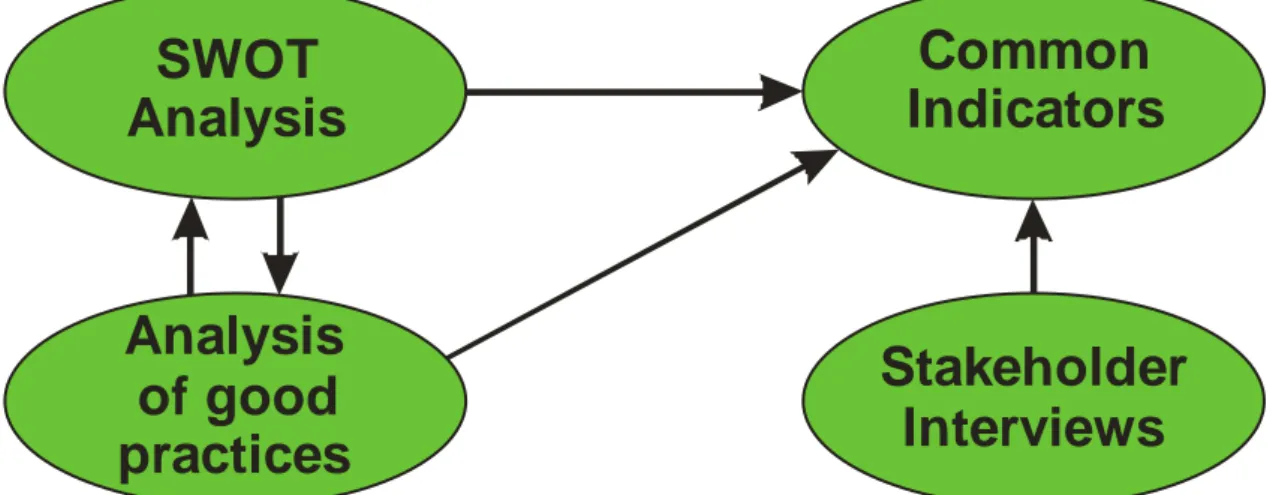
Of course, there is a number of indirect relations between all above-mentioned WP3 activities. Figure 1.7 presents only direct interactions between them.
Common Indicators have a more complex structure as compared with SWOT analysis, analysis of good practices and interviews with stakeholder. That’s why it will be described separately in details further.
26
SWOT
Analysis
Common
Indicators
Stakeholder
Interviews
Analysis
of good
practices
Figure 1.7 – Direct interactions between WP3 activities
4.2 Structure of Common Indicators identification
The main aim of Common Indicators and its relations with other WP3 activities were described above under the point 4.1 of this sub-chapter. The issue here is its structure.
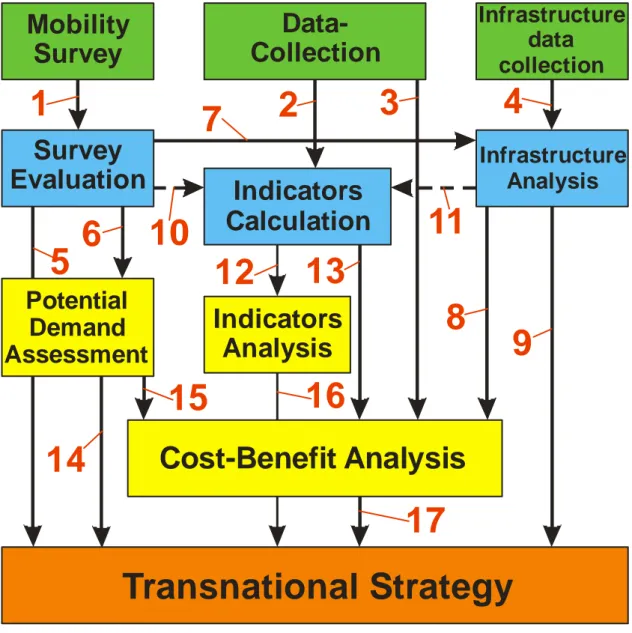
A flow-chart of current WP3 task is presented in the Figure 1.8. Different colors of boxes in the block scheme mark different stages of Common Indicators. In total, there are three steps of indicators activity. Block transnational strategy in the Figure 1.8 presents a separate activity and the main result of the whole WP3 action which is based to a great extent on the Common Indicators and its results.
Green boxes are the first stage of the considered WP3 activity. It includes three primary components: data-collection, mobility survey and infrastructure data collection. All these elements had the common goal to collect necessary information for further steps of Common Indicators.
Blue Boxes in the Figure 1.8 represent the second stage of Common Indicators – the first level of data analyses and calculations of the results. The common objective of this phase was to get a number of outputs which will be relevant not only for the next step of current WP3 activity, but also for definition of transnational strategy. Elements of this stage are survey evaluation, infrastructure analysis and indicators calculation.
Yellow squares of the flow-chart identify the third and final stage of Common Indicators activity – the second level of analyses and evaluations. The basis for this phase was data and results got on the previous stages. The main components are potential demand assessment, indicators analysis and cost-benefit analysis. The aim of this step was to prepare a number of outcomes which would have a great importance for the trans-national strategy formulation.
27
Data-
Collection
Mobility
Survey
Transnational Strategy
Indicators
Analysis
Survey
Evaluation
Infrastructure
Analysis
Cost-Benefit Analysis
Potential
Demand
Assessment
Indicators
Calculation
10
1
2
3
4
5
6
7
8
9
11
12
13
14
15
16
17
Infrastructure
data
collection
Figure 1.8 – The basic flow-chart relationship of Common Indicators
4.3 Stage 1 of Common Indicators activity
As it was mentioned above, the first stage has 3 main elements which contributed to the collection of different data. They are data-collection, mobility survey and infrastructure data collection.
Data-collection
The data-collection is an amount of common quantitative data about infrastructure, population and external costs made by each of the partners. The special data collection form was created and sent to every PP. It countained a list of the following data:
reference area (km2
);
28 population density (1/km2
); road length (km);
exclusive bicycle path length (km); length of road with traffic calming (km);
length of pedestrian areas where bikes are allowed (km); number of bike parking or racks;
total number of light-rail/ local-rail/ metro stations with and without bicycle parking; total number of severe road injurious and road fatalities caused by cars per year;
“construction” costs of segregated bike path by markings (€/km per lane per direction); construction costs of new segregated bike path which are physically separated (€/km per
lane per direction);
costs for installing 10 bicycle racks (€); various data of local public transport operator; modal split;
modal split by km (km driven by each mode per day per person);
transport-related energy consumption or CO2 emissions per person per day or per year.
Also some additional useful data concerning partner cities and regions was gathered by PPs themselves and UNIBO-DICAM team. For example, there was an information about topography, weather conditions, etc.
As it could be seen, the information gathered was various enough, and it required a lot of efforts from the partners to search it using different sources. Unfortunately, this step of data collection didn’t go very smoothly. There were several problems for a number of reasons. They were described in details in the annex A of Common Indicators Report [13]. In general, the common issues were the following:
a number of data is unavailable or incomplete by different reasons;
some types of data obtained from one partners are incompatible with the same types from another partners which could not provide possibility to compare them;
some data from BICY project partners were collected using non-representative methods and, as a result, could not be used.
Mobility survey
The mobility survey was carried out by every partner. This instrument provided data about the travel behavior of the inhabitants. Data also included opinions about the present transport supply and readiness of citizens to change their usual mode of transport to another more sustainable one. A detailed description of the survey preparation and carrying out will be done in the chapter 3.
29
Infrastructure data collection
The infrastructure data collection was a gathering of GIS data based on OpenStreetMap (OSM). Thus, comparable information about transport network of all partners’ cities and regions including bicycle equipment and facilities was obtained. The download process of GIS data from its source will be described in the chapter 4.
4.4 Stage 2 of Common Indicators activity
The components of the second stage are survey evaluation, infrastructure analysis and indicators calculation. They returned the first results of data processing.
Survey evaluation
As it is shown on the flow-chat in the Figure 1.8 with an arrow 1, survey evaluation is based on the mobility survey which provided a huge amount of data. Processing of this data allowed to assess a number of parameters including modal split and also to calculate effects of the possible implementation of various cycling improvement scenarios. The major part of survey evaluation results had a direct influence on transnational strategy (arrow 5, Figure 1.8). But also there were some outputs (for example, scenario demand) which connected with one component of the third stage called potential demand assessment (arrow 6, Figure 1.8). More deep survey evaluation will be explained in the chapter 3.
Infrastructure analysis
Infrastructure analysis was carried out directly after GIS data collection (arrow 4, Figure 1.8). This analysis included building of classification for the necessary elements of transport network, creation of different filters for data assessment, construction of output data and plots, etc. Other component of the second stage (survey evaluation) had an influence on the process of infrastructure analysis (arrow 7, Figure 1.8): gathering of information about scenario requirements is important to find out all possible solutions for infrastructure improvement. Analysis’ results helped directly to the transnational strategy development (arrow 9, Figure 1.8). Also one part of outcome concerning scenario infrastructure modification was a necessary precondition for the cost-benefit analysis on the final stage (arrow 8, Figure 1.8). Infrastructure analysis will be considered in details further in the chapter 4.
Indicators calculation
Indicators calculation is one of the key elements of Common Indicators, because it returned a number of parameters which showed the full picture about the current cycling mobility situation in the certain partner city or region and, thereby, made it possible to compare different cities. It is
30 a background for the indicators analysis (arrow 12, Figure 1.8). Also this component of Common Indicators has an influence on cost-benefit analysis (arrow 13, Figure 1.8).
According to the BICY project, all cycling indicators can be divided into three groups: standard indicators, bicycle use indicators and BICY indicator.
The assessment of bicycle infrastructure is made with the help of standard indicators: Cycling index = citizens of number tracks cycle of km
Network coverage index =
tracks cycle of km roads of km
Network density index = 2 km in area tracks cycle of km
BICY index was created by UNIBO-DICAM team with the aim to show better the attractiveness of a bicycle infrastructure for road users which has a direct influence on cycling usage. In the same time this index is simple to be calculated. It consists of two parts:
Coverage index = network road km path bike effective km End-point index = parks car public of number parkings bicycle public of number
It is logical that to make a trip from one point to another a cyclist needs to have a bike path and bicycle parking. That’s why conjunction “and” in previous sentence can be interpreted as multiplication:
BICY index = Coverage index x Endpoint index
If BICY index equals zero – the cycling infrastructure of a city or a region is underdeveloped. If BICY index equals one – a city or a region has achieved an ideal state of the cycling infrastructure.
Bicycle use indicators are parameters which show directly cycling mobility rate in comparison with above-described “infrastructure” indicators. The most well-known characteristic from this indicators group is the modal split calculated for the concrete trip length (for example, less than 5 km) and for the certain trip purpose (for example, from home to work):
bike share = trips of number total bike by trips of number
But, unfortunately, bicycle share has specific flaws which must be avoid. Additional indicators help to do it and, as a result, to get a fuller picture about bicycle usage:
31 km bike share = driven km total bike by km
car km = kmdrivenby car percitizen perday (for trips below 5 km)
Indicators calculation was based on the data got from each partner (arrow 2, Figure 1.8). As the information received from BICY partners had a number of problems mentioned above, two other components of the second stage – survey evaluation and infrastructure analysis – and their outcomes gave an opportunity to correct and to calibrate data or, sometimes, to fill gaps in them. In the Figure 1.8 these links were shown with arrows 10 and 11.
All presented indexes will be explained more thoroughly and discussed below in chapters 3, 4 and 5.
4.5 Stage 3 of Common Indicators activity
The final stage includes three elements: potential demand assessment, indicators analysis and cost-benefit analysis. They provided the final results of Common Indicators identification – an essential background for transnational strategy.
Potential demand assessment
Potential demand assessment based on the results got from survey evaluation (arrow 6, Figure 1.8). It is also possible to identify this component as a part of the survey evaluation. Potential demand was calculated and evaluated with the help of scenarios data. It showed a possible increase of cycling and public transport usee by implementation of a number and a variation of different measures. During this activity the characteristics of a “car lover” and a “potential bike user” were also estimated and the shares of such road users for every partner were calculated. Potential demand assessment is connected with the cost-benefit analysis (arrow 15, Figure 1.8). And it has also a direct influence on the transnational strategy development (arrow 14, Figure 1.8).
Indicators analysis
Indicators analysis is an analysis based on a number of indicators calculated on the previous stage (arrow 12, Figure 1.8) and described above. The main goal was to search any correlations between calculated indices and bicycle mode share and, if such ones exist, to analyze them for:
finding an explanation of influence made by different factors and
development of models which can make reliable prediction of cycling levels for the future
32 Indicators analysis had an effect on the transnational strategy formulation (arrow 16, Figure 1.8). Its results were described in details in the Common Indicators Report [13] and, especially, in the annexes I, J and K. All parts of theses will more or less return to them, but the main discussion will be done in the last chapter.
Cost-benefit analysis
Cost-benefit analysis is a calculation and estimation of the costs and benefits which will be obtained by potential increase of cycling rate. This activity is vitally necessary for the transnational strategy formulation (arrow 17, Figure 1.8). The common idea was to estimate profits which could be obtained by the reduction of accidents, energy-consumption and emissions due to growth of cycling mobility. For this reasons an amount of information was gathered within the data-collection action (arrow 3, Figure 1.8) including:
external costs: road injuries and fatalities caused by car drivers per year, transport-related energy consumption or CO2 emissions per person per day or per year, urban density;
cycling infrastructure costs: cost of 1km of cycle track (physically segregated and segregated by markers), costs for installing of 10 bicycle racks.
As it was stated above, the information about necessary infrastructure modification for the cost-benefit analysis was received from the infrastructure analysis (arrow 8, Figure 1.8). Indicators calculation gave data on the situation with cycling mobility, especially, concerning actual bike share (arrow 13, Figure 1.8). Potential demand assessment concluded the information on future changes in bicycle usage for different scenarios (arrow 15, Figure 1.8).
Conservative results of the Common Indicators component are the following:
cost-benefit ratios of up to 12:1 for eastern partners, saving lives and millions of Euros per year, by investing in bikeways;
substantial carbon reductions.
To find more detailed information about cost-benefit analysis, methods used for calculation and estimation, full list of results look at the Common Indicators Report [13].
5.
Main objectives of theses in the perspective of BICY
project
As it is seen from theses title, the main focus of the whole doctoral dissertation is to create and to develop methods of automated analysis which evaluate cycling infrastructure and demand for bicycle. This process will be divided into two main elements:
33 2. creation and development of special method for bicycle infrastructure assessment.
The main basis for the first method was mobility survey, survey evaluation and potential demand assessment. All these three components of Common Indicators and everything concerning them were presented above. These tasks were used as realization platform for creation and testing an automated analysis method which serves to make bicycle demand assessment. The following steps of its development were carried out:
survey evaluation and potential demand assessment: their necessity and their requirements;
search of existing survey methods to establish their similarities and differences, their advantages and disadvantages;
mobility survey carried out during the BICY project;
design and development of program which makes processing of questionnaires more automated and allows to create a database of obtained information;
handling of questionnaires data with the help of automated analysis approach which is a part of above-mentioned package and is oriented to required output results.
The method for bicycle demand assessment, its bases, its design and development will be described in the chapter 3.
The development of the method for bicycle infrastructure assessment was based essentially on three following components of Common Indicators: infrastructure data collection, infrastructure analysis and indicators calculation. The relationships between these three elements, their role and importance for the BICY project were described and explained above in the actual chapter. Also, by analogy with the first method, these tasks were a platform on which ideas for development of this automated analysis method can be realized:
what kinds of infrastructure data are required to make an assessment in the perspective of cycling mobility;
where and how this infrastructure data can be gathered; how obtained data can be processed and classified;
how the whole information can be analyzed and outputs can be presented;
what kinds of opportunities exist for the future implementation and development of this method in other projects and researches.
The method for bicycle infrastructure assessment, its development and other important questions concerning it will be considered in details in the chapter 4 of theses.
Also the analysis of good practices will be considered in the separate chapter of this doctoral dissertation. The main goals of this WP3 activity were described above. But here it will be
34 presented as a previous step before starting development of two automated analysis methods. It is needed mainly not only for understanding an actual situation with cycling mobility and finding leaders between countries and cities, but also for analysis of the best existing projects connecting with bicycle traffic and infrastructure and of their assessment methods and approaches. All these actions will help to determine research directions for development of above-mentioned methods and also to find reference points which must be known to start creation of these automated analysis approaches.
35
Chapter 2 – Analysis of Good Practices
1.
Historical development
Chapter 2 begins with a historical overview of cycling development. This subchapter shortly describes a history of bicycle traffic and infrastructure starting from appearance of the first cyclists until the end of the XX century.
1.1 The earliest years of cycling development
A bicycle was firstly introduced at the end of the nineteenth century. At that time it wasn’t necessary to build special facilities for this mode of transport because the existing infrastructure (main roads, dikes, etc.) could already be used. Besides, its structure was much better in comparison with the today’s situation: a route composed normally of the shortest lines from steeple to steeple. Primarily cyclists themselves tried to improve the comfort of cycling. The first attempt in this way was a pneumatic tire created by Dunlop.
The appearance of a car had cardinally changed the aligning of forces on a road. Of course, the number of cars right after their invention was extremely small: for example, on the Dutch roads in 1930 there were 67 000 cars versus 2.5 million bicycles. The main thing that a car brought with it was the change of the road network. Also, the amount of accidents increased due to a increased difference of speeds and masses of the various road users. Thereby, new roads and other road network facilities were designed taking into account the following:
bicycle traffic should be separated from motorized traffic; car flow must not interrupt;
road network should prevent physical conflicts between bicycles and cars.
The second development step started in the fifties: the first cycle tracks for recreational use were constructed. They were constructed in attractive recreational areas and financially supported by specific grants. There was no goal to connect them with the “utilitarian” cycle tracks. Also this cohesion was not included in the grant system.