OR
KING
P
APER
DISA
Dipartimento di Informatica
e Studi Aziendali
2010/8
Job fl ows in Italian SMEs:
a longitudinal analysis of
growth, size and age
DISA
Dipartimento di Informatica
e Studi Aziendali
A bank covenants pricing model
Flavio Bazzana
OR
KING
P
APER
2010/8
Job fl ows in Italian SMEs:
a longitudinal analysis of
growth, size and age
DISA Working Papers
The series of DISA Working Papers is published by the Department of Computer and Management Sciences (Dipartimento di Informatica e Studi Aziendali DISA) of the University of Trento, Italy.
Editor
Ricardo Alberto MARQUES PEREIRA [email protected]
Managing editor
Roberto GABRIELE [email protected]
Associate editors
Flavio BAZZANA fl [email protected] Finance
Michele BERTONI [email protected] Financial and management accounting Pier Franco CAMUSSONE [email protected] Management information systems Luigi COLAZZO [email protected] Computer Science
Michele FEDRIZZI [email protected] Mathematics Andrea FRANCESCONI [email protected] Public Management
Loris GAIO [email protected] Business Economics
Umberto MARTINI [email protected] Tourism management and marketing Pier Luigi NOVI INVERARDI [email protected] Statistics
Marco ZAMARIAN [email protected] Organization theory
Technical offi cer
Paolo FURLANI [email protected]
Guidelines for authors
Papers may be written in English or Italian but authors should provide title, abstract, and keywords in both languages. Manuscripts should be submitted (in pdf format) by the corresponding author to the appropriate Associate Editor, who will ask a member of DISA for a short written review within two weeks. The revised version of the manuscript, together with the author's response to the reviewer, should again be sent to the Associate Editor for his consideration. Finally the Associate Editor sends all the material (original and fi nal version, review and response, plus his own recommendation) to the Editor, who authorizes the publication and assigns it a serial number.
The Managing Editor and the Technical Offi cer ensure that all published papers are uploaded in the international RepEc public-action database. On the other hand, it is up to the corresponding author to make direct contact with the Depart-mental Secretary regarding the offprint order and the research fund which it should refer to.
Ricardo Alberto MARQUES PEREIRA
Dipartimento di Informatica e Studi Aziendali Università degli Studi di Trento
Job flows in Italian SMEs: a longitudinal analysis of
growth, size and age
Marco Corsino
1, Roberto Gabriele
2and Sandro Trento
3Department of Computer and Management Sciences, University of Trento, Via Inama, 5 – 38122 Trento (Italy)
Ver.1.0
Abstract
The paper proposes an empirical investigation of job flows for continuing manufacturing firms in Italy from 1996 to 2004 using high quality data on work forces and other characteristics of the firm. The magnitude of the job flows for small and medium-sized limited liability companies in Italy is lower than what observed in Anglo-Saxon countries, but it is still in line with evidence for firms in the Euro area. Second, the magnitude of job flows significantly shrunk in the aftermath of the economic downturn in 2001. Firms fared worse than in the late nineties and the labour market became less efficient in allocating job flows. Third, gross job creation and gross job destruction decrease as firm get larger, but when added to compute an indicator of net employment growth, size does not seem to affect firms’ expansion. On the contrary, age significantly hinges on the growth opportunities of small and medium-sized enterprises. The econometric analysis corroborates the major findings of our descriptive investigation referring to the role of size and age. In particular, it shows that classification methods used to define size classes strongly influence the estimated relationship between growth and size industrial regimes play a role in shaping job flows. Our result show that firms in supplier dominated industries fared significantly lower than enterprises in other sectors during the sample period.
Keywords: Job creation, job destruction, persistence of jobs, firm growth. JEL-Codes: J62, L60
1. Introduction
This paper present new and original evidence on employment dynamics and gross job flows in small and medium sized Italian manufacturing on a relatively long period. The empirical investigation pursuits two major objectives. On the one side, we aim at shedding some light
1 e-mail: [email protected]
2 Corresponding author: Roberto Gabriele. University of Trento via Inama, 5 (38122) tel. +39 0461 282109.
Fax: +39 0461 282124. mail: [email protected]
on job flow dynamics and persistence at different levels of aggregation. In particular, our exploration unfolds along three dimensions: (i) the structural characteristics of the firm (i.e., firm size and age); (ii) the technological regimes characterizing the industrial environments where firms operate; (iii) the nature and influence of labour market institutional in distinct geographical areas. On the other side, we address a largely debated issue in both fields of labour economics (Birch, 1987) and industrial organization (Sutton, 1997), that is whether small firms do actually offer a greater contribution to employment growth than large establishments. The opportunity to go over such a question is prompted by the observation that peculiarities in the firm size distribution and the nature of industrial specialization can lead developed economies towards unfavourable conditions that, eventually, harm their potential of growth in the long run.
The empirical and theoretical literature has highlighted the importance of job flow analysis (Burda and Wyplosz, 1994; Davis et al., 1996; Blanchard and Diamond, 1990; Pissarides, 2000). A frequent result is that labour markets are continually shaped by the phenomena of job creation and job destruction. The magnitude of job flows is relevant in deriving alternative theories of unemployment and wage determination. In the case of the US the large size of job flows has enhanced various theories that model unemployment as a frictional phenomenon (Pissarides, 2000). The geographical dispersion of jobs as well as the heterogeneity of the available skills relative to firms' requirements represent (among other things) sources of friction in the labour market. At the same time, the persistence of job flows in the labour market puts some limits on the validity of the theories based on the contraposition of different groups of employees (insiders) and unemployed (outsiders) that seem to explain the persistent positive unemployment rates in the economy. The empirical studies on gross job flows are important in the analysis of employment dynamics at firm/plant level. Davis and Haltiwanger (1999) associate the largest job flows with the youngest firms/plants. Their results establish a solid relationship between firm age and firm heterogeneity. Furthermore, their analysis provides empirical evidence of the importance of market selection mechanisms and their effects on industry evolution (Dosi et al., 1995). The magnitude of job flows points to the limitations involved in modelling industrial dynamics using representative firms. The relevant and persistent heterogeneity of firms implies that aggregation processes function to smooth the asymmetries and non-linearities of employment dynamics at firm level.
productivity gains at industry level. Accordingly, job flow data are very useful for analysing the relationship between the reallocation process and productivity and salary growth.
Finally, job flows are a good instrument to use to explore the nature of the business cycle and its relations with such processes as the reallocation of jobs and employees. Different phases of business cycles are characterised by different degrees of job creation and destruction; however, even if an expansion/contraction of the economy takes place, job destructions/creations will still be present and relevant. Davis et al. (1996) observed contemporaneous job creation and destruction, which might be considered an indicator of the importance played by firm heterogeneity and the underlying selection processes in the labour market.
Our study provides several distinct contributions to the literature. First, it provides fresh evidence on gross job flows and employment dynamics using an original and unique database comprising data on labour forces, age, economic activity and geographical location for more than 8,300 Italian manufacturing firms during the period 1997-2004. Second, it quantifies and discusses the relative ability of medium-sized enterprises in fostering job expansions as opposed to small and micro units. Thereafter, it focuses on companies in a region of the firm size distribution that previous contributions have generally overlooked (Becchetti and Trovato, 2002; Fagiolo and Luzzi, 2006; Bottazzi et al., 2007; Angelini and Generale, 2008). Third, the analysis uncovers the relative contribution of sheer size and age on the growth performance of continuing firms. Forth, the analysis evaluates how firms differently reacted to the business cycle downturn in year 2001 and its aftermath.
The remainder of the paper is organized as follows. Section 2 outlines measurement issues and definitions that are commonly used in the literature on job flows. Later on, it describes the major features of our data. Section 3 presents the evidence on job flows through a set of indicators and a grid of levels of analysis. Section 4 discuss the results of our econometric analysis on the effect of size and age on employment growth rates. Section 5 is devoted to concluding remarks.
2. Measurement and data
Basic definitions
The literature provides several different definitions of job flows and ways of estimating them, taking into account the distortions besetting these procedures. The main difficulty consists of identifying the job flows for individual firms, where a single job is defined as an employment
position that can be filled (or temporarily not) by a worker. We must emphasise here that worker flow is a slightly different concept: worker flow does not always equate with job flow (even though there is a huge overlap between the two). For instance a firm could decide to fire a worker, but not eliminate the corresponding job. Thus, very few available microdata are perfectly suited to measuring job flows at firm level.
The standard way to measure the jobs created within a firm is to take the number of employees in two periods and compare them. Therefore, we define job creation for sector I
at time t (JCIt) as the employment increases in expanding firms – where the comparison is made by looking at employment levels at time t−1 and at time t - plus the number of
employees of new firms that enter that sector at time t. Similarly, we measure job destruction at time t in sector I (JDIt) as the sum of decreases in the employment levels of firms plus the decreases in number of employees due to firm exits from that sector.
The growth rates for both job creation and destruction are obtained by dividing job creation and destruction levels by a measure of sector size. Defining the size of a firm i as the average size in period (t,t−1):
€
Zit = 0.5⋅ (Nit+ Nit −1), the corresponding employment growth rate is
given by: it it it Z N
g = Δ . The growth rate is bound between [−2,2] and behaves symmetrically in contractions and expansions. The standard measure usually implemented in the literature is bounded in [−1,+∞) and shows non-symmetric reactions to expansions and contractions. Consequently, the sector I rate of job creation can be written as:
. = , = It It it It it It S i It Z JC g Z Z E i jc
∑
∈ + ∈ (1)Similarly the sector job destruction rate is given by: . |= | , = 1 It It it It it It S i It Z JD g Z Z X i jd
∑
− − ∈ ∈ (2)Equations (1) and (2) show that sectoral rates of creation and destruction can be obtained from a weighted average of individual growth rates, the weight given by employment shares. Following the seminal work by Davis et al. (1996), other important definitions are:
• net employment growth rate: netIt = jcIt − jdIt, which gives us the net change in
• total job reallocation: jrIt = jcIt+ jdIt, which is a measure of the degree of gross
"activity" in the labour market, and represents a measure of the overall capacity of the system to create and destroy jobs;
• excess job reallocation: xjrIt = jrIt−|netIt|, which provides an indicator of the labour
market capacity to reallocate jobs when we control for the effect of growth; it provides a measure of the job changes necessary to accommodate changes in employment.
All these measures can be calculated for the whole economy as well as for subsets of the economy obtained through different disaggregation directions, namely age, size and region. Another important measure is the persistence of job creation and destruction after one, two and three years. We define as the j periods persistence of job creation as the percentage of jobs created at period t that are not yet destroyed in period t+j. Conversely, the persistence of jobs destroyed is defined s the number of jobs destroyed in period t that do not reappear in period t+j. In estimating persistence of flows we follow the methodology of Davis et al (1992). In particular, for all firms i that created job in period t (Xt>Xt-1), i∈I: the number of
jobs created period t and continuing in period t+j is given by:
€
δi,t + j =
Xi,t − Xi,t −1 if Xt + j ≥ Xi,t
0 if Xi,t + j ≤ Xi,t −1
Xi,t + j − Xi,t −1 if Xi,t + j∈[Xi,t + j, Xi,t −1]
⎧ ⎨ ⎪ ⎩ ⎪
The persistence of jobs created in period t and persistent in period j is then calculated as follows:
€
Pi,t + j = min{δi,t +1,δi,t +2,...,δi,t + j} .
Finally, the percentage of jobs persistent in period t+j for a group of expanding firms (I+) can be obtained dividing the number of persistent jobs by the number of jobs created in period t in the group I: PI+,t + j = Pi,t + j CI+,t i∈I+
∑
.€ PI−,t + j = Pi,t + j DI−,t i∈I−
∑
.All these measures can be calculated for the whole economy as well as at a chosen level and dimension of disaggregation, namely age, size and region.
Database
The empirical analysis carried out in this paper exploits an original dataset comprising information on 8,314 Italian manufacturing firms over the period 1996-2004. The database, currently housed at the University of Trento, represents a unique collection of data for Italy because it allows to deepen our understanding of the dynamics of incumbent firms on a relatively long period of time.
The primary source of our data is the Bureau Van Dijk’s AIDA database, which provides detailed information on the financials, geographical localization, number of employees and local units for a large sample of limited liability Italian firms. From the original collection of data we selected a sub-sample of single-location manufacturing firms, which were continuously active during the nine years covered in this analysis. Since the original employment figures were missing for several companies, we supplemented the data with information on work forces from the National Institute of Social Security (INPS) and Mediobanca’s R&S database. From these two sources we obtained the yearly average number of employees for all firms in the sample: hence, our occupational data account for seasonal effects that may be pronounced in various economic sectors. The integration procedure endowed us with highly reliable employment data, a characteristic that has been strongly advocated in late studies on job flows (Haltiwanger et al. 2010).
Other features of our database distinguish the empirical analysis carried out in this paper from the existing literature on Italian firms (Becchetti and Trovato, 2002; Fagiolo and Luzzi, 2006; Bottazzi et al., 2007; Angelini and Generale, 2008). First, by dealing with single-location firms we can work at a level of analysis that is as close as possible to the establishment level commonly used in international studies. Furthermore, focusing on single-location firms we can properly gauge the “organic” growth of firms: in fact, changes in ownership arising out of mergers, acquisitions and divestitures affect only marginally the group of firms in our sample. Besides, we can evaluate how the functioning of regional labour markets hinges on the ongoing dynamics of firms, while neutralizing the spurious effect stemming from the intra-group reallocation of equipment and personnel.
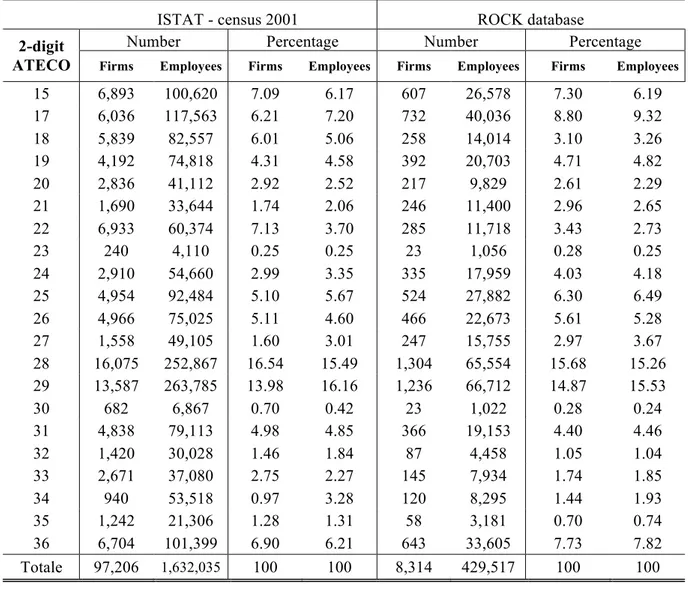
Table 1. Comparison between ROCK database and ISTAT
ISTAT - census 2001 ROCK database
Number Percentage Number Percentage
2-digit
ATECO Firms Employees Firms Employees Firms Employees Firms Employees
15 6,893 100,620 7.09 6.17 607 26,578 7.30 6.19 17 6,036 117,563 6.21 7.20 732 40,036 8.80 9.32 18 5,839 82,557 6.01 5.06 258 14,014 3.10 3.26 19 4,192 74,818 4.31 4.58 392 20,703 4.71 4.82 20 2,836 41,112 2.92 2.52 217 9,829 2.61 2.29 21 1,690 33,644 1.74 2.06 246 11,400 2.96 2.65 22 6,933 60,374 7.13 3.70 285 11,718 3.43 2.73 23 240 4,110 0.25 0.25 23 1,056 0.28 0.25 24 2,910 54,660 2.99 3.35 335 17,959 4.03 4.18 25 4,954 92,484 5.10 5.67 524 27,882 6.30 6.49 26 4,966 75,025 5.11 4.60 466 22,673 5.61 5.28 27 1,558 49,105 1.60 3.01 247 15,755 2.97 3.67 28 16,075 252,867 16.54 15.49 1,304 65,554 15.68 15.26 29 13,587 263,785 13.98 16.16 1,236 66,712 14.87 15.53 30 682 6,867 0.70 0.42 23 1,022 0.28 0.24 31 4,838 79,113 4.98 4.85 366 19,153 4.40 4.46 32 1,420 30,028 1.46 1.84 87 4,458 1.05 1.04 33 2,671 37,080 2.75 2.27 145 7,934 1.74 1.85 34 940 53,518 0.97 3.28 120 8,295 1.44 1.93 35 1,242 21,306 1.28 1.31 58 3,181 0.70 0.74 36 6,704 101,399 6.90 6.21 643 33,605 7.73 7.82 Totale 97,206 1,632,035 100 100 8,314 429,517 100 100
Second, the availability of information about firm age gives us the opportunity to control for a factor that significantly mediates the relationship between firms’ size and their propensity to create and destroy jobs (Evans, 1987; Dunne and Hughes, 1994; Haltiwanger et al., 2010). Third, we deal with small and medium sized firms whose average size is around fifty employees during the nine years of analysis. The availability of these data allows us to investigate and compare the dynamics of units in a region of the firm size distribution that early studies have overlooked. Forth, the distribution of firms and employees in our database by two-digit ATECO sectors is pretty consistent with the distribution of firms and employees for the population of single-location firms in Italy in 2001 (Table 1). If jointly considered, the last two features support the idea that the empirical findings we present in this paper may capture patterns that are common across Italian limited liability companies. At the same time, however, it is worth mentioning that single-location, limited liability companies represented the 17.51% of all Italian manufacturing firms in 2001 and accounted for 33.85% of the total
employees in the manufacturing sector. Thereafter, we will steer clear of generalizing our results to the population of Italian manufacturing firms.
3. Descriptive analysis
Magnitude
Table 2 reports average statistics on job flows over the entire period of analysis. The final row of the table points out that employment at sampled companies grew on average by 1% on a yearly base over the period 1997-2004. The observed net employment growth is the result of twelve-month job creation rates that averaged 4.8% and twelve-month job destruction rates that averaged 3.8% between 1997 and 2004. Table 2.2 also reveals that the job reallocation rates equaled an average 8.5%, thus signaling that about one in eleven manufacturing jobs are either destroyed or created in a one year interval. Finally, the excess job reallocation, that part of the overall capacity of the system over and above the amount required to accommodate the observed employment change, averaged 7.6% per year.
Table 2. Annual job flow rates
Year jc jd net jr xjr 1997 5.58 3.15 2.44 8.73 6.29 1998 5.91 2.85 3.06 8.76 5.70 1999 5.28 3.50 1.79 8.78 7.00 2000 6.57 2.56 4.00 9.13 5.13 Average 97-94 5.84 3.01 2.83 8.85 6.02 2001 4.48 4.74 -0.26 9.22 8.96 2002 3.74 4.54 -0.80 8.28 7.48 2003 3.35 4.47 -1.12 7.82 6.69 2004 3.35 4.31 -0.96 7.67 6.70 Average 01-04 3.73 4.52 -0.78 8.25 9.03 Average entire period 4.76 3.78 0.98 8.54 7.56
Notes. jc: job creation; jd: job destruction; net: net employment growth; jr: job reallocation; xjr: excess job
The key message conveyed by these figures is the relatively small magnitude of job flows for sampled companies as compared with findings in other studies of average gross job flows (Davis et al., 1996; Contini and Revelli, 1997; Neumark et al., 2008; Cefis and Gabriele, 2009; Hijzen et al., 2010). Such a comparison may nonetheless be misleading because of differences in the sampling units, geographical coverage and the time horizon over which the analyses unfold. In particular, in Italy (as well as in other European counties) the labour-market legislation makes it cumbersome to lay off (permanent) workers thus increasing the reluctance of businesses to hire. Besides, rigidities in the labour-market leave firms ill-equipped to face gloomy conditions and tend to lower the workers’ exit rate from unemployment.
These forces may entail meagre job flows as empirical evidence in Gomez-Salvador et al. (2004) suggest: the authors estimate job creation rates of 5.6% and job destruction rates of 3.7% for a large sample of limited liability companies in the Euro area between 1992 and 2000. Second, manufacturing firms generally display job flows that are lower in magnitude than those observed for firms operating in other sectors at both the national (Contini et. al, 2002) and the regional (Cefis and Gabriele, 2009) level of analysis. Third, by working with single-location firms we are as close as possible to the establishment level of analysis where job flows are lower than those observed at the firm level (Neumark et. al, 2008). Forth, the economic downturn in 2001 and its aftermath twisted the industrial system and amplified structural weaknesses in the labour market. Indeed, a comparison of job flow averages over the period 1997-2000 with the period 2001-2004 singles out a decrease of more than two percentage points in the job creation rate and an increase of one and a half percentage points in the job destructions rate. The joint effect of this dynamics has been a slump in the net employment growth rate from 2.8% to -0.8% and a decrease in the efficiency with which the market simultaneously creates and destroys job positions – the excess job reallocation raises from 6% to 7.6% - to accommodate the realized employment growth.
Job flows by firm size and age
Analysis of job flows by firm size implies a subdivision of firms into size classes. When performed on longitudinal data and on arbitrary bounds this can introduce some distortions, known as the "distribution fallacy".4 The distribution fallacy, as noted by Davis et al. (1996), is related to the eventual migration of firms across size classes. The larger the migration, the
higher the overestimation of the relative weight of small firms in creating or destroying jobs. In addition, the problem could be made worse by the temporary nature of these fluctuations. In order to minimise the distribution fallacy we need to choose a proxy for firm size that minimises class migration over the entire period of observation.
In the literature at least three different size proxies have been applied to longitudinal data: (a) base year size; (b) the current size; (c) the long run average size. The first measure uses the number of the employee in the base year to proxy for firm size. The current size indicator utilises the average number of employees in two contiguous periods. Accordingly, it overcomes measurement error and transitory shock problems, which can affect the size of firms - in particular small firms (Davis et. al. 1996). The third proxy makes use of the average of the number of employees over a longer period of time to smooth employment and to minimise the effects of temporary migrations across classes.
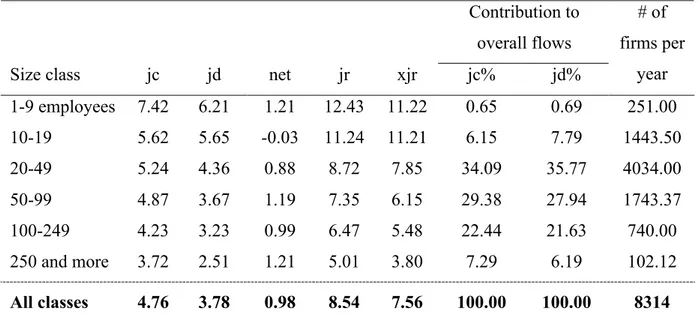
Table 3 reports the average job flows by classes of firm size defined on the basis of the current size proxy. A strong regularity across size classes indicates that small employers display a much higher propensity to create as well as destroy new jobs than large employers. Indeed, job creation rates halve from an average 7.4% for the smallest firms to an average 3.7% for companies occupying more than 250 employees. Job destruction rates decrease monotonically as we move from micro-units (6.2%) to the largest firms in the sample (2.5%). The combined effect of these two measures yields net employment growth rates that do not display any systematic relationship with plant size. On the contrary, the degree of gross activity in the labour market, i.e. the job reallocation rate, shrinks as size increases: it averages 12.4% for micro-units, a value that is more than twofold than the one computed for the largest firms (5%). Since job reallocation gauges the dispersion of the distribution of growth rates, the foregoing evidence suggests that smaller firms are typically more volatile than their larger competitors.
Table 3. Job flows by size classes: 1997-2004 (current size measure)
Contribution to overall flows Size class jc jd net jr xjr jc% jd%
# of firms per year 1-9 employees 7.42 6.21 1.21 12.43 11.22 0.65 0.69 251.00 10-19 5.62 5.65 -0.03 11.24 11.21 6.15 7.79 1443.50 20-49 5.24 4.36 0.88 8.72 7.85 34.09 35.77 4034.00 50-99 4.87 3.67 1.19 7.35 6.15 29.38 27.94 1743.37 100-249 4.23 3.23 0.99 6.47 5.48 22.44 21.63 740.00 250 and more 3.72 2.51 1.21 5.01 3.80 7.29 6.19 102.12 All classes 4.76 3.78 0.98 8.54 7.56 100.00 100.00 8314
As for the contribution of each class to the overall job flows, our analysis indicates that medium-sized enterprises, those with a labour force between 50 and 249 employees, account for the largest share in job creation (51.8%) and job destruction (49.6%). Moreover, the shares of the two size classes constituting the group of medium-sized firms are almost equal although the number of enterprises in the class 50-99 employees is more than twice as large as the number of firms in the upper class. Also, small enterprises with a labour force between 20 and 49 employees represent a large share of job flows: they account for the 31.7% and 36.3% of job creation and destruction, respectively.
Table 4 reports net and gross job flows by age of firm. One age-related pattern standing out from the table entails a job creation rate that declines almost proportionately with the doubling of firm age.5 Firms that are 1-7 years old show an average job creation rate of 8, those aged from 16 to 25 years experience an average 4.7% rate and, finally, enterprises that are more than 50 years old go through a 2.6% job creation rate. On the contrary, there doesn’t appear any systematic pattern in the evolution of the job destruction rate by age classes: average values over the sample period range from a minimum of 3.6% among the youngest firms to a maximum of 3.9% for both firms in the second and the fifth age classes.
5 Notice that this pattern holds even if the closed panel structure of our data makes the number of companies in
Table 4. Job flows by age classes: 1997-2004
Contribution to overall flows Age class jc jd net jr xjr jc% jd%
# of firms per year 1-7 years 8.04 3.55 4.49 11.59 7.10 6.88 3.83 463.38 8-15 5.98 3.87 2.12 9.85 7.73 27.97 22.77 2221.50 16-25 4.73 3.85 0.87 8.58 7.71 36.68 37.67 3098.75 26-49 3.89 3.65 0.24 7.54 7.30 25.50 30.13 2190.00 50 and more 2.59 3.87 -1.28 6.46 5.18 2.97 5.59 340.38 All classes 4.76 3.78 0.98 8.54 7.56 100.00 100.00 8314
The net employment growth rate decreases monotonically with firm age and it even becomes negative for the oldest companies in the sample. This pattern is consistent with the idea that young and dynamic ventures enjoy a relative advantage in seizing new business opportunities over more mature firms. Whereas youth brings about higher prospects for growth, employment volatility is large among businesses in the early stage of their life cycle and it declines sharply as time passes. Indeed, the average job reallocation rate drops from 11.2% in the first age class to 6.5% for companies that are 50 years and more old. Finally, it is worth mentioning that the contribution of each age class to the overall job flows display a higher degree of symmetry than what previously observed in Table 3. The largest contribution to job creation (36.7%) and job destruction (37.7%) comes from companies aged between 16 and 25 years. Still, companies in the age classes immediately below and above the one considered account for about 25% of jobs created and lost between 1997 and 2004.
Job persistence by firm size and age
To give a clearer picture of Italian job flows dynamic we need to answer to another question, namely, how persistent are job creation and destruction figures that we showed above. This is a key aspect to understand the nature of job reallocation process with respect to the temporary movements of workers across, in and out jobs. An high degree of persistence of jobs in the system is associated with permanent movements of labour forces of firms and can have insightful policy implications. To shed light on such aspects we follow the methodology of Davis et al. (1992) and we measure the persistence of newly created and newly destroyed jobs.
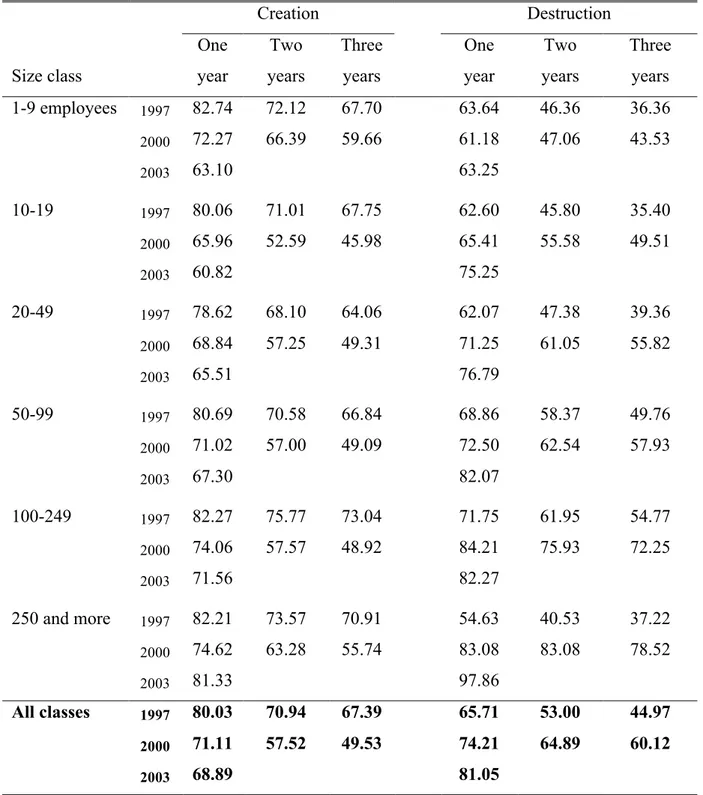
Table 5 shows average persistence over the subsequent four years of new jobs that were created in years 1997, 2000 and 2003. These years are chosen to highlight different phases of business cycle in Italy: the first one is a pre-downturn year, the second year is a period in which there were signals of recession and, lastly, a post downturn period.
Results show that the one year persistence in job created in 1997 is about 80%, a value higher than the corresponding value for other countries (Davis et al., 1992; Armington and Acs 2004). The result is even more interesting if we note that we are analysis only continuing single unit firms of manufacturing sector that in general present lower average persistence rates than new firms, multi establishments and services sector firms (Armington and Acs, 2004). Two years persistence rates decrease of about 9 percentage points and after three years only around 2% jobs are lost. Jobs created in year 2000 present a persistence rate lower of about 10% suggesting the big role played by the economic crisis at the beginning of 2000th. The decrease in two and three years persistence is striking going from 71% to 58% for two years measure and from 67% to 49% for three years measure.
Firms belonging to different size classes present similar persistence rates at one, two and three years. The evidence suggests that for continuing firms size is not a relevant measure to understand their ability of persistently created jobs.
Again we find differences in evidence if we analyze years hit by crisis. Indeed, in all classes we observe a decrease in persistence rates. In this respect, small firms (1-9- employees) show a decrease in three years persistence rate that is smaller determining a final level of persistence that is the higher among all the classes considered (60%). This is likely to be the result of a selection bias: continuing firms are better fitted to survive in the market and more competitive than other small firms. As a result in this class only better firms are observed and hence higher persistence rates are obtained.
Table 5. Average job persistence in years 1997-2003 by firm size. Creation Destruction Size class One year Two years Three years One year Two years Three years 1-9 employees 1997 82.74 72.12 67.70 63.64 46.36 36.36 2000 72.27 66.39 59.66 61.18 47.06 43.53 2003 63.10 63.25 10-19 1997 80.06 71.01 67.75 62.60 45.80 35.40 2000 65.96 52.59 45.98 65.41 55.58 49.51 2003 60.82 75.25 20-49 1997 78.62 68.10 64.06 62.07 47.38 39.36 2000 68.84 57.25 49.31 71.25 61.05 55.82 2003 65.51 76.79 50-99 1997 80.69 70.58 66.84 68.86 58.37 49.76 2000 71.02 57.00 49.09 72.50 62.54 57.93 2003 67.30 82.07 100-249 1997 82.27 75.77 73.04 71.75 61.95 54.77 2000 74.06 57.57 48.92 84.21 75.93 72.25 2003 71.56 82.27 250 and more 1997 82.21 73.57 70.91 54.63 40.53 37.22 2000 74.62 63.28 55.74 83.08 83.08 78.52 2003 81.33 97.86 All classes 1997 80.03 70.94 67.39 65.71 53.00 44.97 2000 71.11 57.52 49.53 74.21 64.89 60.12 2003 68.89 81.05
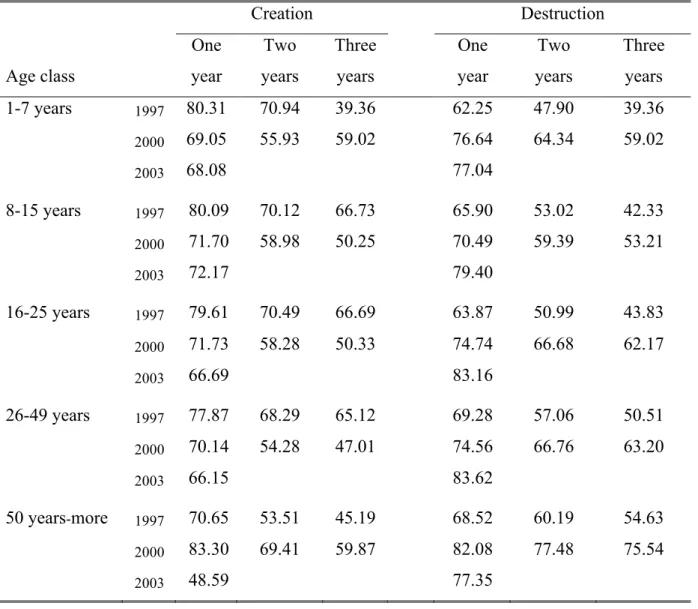
Table 6. Job persistence by age: cohorts of firms Creation Destruction Age class One year Two years Three years One year Two years Three years 1-7 years 1997 80.31 70.94 39.36 62.25 47.90 39.36 2000 69.05 55.93 59.02 76.64 64.34 59.02 2003 68.08 77.04 8-15 years 1997 80.09 70.12 66.73 65.90 53.02 42.33 2000 71.70 58.98 50.25 70.49 59.39 53.21 2003 72.17 79.40 16-25 years 1997 79.61 70.49 66.69 63.87 50.99 43.83 2000 71.73 58.28 50.33 74.74 66.68 62.17 2003 66.69 83.16 26-49 years 1997 77.87 68.29 65.12 69.28 57.06 50.51 2000 70.14 54.28 47.01 74.56 66.76 63.20 2003 66.15 83.62 50 years-more 1997 70.65 53.51 45.19 68.52 60.19 54.63 2000 83.30 69.41 59.87 82.08 77.48 75.54 2003 48.59 77.35
Job destruction persistence rates show that on average around 66% of job destroyed in 1997 ado not reappear after one year. The percentage is higher if we consider other cohorts of jobs destroyed (2000 and 2003) showing again a second important effect of the economic crisis: a reallocation process inside the manufacturing sector. The effect of crisis is clear also considering two and three years persistence: on average we observe a rise in persistence rates both for jobs destroyed in 1997 and 2000 (respectively, from 53% to 65% and from 45% to 60%). The effect of crisis seems to be bigger on larger: More than 72% -for 100-249 employees firms- and 78% -for more than 249 employees firms- of jobs destroyed do not still reappear after three years. In this respect small firms seem to perform considerably better, with persistence rates going from 44% for smaller firms to 58% for SME with 50-99 employees.
From the discussion above the role of age of firms is completely absent. To investigate whether and how the age of firm play a role in generating permanent and/or temporary job flows figures we divided our sample of firms according to their age in the year 1997. We assigned our firms to five age classes and then for each cohort of firms we estimated the persistence of job created and destroyed in three years: 1997, 2000 and 2003. Table 6 presents the results of the analysis of job creation and destruction persistence of cohorts of firms.
Old firms are characterized by a lower degree of job persistence than younger ventures at one (70. 7%), two (53.5%) and three years (45.2%). It also shows that the decline in the one year persistence of job creation is common across all age classes. The cohort of young firms, as well as, the one of older firms shows lower level of three years job creation persistence compared to other classes.
The three years job destruction persistence for firm more than 26 years old is around 85% bigger than the corresponding measure for the other firms. Moreover, after the crisis the job destruction persistence rates for older firms are higher than those for younger firms: 75% for more than 50 year old. Signaling again that older firms were hit from crisis more severely than other firms.
Job flows, technological regimes and firm location
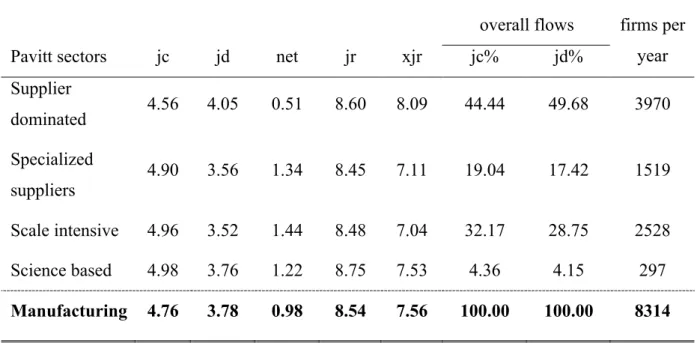
The analysis of job flows by industrial sectors in the Pavitt taxonomy (Pavitt, 1984) reveals the poor performance of companies in traditional industries (Table 7). During the 1997-2004 supplier dominated businesses fared relatively worse than enterprises in all other sectors: their average net employment growth rate was 0.5%, almost one third of the value observed in scale intensive sectors (1.4%). Such an upshot is due to both a lower propensity of firms in traditional businesses to open new jobs - the job creation rate is 0.5 percentage points lower than in other groups - and a higher rate of job destruction as a consequence of tougher competition in international markets.
It also comes out that traditional sectors contribute for the largest share to gross job flows (on average, 44.4% of job creation and 49.7% of job destruction), but their efficiency in reallocating workers so as to achieve the observed employment growth is lower than the one observed elsewhere in the economy - the excess job reallocation is 8.1%, one percentage point higher than the value estimated for the scale intensive sectors.
Table 7. Job flows by Pavitt sectors: 1997-2004
Contribution to overall flows Pavitt sectors jc jd net jr xjr jc% jd%
# of firms per year Supplier dominated 4.56 4.05 0.51 8.60 8.09 44.44 49.68 3970 Specialized suppliers 4.90 3.56 1.34 8.45 7.11 19.04 17.42 1519 Scale intensive 4.96 3.52 1.44 8.48 7.04 32.17 28.75 2528 Science based 4.98 3.76 1.22 8.75 7.53 4.36 4.15 297 Manufacturing 4.76 3.78 0.98 8.54 7.56 100.00 100.00 8314
Table 8. Job flows by macro-areas: 1997-2004
Contribution to overall flows Macro-area jc jd net jr xjr jc% jd% # of firms per year North-west 4.12 3.54 0.59 7.66 7.07 36.24 39.16 3410 North-east 5.17 3.87 1.30 9.04 7.74 40.55 38.21 3013 Centre 5.04 4.10 0.95 9.14 8.19 15.67 16.04 1415 South 5.99 4.16 1.83 10.15 8.31 7.54 6.59 476 Manufacturing 4.76 3.78 0.98 8.54 7.56 100.00 100.00 8314
The analysis of job flows by geographical locations shows that trends already in place in the mid nineties (Contini et al., 2002) have kept spreading until 2004. In particular, net employment in the Northern-west regions has grown, on average, by 0.6% between 1997 and 2004, less than a half of the growth (1.3%) experienced by firms in Northern-east. This result is strictly related with the peculiar specialization of the two areas; the former is mainly involved in supplier dominated industries while the latter displays a higher concentration of
specialized suppliers. The uneven dynamics of these two sectors during the eight-year period directly hinged on the performance of enterprises located in the two areas. Moreover, a closer look at the two components of the net employment growth indicator clarifies that the sluggish performance of North-western firms is primarily due to their lower propensity to create new jobs (4.1%) as opposed to enterprises in the North-east (5.2%). The small number of sample firms that are located in Southern Italy (476) recommends caution in interpreting the magnitude of job flows for this group. In fact, whereas these companies outperformed enterprises in other parts of Italy with an average 1.8% net employment growth rate, the average job reallocation rate at 10.2% and the average excess job reallocation rate at 8.3% suggest that the growth rates are more volatile and the labor market is less efficient in this area than in other places.
4. Econometric analysis
We draw upon a non-parametric regression approach to explore how firm size and age hinge on the observed employment growth rates. Alternative specifications are considered to address two critical issues that affect the estimated relationship between firm size and growth (Haltiwanger et al., 2010): (i) the interplay between firm size classification methods and the statistical phenomenon of regression to the mean that can generate an upward bias in the coefficients for small enterprises; (ii) the moderating role of firm age in the size-growth relationship. In our main specifications net employment growth rates, computed on a yearly base, are regressed against two sets of dummy variables measuring firm size and firm age, respectively. Furthermore, all specifications include controls for industry participation, geographical location and the effect of business cycle.
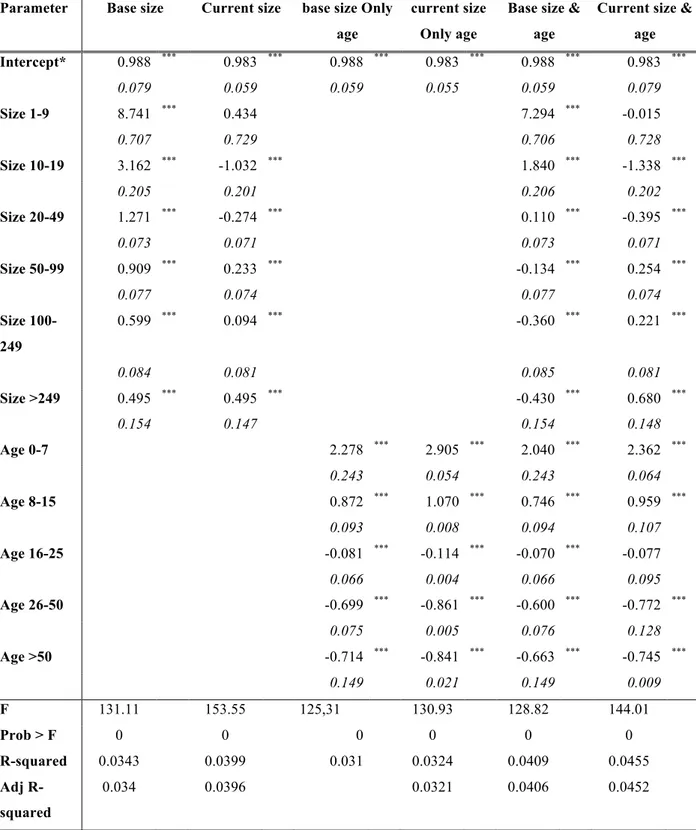
Table 9 reports the estimated coefficients for the variables of major interest in our discussion. Unfortunately, the introduction in the model of several systems of dummy variables makes the interpretation of the intercept of the model and of the other coefficients pretty cumbersome. To overcome this problem several procedures (Zanchi, 1998; Hirschberg and Lye, 2001) have been suggested that transform the estimated dummy variable coefficients thus allowing a straightforward interpretation of the parameter as a differential with respect to the average value of the dependent variable, computed over all units in the sample. In this paper we adopt the procedure originally introduced by Morgan (1964) for the case of a single dummy variables and later extended by Sweeney and Ulveling, (1972) to deal with equations including several dummy variable systems. The critical advantage of this procedure is that once transformed the coefficient of a dummy variable can be interpreted as the deviation of the associated class with respect to the grand mean of the dependent variable, in our case the growth rate.
Table 9. Net employment growth regressions (transformed coefficients according to Morgan procedure)
Parameter Base size Current size base size Only
age
current size Only age
Base size & age
Current size & age Intercept* 0.988 *** 0.983 *** 0.988 *** 0.983 *** 0.988 *** 0.983 *** 0.079 0.059 0.059 0.055 0.059 0.079 Size 1-9 8.741 *** 0.434 7.294 *** -0.015 0.707 0.729 0.706 0.728 Size 10-19 3.162 *** -1.032 *** 1.840 *** -1.338 *** 0.205 0.201 0.206 0.202 Size 20-49 1.271 *** -0.274 *** 0.110 *** -0.395 *** 0.073 0.071 0.073 0.071 Size 50-99 0.909 *** 0.233 *** -0.134 *** 0.254 *** 0.077 0.074 0.077 0.074 Size 100-249 0.599 *** 0.094 *** -0.360 *** 0.221 *** 0.084 0.081 0.085 0.081 Size >249 0.495 *** 0.495 *** -0.430 *** 0.680 *** 0.154 0.147 0.154 0.148 Age 0-7 2.278 *** 2.905 *** 2.040 *** 2.362 *** 0.243 0.054 0.243 0.064 Age 8-15 0.872 *** 1.070 *** 0.746 *** 0.959 *** 0.093 0.008 0.094 0.107 Age 16-25 -0.081 *** -0.114 *** -0.070 *** -0.077 0.066 0.004 0.066 0.095 Age 26-50 -0.699 *** -0.861 *** -0.600 *** -0.772 *** 0.075 0.005 0.076 0.128 Age >50 -0.714 *** -0.841 *** -0.663 *** -0.745 *** 0.149 0.021 0.149 0.009 F 131.11 153.55 125,31 130.93 128.82 144.01 Prob > F 0 0 0 0 0 0 R-squared 0.0343 0.0399 0.031 0.0324 0.0409 0.0455 Adj R-squared 0.034 0.0396 0.0321 0.0406 0.0452
*In all the regressions the intercept term is equal to grand mean of growth rate given the transformation applied.
Notes: . ***: prob. <0.01; **: prob<=0.05. Standard errors in italics. The number of observation in each regression is 66512. Unadjusted standard error reported. All the regressions include time dummies, sector
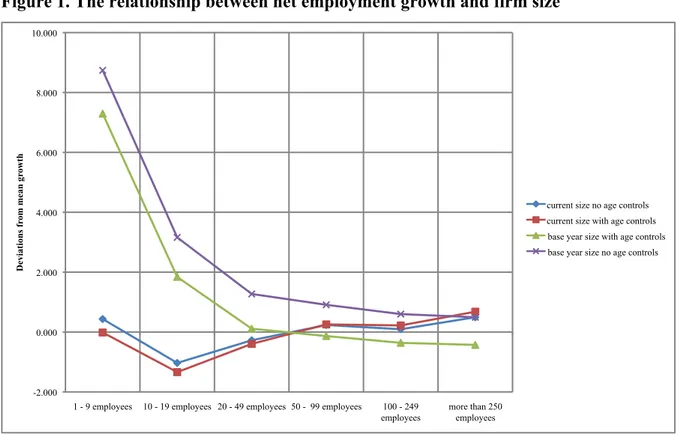
In order to ease the interpretation of the results, Figure 1 and Figure 2 below plot the transformed coefficients for all size and age classes. The numbers on the y-axis represent the (percentage) deviation in the growth performance of each group with respect to the ground mean. Figure 1 reveals that when size classes are built using the base year method growth rates and firm size appear negatively related, thus supporting the enduring notion that small employers create a higher number of jobs than larger counterparts. Adding a control for firm age does not affect the estimated relationship that still endorses the role of small companies. Nonetheless, estimated coefficients for all size classes are lower than obtained without age controls in the regression equation; hence part of the apparent advantages of being small is probably a byproduct of youth rather than sheer size.
However, the results dramatically change when the current year method is used to build size classes. In particular, consistent with empirical evidence for continuing US companies (Haltiwanger et al., 2010), the inverse relationship between growth and size disappears, while age controls do not seem to significantly affect the estimated coefficients.
Figure 1. The relationship between net employment growth and firm size
Since unadjusted coefficients were significantly different from the omitted group, deviations of the transformed coefficients from the grand mean are still statistically significant. This
-2.000 0.000 2.000 4.000 6.000 8.000 10.000
1 - 9 employees 10 - 19 employees 20 - 49 employees 50 - 99 employees 100 - 249
employees more than 250 employees D evi ati on s fr om me an gr ow th
current size no age controls current size with age controls base year size with age controls base year size no age controls
implies that small firms, those occupying between 10 and 49 employees, grow slower than the average enterprise and even slower than the medium-sized enterprises in our sample. Although statistically significant, such differences are meager if compared with both the grand mean – the larger deviation from the mean is 1.4% in absolute terms – and with respect to the parameters estimated using the base year approach. Moreover, if the whole range of size classes is taken into account the more realistic conclusion that one can draw is that growth rates are independent of firm size, as predicted by Gibrat’s law (Sutton, 1997).
To corroborate our results we employed locally-weighted regressions, a non parametric analysis, to investigate the shape of the relationship size-growth. The main advantage of this method is the fact that the results are not dependent from the arbitrary choice of size boundaries we built –that nonetheless, were built consistent with the literature. Hence, we estimate the employment growth rate for every firm size (point estimate) using the non-parametric locally-weighted regression. Note that we use the current measure of size to define and calculate our growth rates given that with this technique we can overtake the distribution fallacy problem but we are still exposed to regression fallacy bias (Newark, 2008). Figure 3 reports the results of the exercise. We plotted average firm size against the estimated mean of net job creation rate measured using current size measure. The figure show that for all size of firms the impact on growth is relationship is close to zero. Put it differently, the relationship between size and growth is flat. These results seem to support previous elaborations and allow us to conclude that there no role of size in shaping net job creation6.
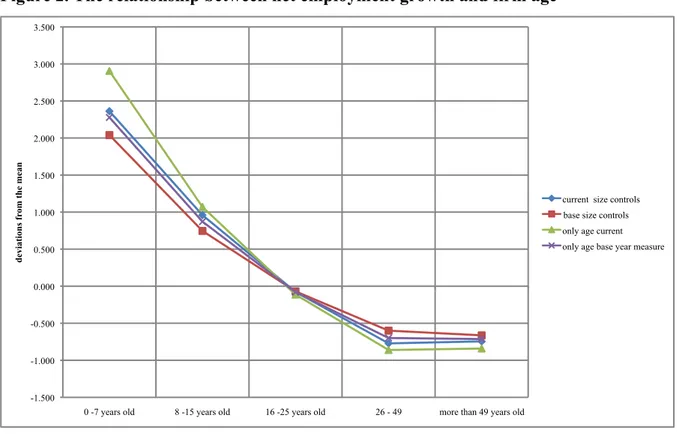
Whereas sheer size do not convey any advantage on small enterprises, age plays a role that is robust across alternative specifications and that reveals that greater ability of new ventures in fostering employment growth. Figure 2 shows that growth rates and age are negatively related over almost all age classes: the inverse relationship vanishes when firms that are between 26 and 49 years old and the oldest ones in the sample are taken into account. Firms that are less than fifteen years old outperform the average enterprise. In particular, firms in the age class 0-7 years achieve growth rates that are about 2.5% higher than the ground mean. Likewise, firms belonging to the age class 8-15 years record growth rates that are 1% higher than the average mean.
Figure 2. The relationship between net employment growth and firm age
Figure 3. Net job creation rate vs. firm size (10% bandwidth).
5. Conclusions
The study analyses job flows for continuing manufacturing firms in Italy from 1996 to 2004 using high quality data on work forces and other characteristics of the firm. The empirical findings can be summarised in four key points. First, the magnitude of the job flows for small
-1 50 -1 00 -5 0 0 50 100 Sm oot hed net em pl oy m ent gr ow th rat e (%) 0 200 400 600 800 1000 Firm size bandwidth = .1 -1.500 -1.000 -0.500 0.000 0.500 1.000 1.500 2.000 2.500 3.000 3.500
0 -7 years old 8 -15 years old 16 -25 years old 26 - 49 more than 49 years old
d evi ati on s fr om th e me an
current size controls base size controls only age current only age base year measure
and medium-sized limited liability companies in Italy is lower than what observed in Anglo-Saxon countries, but it is still in line with evidence for firms in the Euro area. Second, the magnitude of job flows significantly shrunk in the aftermath of the economic downturn in 2001. Firms fared worse than in the late nineties and the labour market became less efficient in allocating job flows. Third, gross job creation and gross job destruction decrease as firm get larger, but when added to compute an indicator of net employment growth, size does not seem to affect firms’ expansion. On the contrary, age significantly hinges on the growth opportunities of small and medium-sized enterprises. The econometric analysis corroborates the major findings of our descriptive investigation referring to the role of size and age. In particular, it shows that classification methods used to define size classes strongly influence the estimated relationship between growth and size. When the current year method is adopted, i.e., a method that properly addresses the temporary shocks in the observed phenomenon, the size-growth relationship becomes flat thus supporting the Gibrat’s conjecture that smaller firms do not enjoy any advantage in grabbing new business opportunities. The econometric analysis also points out that the inverse age-growth relationship is robust across model specifications. If jointly considered these two pieces of evidence corroborate the idea that youth rather than sheer size is the primary engine of firm growth. In accordance with earlier results for the United States (Haltiwanger et al., 2010), we also find that such a notion holds true among continuing manufacturing firms in Italy.
Forth, industrial regimes play a role in shaping job flows. Our result show that firms in supplier dominated industries fared significantly lower than enterprises in other sectors during the sample period. Such an upshot is consistent with the mounting evidence signalling a decline of Italian firms’ competitiveness in these sectors. Fifth, the poor performance of firms in traditional sectors reverberates on the overall performance of companies in the North-western area of the country, that are mainly specialized in those businesses.
References
Angelini P, and A. Generale (2008), On the evolution of firm size distributions. American
Economic Review, 98:426-438.
Armington, C. and Acs, Z. (2004), Job creation and persistence in services and manufacturing, Journal of evolutionary economics 14; 309-325.
Baldwin, J., T. Dunne and J. Haltiwanger (1998), A comparison of job creation and job destruction in Canada and United States, The Review of Economics and Statistics 80 no.3: 347–55.
Barnes, M. and J. Haskel (2002), Job creation, job destruction and the contribution of small businesses: Evidence from UK manufacturing, Working Paper Department of
Economics, Queen Mary University 461.
Becchetti, L. and G. Trovato (2002), The determinants of growth for small and medium sized firms. The role of the availability of external finance. Small Business Economics, 19: 2991-306.
Birch, D. L. (1987), Job creation in America: How our smallest companies put the most
people to work. New York: The Free Press.
Blanchard, O. and P. Diamond (1990), The cyclical behavior of gross flows of workers in the United States. Brooking Papers on Economic Activity 28: 85–155.
Blanchard, O. J. and P. Diamond (1989), The Beveridge curve. Brooking Papers on
Economic Activities 1989 no.1: 1–76.
Bottazzi G, E. Cefis, G. Dosi and A. Secchi (2007), Invariances and diversities in the patterns of industrial evolution: some evidence from Italian manufacturing industries. Small
Business Economics, 29:137-159.
Burda, M. and C. Wyplosz (1994), Gross worker and job flows in Europe. European
Economic Review 38 no.6: 1287–315.
Cefis, E. and R. Gabriele (2009), Spatial disaggregation patterns and structural determinants of job flows: an empirical analysis, International Review of Applied Economics 23: 89-111.
Contini, B. and R. Revelli (1997), Gross flows vs. net flows in the labor market: What is there to be learned? Labour Economics 4: 245-263.
Contini, B., F. Cornaglia and C. Malpede (2002), Creazione e distruzione di posti di lavoro, in B. Contini (ed.), Osservatorio sulla mobilità del lavoro in Italia, pp. 89-110, Bologna: Il Mulino.
Davis, S. J. and J. C. Haltiwanger (1999), Gross job flows. In Handbook of labor economics
vol.3b, ed. O. C. Ashenfelter and R. Layard, 2711–805. Amsterdam: North Holland.
Davis, S. J., J. C. Haltiwanger and S. Schuh (1996), Job Creation and Destruction, Cambridge. MA: MIT Press.
Dosi, G., O. Marsili, L. Orsenigo and R. Salvatori (1995), Learning, market selection and the evolution of market structure. Small Business Economics 7: 411–36.
Dunne, P. and A. Hughes (1994), Age, growth, size and survival: UK companies in the 1980s. The Journal of Industrial Economics 42: 115-140.
Evans, D. S. (1987), The Relationship between Firm Growth, Size, and Age: Estimates for 100 Manufacturing Industries), Journal of Industrial Economics 35: 567-581.
Fagiolo G, Luzzi A (2006), Do liquidity constraints matter in explaining ¯rm size and growth? some evidence from the Italian manufacturing firms. Industrial and Corporate
Change, 15:1-39.
Gomez-Salvador, R., G. Messina and G. Vallanti (2004), Goss job flows and institutions in Europe, Labour Economics 11: 469-485.
Haltiwanger, J. C., R. S. Jarmin and J. Miranda (2010), Who creates jobs? Small vs. large vs. young. NBER Working Paper Series, n. 16300.
Hijzen, A., R. Upward and P. W. Wright (2010), Job creation, job destruction and the role of small firms: firm level evidence for the UK, Oxford Bulletin of Economics and
Statistics 72: 621-647.
Hirschberg, J. and J. Lye (2001), The interpretation of multiple dummy variable coefficients: an application to industry effects in wage equations, Applied Economics Letters 8: 701- 707.
Morgan, J. (1964), A note on the interpretation of multiple regression using dummy variables, Survey Research Center, Institute for Social Research, University of
Michigan, April 28, 2-3.
Neumark, D., B. Wall and J. Zhang (2008), Do small businesses create more jobs? New evidence from the national establishment time series. NBER Working Paper Series, n. 13818.
Olley, A. and A. Pakes (1992), The dynamics of productivity in the telecommunications equipment industry. Economic studies 92 no.2: 538–54.
Pavitt, K. (1984), Sectoral patterns of innovation: towards a taxonomy and a theory, Research
Policy 13: 343-373.
Pissarides, C. A. (2000), Equilibrium Unemployment Theory. Oxford: Blackwell. Sutton, J. (1997), Gibrat's legacy. Journal of Economic Literature, 35:40-59.
Sweeney, R. and Ulveling, E. (1972), A transformation for simplifying the interpretation of coefficients of binary variables in regression analysis, The American Statistician 26: 30-32.