Ata Joodavi
a,b, Azizallah Izady
b,c, Mohammad Taghi Karbasi Maroof
d,
Maysam Majidi
a,e, Rudy Rossetto
f,*
aDepartment of Water Engineering, Kashmar Higher Education Institute, Kashmar, Iran
bDepartment of Hydroinformatics, East Water and Environmental Research Institute (EWERI), Mashhad, Iran cWater Research Center, Sultan Qaboos University, Muscat, Oman
dDepartment of Geology, Faculty of Earth Sciences, Shahid Beheshti University, Tehran, Iran
eDepartment of Remote Sensing and Environmental Science, East Water and Environmental Research Institute (EWERI), Mashhad, Iran fInstitute of Life Sciences, Scuola Superiore Sant’Anna, Pisa, Italy
A R T I C L E I N F O
Keywords:
Conjunctive use of surface water and groundwater
Reservoir management optimization model Surface water-groundwater interactions Groundwaterflow numerical modelling MODFLOW
Managed aquifer recharge Water resources management
A B S T R A C T
Study region: The off-stream artificial Bar lake, built in 2015 to store the flood flows of the Bar river for domestic and industrial needs and with the objective to intentionally recharge the aquifer, is situated in the Razavi Khorasan province (Iran).
Study focus: We present a methodology, based on the combination of a MODFLOW groundwater flow model for estimating seepage rates, and an optimization model, for the management and operation of an artificial reservoir considering surface/groundwater interactions for satisfying 12 Mm3/year of water demand. We simulated the reliable amount of water that can be supplied from the reservoir, considering reservoir seepage, maximizing water supply yields subject to the water supply reliability requirements, and the additional intentional volume of groundwater recharge.
New hydrological insights for the region: Our results demonstrate the reliability of conjunctive use of surface-and ground-water in water scarce areas by exploiting reservoir infrastructures with relevant leakage losses, also for creating additional aquifer storage. In such systems, man-induced changes of lake stages can significantly affect the volume of water that seeps through the lakebed. The aquifer, under managed aquifer recharge operations, may then provide the resource not satisfied by the reservoir release, fulfilling 100 % reliability of water supply. The conjunctive use of surface- and ground-water, by improving water security, may open new sustainability views for leaking reservoirs, even if they were not initially designed for increasing aquifer recharge, in many areas worldwide.
1. Introduction
In water scarce/arid areas, optimizing the use of different sources of water is beneficial to the various user sectors and for
https://doi.org/10.1016/j.ejrh.2020.100725
Received 2 June 2020; Received in revised form 2 August 2020; Accepted 3 August 2020 ⁎Corresponding author.
E-mail addresses:[email protected](A. Joodavi),[email protected](A. Izady),[email protected](M.T. Karbasi Maroof), [email protected](M. Majidi),[email protected](R. Rossetto).
2214-5818/ © 2020 The Authors. Published by Elsevier B.V. This is an open access article under the CC BY license (http://creativecommons.org/licenses/BY/4.0/).
an operational framework and to fully demonstrate the concept of conjunctive use of surface water and groundwater.
To this aim, optimization techniques are powerful tools for managing and operating complex water resources systems (Labadie, 2004;Jothiprakash et al., 2011;Ahmad et al., 2014). At the same time groundwaterflow numerical modelling provides reliable approaches for estimating surface/groundwater interactions (Genereux and Bandopadhyay, 2001;Hunt et al., 2003;Mylopoulos et al., 2007;Yihdego and Becht, 2013;El-Zehairy et al., 2017andCannata et al., 2018). The combined use of optimization tools and numerical models may allow to optimize release from the reservoir including the surface water/groundwater component (to evaluate infiltration through the lake bed).
For managing a reservoir with high amount of seepage, the model simulating surface water/groundwater interactions may then be embedded into the optimization model. In real cases, however, embedding numerical models directly into the optimization model is complex and causing high computational cost (Joodavi et al., 2017; Razavi et al., 2012;Castelletti et al., 2012). Therefore, regression models and artificial neural networks may be used as a surrogate for the computationally expensive embedded method (Pan et al., 2016;Chen et al., 2017,2018).
In this paper, we present a methodology, based on the combination of numerical groundwaterflow simulations and reservoir operation optimization models: we developed an optimization model for the management of the off-stream Bar reservoir operation (Iran), including lakebed seepage and random inflow to the reservoir, in order to satisfy water demand for a total amount of 12 Mm3/ year for drinking and industrial purposes In this method, the reliability of releases from the reservoir is also considered.
2. Materials and methods
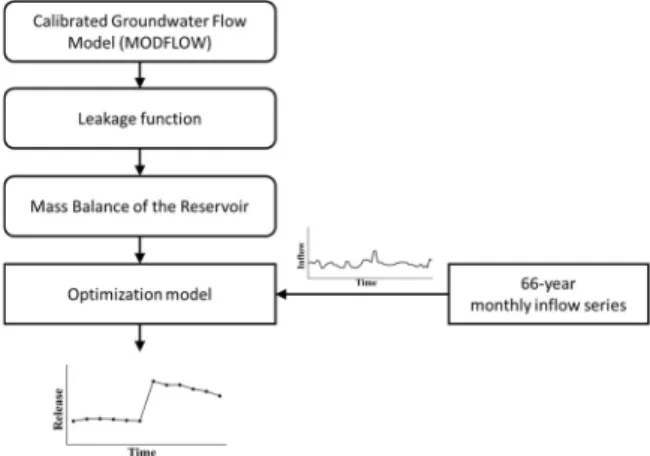
Three major steps were undertaken to complete the study (Fig. 1): (i) detailed hydrogeological characterization of the study area, (ii) the development of a numerical groundwaterflow model, and (iii) the development and application of an optimization model for the management of the Bar reservoir operation (including the seepage from Bar reservoir to the underlying alluvial aquifer). The calibrated groundwaterflow model (run for 2017–2018 period) was used to obtain a leakage function that was then embedded to the reservoir mass balance equation in the optimization model. As the proposed optimization model is nonlinear and nonconvex, a genetic algorithm (GA) is used to solve this optimization model. The optimization model was then run for 66 years on monthly basis to derive optimal water supply considering the reservoir release and groundwater withdrawal.
2.1. Study area
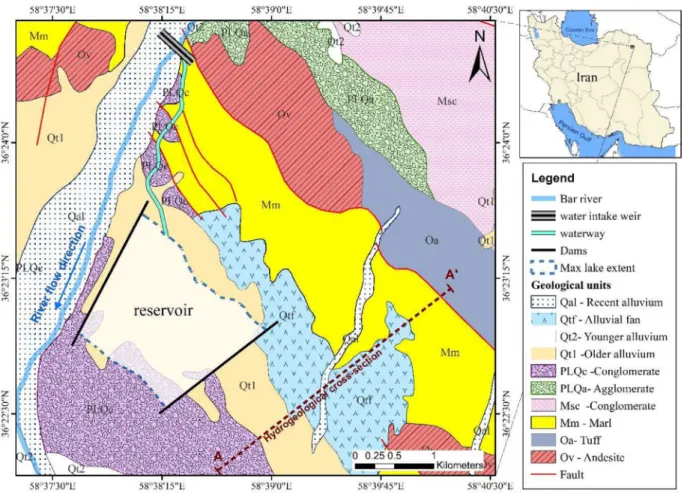
The off-stream artificial Bar lake is situated in the Razavi Khorasan province in Iran, about 23 Km north west of Neishaboor City
(Fig. 2). The reservoir was built in 2015 to store theflood flows of the Bar river for water supply for domestic and industrial needs and with the secondary objective to intentionally recharge the aquifer (Abpooy consulting engineers company, 2019). The advantage of the off-stream design of the Bar artificial reservoir is that it prevents the problem of storage loss due to sedimentation associated with in-stream surface water storage (Pan et al., 2016).
The scheme includes a reservoir area created by two dams located on an alluvial unconfined aquifer, a water intake weir, a waterway that connects the water intake to the reservoir, and spillways and other outlets (Fig. 2). Average annualflow of the river at the water intake weir is about 20 Mm3, while the capacity of the reservoir is about 23.5 Mm3, and the maximum reservoir area is about 2 km2.
Daily historical records for the riverflow and climatic data, e.g. precipitation, pan evaporation, and air temperature are available for the area from 1953 to 2018. The mean annual temperature, evaporation and precipitation at the Bar reservoir are 12.8 °C, 1370 mm and 233 mm, respectively, for this period (Abpooy consulting engineers company, 2019).Table 1presents average monthly rainfall data for the period 1953–2018.Fig. 3shows the monthly aggregated inflow and precipitation data.Fig. 4shows statistics of 66-year monthly inflow time-series from 1953 to 2018. Because of the semiarid climate of the study area, river flows available for diversion to the reservoir vary seasonally and annually. Maximum monthly river discharge occurs between March and June, peaking in April (ranging from 0 to 28.4 Mm3/month in different years;Fig. 4a/b). These months anyway show also the largest variability in discharge values (Fig. 4c). Droughts and extended periods of lowflows (Fig. 4d) caused serious water shortages in the basin, forcing the local water management authority to build the Bar reservoir and to develop a plan for installing groundwater pumping facilities. This conjunctive water use strategy requires coordination between reservoir releases and groundwater withdrawals in order to minimize the slacks in water supply, especially in dry periods.
Fig. 2. Location and geologic map of the study area.
Table 1
Average monthly rainfall data for the period 1953-2018.
Oct. Nov. Dec. Jan. Feb. Mar. Apr. May June July Aug. Sep.
2.2. Hydrogeological setting and conceptual model
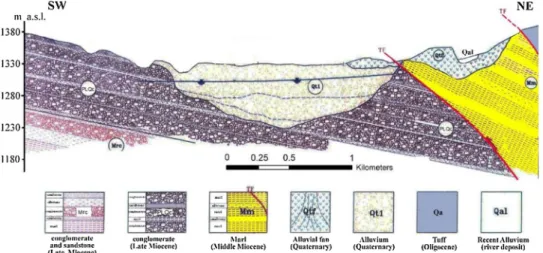
Thirty-two boreholes, permeability tests, hydrogeological information and geophysical investigations provide information on aquifer lithology, thickness and hydraulic conductivities. Based on such data, the groundwaterflow system of the study area can be conceptualized as a one-layer unconfined alluvial aquifer, whose thickness ranges from 1 to 100 m (Fig. 5). The unconfined aquifer was formed in a buried valley and it is composed mainly offine, medium, and coarse sand, and a little clay and loam in the central area of the valley (beneath the lake, Qt1 inFig. 2). Apart from the central area of the reservoir, the percentage of clay in the aquifer material (Qt1) increased and the sediments are composed of loam with some sandy clay, clay, and argillaceous material. The hy-draulic conductivities of the aquifer range from 0.1 m/day in the south-western area of the lake up to 8 m/day beneath the lake. The aquifer is bounded by impervious marl and conglomerate layers (Mm and PLOc inFig. 5) in the north-eastern area of the lake, whereas the conglomerate layers in the south-western area are moderately weathered and semi-permeable.
Groundwater level data are available from 26 observation wells located around the lake (Fig. 6). The main groundwaterflow direction is from north-east to south-west. As said, the reservoir bed is covered by silt with a fraction of clay materials, but still sufficiently permeable to hydraulically link the reservoir to the alluvial aquifer.
The data show the variability of the lake stage affects the groundwater flow system by causing a general groundwater head increase in the system (Fig. 7). At high stages, the lake induces seepage into the groundwater system causing the water table to rise. Hence, the water level of the reservoir is always higher than the water table (Fig. 7) in the surround, and it is unlikely that groundwater discharges into the lake. Because of the spatio-temporal lakebed-seepage pattern, a function of water level in the reservoir and hydraulic properties of the lakebed and the aquifer materials, optimal management of the reservoir considering water demand requires taking into account the aquifer recharge rate.
Fig. 3. Monthly inflow and rainfall data distribution for Bar reservoir (1953–2018; MCM = 106m3).
Fig. 4. Descriptive statistics for the 66-year time-series for Bar river. a) box plot for monthly inflow; b) mean monthly inflow; c) standard deviation; d) percentage of zeroflows.
Fig. 5. Geological cross section parallel to the second dam (section A–A′ inFig. 2; modified afterAbpooy consulting engineers company, 2004). (a.s.l.: above sea level).
Fig. 6. Interpolated groundwater level (GWL) contours in the alluvial aquifer (a) minimum GWL on 14 February 2017; (b) maximum GWL on 28 August 2017.
2.3. Groundwaterflow simulation model setup and calibration
We analyzed the lake-aquifer interactions implementing a groundwaterflow numerical model by means of the FREEWAT soft-ware (Rossetto et al., 2015; De Filippis et al., 2017; Foglia et al., 2018;) using the MODFLOW-2005 code (Harbaugh, 2005). FREEWAT is a free and open source platform, QGIS-integrated, for planning and management of ground- and surface-water resources. FREEWAT provides tools for archiving, analyzing and processing the groundwater data and information (e.g., sensor andfield data on groundwater levels and hydrochemical data;Criollo et al., 2019;Cannata et al., 2018) along with post-processing tools for visua-lization and analysis of the model results. MODFLOW is one of the widest used model in the world for numerical simulation of groundwaterflow in aquifers. It solves the groundwater flow equation in three dimensions using a finite difference scheme. The FREEWAT software has been applied at several case studies; details may be found in, i.e.,De Filippis et al., 2020;Perdikaki et al., 2020.
Data for a 328-day period (14 February 2017 to 7 January 2018), including inflow to the reservoir, precipitation, evaporation, water level in the reservoir and groundwater levels were used. The reservoir was almost empty at the beginning of the investigated period. In this condition the unsaturated zone is 15 m thick.
The active modelling domain includes 669 cells with a resolution of 75 × 75 m (Fig. 8) and it covers an area of 3.76 Km2. As far as boundary conditions, the marl outcrops on the north-eastern side of the lake was considered as no-flow boundary. In order to represent the interactions of the modelling domain with the external area, a specified head boundary was assigned along the other boundaries of the active domain. The specified head data was obtained from the observation wells located around the lake (Fig. 8). No-flow boundary was also set at the bottom of the aquifer. Water exchange between the lake (reservoir) and the aquifer was simulated using the MODFLOW River (RIV) Package. This package requires information on head-stage, the elevation of the lake bottom, the vertical hydraulic conductivity and thickness of the lake bed material, as well as the areal extension of the lake bed. From these data, a conductance value is obtained. As many of the above-mentioned information are not easy to gather via experimental means, the optimum value of the conductance was estimated during the calibration process.
The simulation covers the period between 14 February 2017 to 7 January 2018, divided in 328 daily transient stress periods. The groundwaterflow model calibration was accomplished using a combined trial and error and automated parameter estimation (using the PEST code;Doherty, 2016) approach (La Vigna et al., 2016).
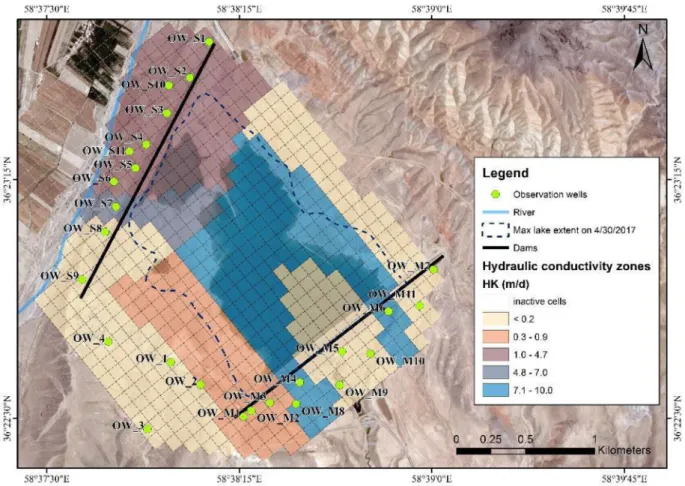
Groundwater head levels in 26 observation wells were used as calibration targets. Model-input parameters, in particular hydraulic Fig. 8. Model grid and boundary conditions of the study area.
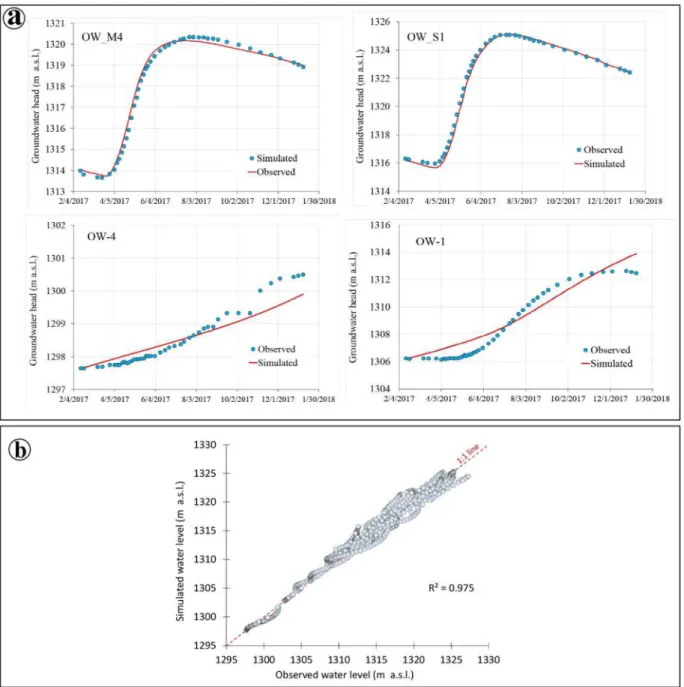
conductivity, specific yield, and the conductance of the lake bed material, were varied within reasonable data-based ranges to produce the bestfit between simulated and observed hydraulic heads in the aquifer. The calibrated distribution of hydraulic con-ductivity is presented inFig. 9, while the time series of observed vs. simulated values is shown inFig. 10a at selected observation wells, and the scatter diagram inFig. 10b.
Final root mean square error (RMSE) was 1.2 m. Moreover, the Nashe-Sutcliffe coefficient of efficiency (NS), which can be used to compare individual simulated to observed hydrographs, was 0.97 for the calibrated groundwaterflow model (NS ranges from -∞ to 1; values close to 1 indicate a goodfit;Anderson et al., 2015). Considering the number of head measurements and the reservoir-water budget analysis (hard data), and the geological and hydrologic information at the site analysis (soft knowledge), the model per-formance and the calibration result are acceptable for the objective of this study.
2.4. Reservoir management model
The optimization model is developed for optimal operation of the reservoir. The optimal operation objective is to minimize the value z of a mathematical objective function (Eq. 1) that expresses the differences between optimal release from the reservoir (Rt) and
total demand during time period t (TDt) subject to constraints on availability of water and other inputs.
∑
= − = z TD R min ( ) t T t t 1 2 (1) 2.4.1. Constraints Mass balance equation:Based on conservation of mass throughout the system, the mass balance in the reservoir from one time step to another time step is given by the continuity equation. The continuity equation (Eq. 2) is stated as:
= − + + − − − − −
St St 1 It Pt Et L S( t 1) Rt Spillt (2)
where,St=final storage at the time t,It= inflow during the time t,Pt = precipitation over the lake during the time t, Et =
evaporation loss in the reservoir during time t,L S( t−1)= leakage loss in the reservoir during time t as a function ofSt−1(leakage
function obtained from the calibrated groundwaterflow model), and Spillt = surplus from the reservoir during time t.
Release constraints:
The optimal release from the reservoir (Rt) should be less than or equal to the total demand at time t (TDt). This constraint is given
by:
≤R ≤TD
0 t t (3)
Water supply (releases) reliability constraints:
These are defined in order to take into account water shortage periods, that is, periods during which optimal release is not satisfied due to the uncertainty associated with available reservoir inflow (streamflow diversion). The water supply reliability constraint is defined as follows:
≥
αt Ψ (4)
= > − + + − − − <
αt [number of periodstsuch thatoptimalRt St 1 It Pt Et L S( t 1)orSt S ]/n
max (5)
whereαtis supply reliability, n is the total number of time steps and Ψ is the reliability level which is chosen by decision makers. Fig. 10. Model calibration results.
whereSmax = capacity of the reservoir in million cubic meters (Mm3).
In order to evaluate monthly water supply reliability with respect to“optimal release” in medium-term operation, 66 years of data including monthly reservoir inflow, precipitation, and evaporation data and main characteristics of Bar reservoir were used. The input parameters and data for the reservoir management model have been derived from a technical report drafted by theAbpooy consulting engineers company (2019).
The total demand in different months of a year is given inTable 2. Minimum and maximum storage were set to 0 and 23.5 Mm3 respectively and the initial storage volume was set to 6 Mm3. The total demand for each month was considered constant in all years during the analyzed period. The reliability in each month was then defined as the number of periods the reservoir release satisfies the optimal release. The reliability level was set to 85 % in each month. This value was decided by the decision makers (Abpooy consulting engineers company, 2019).
2.5. Optimization using genetic algorithm (GA)
In the present study, all the optimization processes are performed using a GA model in the MATLAB® environment (MATLAB and Statistics Toolbox Release, 2016). Numerous applications of GAs can be found in water resources planning and management lit-erature (e.g.,Wu et al., 2007;Guan et al., 2008;Dariane and Momtahen, 2009;Joodavi et al., 2015;Sepahvand et al., 2019;Adeyeri et al., 2020).
In order tofind the optimal solution to the problem (Eq. 1), first, the constrained model is transformed to an unconstrained problem using penalty functions. In this method, constrains of the model are embedded into the objective function in order to penalize the solutions that violate the constraints (infeasible solutions). The decision variables for the management model are re-presented by coded structures. In the GA model, the real coding is used due to its suitability for constrained optimization (Michalewicz, 1994;Wardlaw and Sharif, 1999). Each solution is identified as a chromosome that consists of 12 genes for monthly optimal releases. Moreover, a combination of the tournament selection and the truncation operators is used as selection operator and the Arithmetic crossover is chosen for the crossover process. Moreover, the Gaussian mutation, the most common Mutation operator (Nicklow et al., 2010), is applied to the GA model. The population size, crossover and mutation probabilities are set equal to 1000, 0.80, and 0.03, respectively. These values were chosen following a trial and error process.
3. Results and discussion
The analyses performed provided the total seepage volume from the reservoir to the aquifer for the simulated period. The simulated seepage calculated by the MODFLOW model was 5.77 MCM for the entire period, value close to the one estimated from the lake’s volumetric budget for the same period (5.5 MCM;Abpooy consulting engineers company, 2019).
The groundwaterflow calibrated model results were used for predicting daily seepage from the reservoir into the aquifer (leakage loss) as a function of water levels in the reservoir. The derived polynomial function is shown inFig. 11; after the value of 1335, the water level in the reservoir causes a nearly linear increase of the seepage rate. Then, the leakage function (L(St−1)) in Eq.2was embedded to the reservoir mass balance equation in the optimization model.
Table 2shows optimal water releases for Bar reservoir obtained by the optimization model, along with monthly cumulated seepage and monthly demand. The water supply reliability with regard to optimal release is always equal or above 0.85, guaranteeing the required supply for which the reservoir was designed.
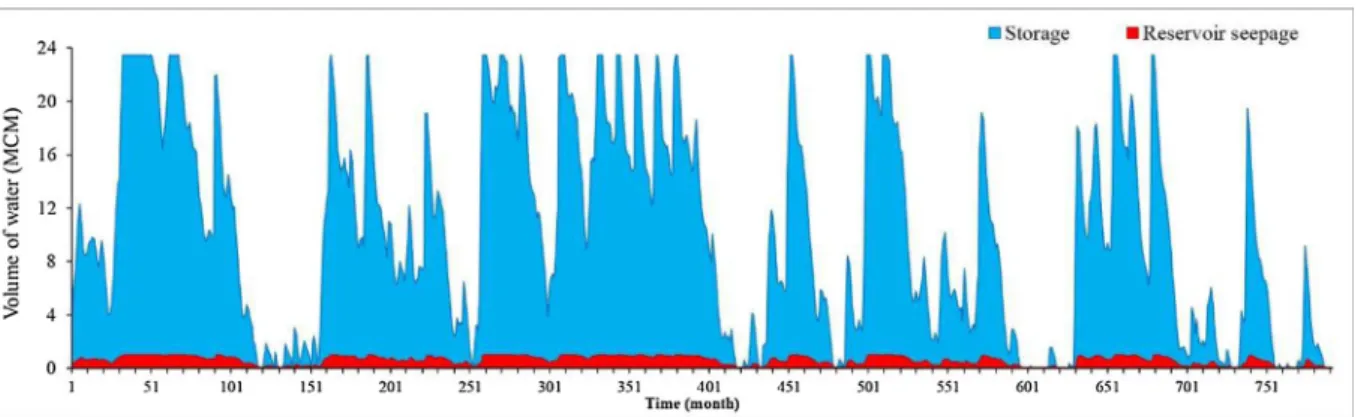
Fig. 12displays monthly storage volume and lakebed seepage related to the optimal water releases for the whole 66-year time series. In relation to the average annual water balance (Fig. 13), 52 % of inflow to the reservoir is seepage water that can be stored in the aquifer, while 40 % of the inflow can be released from the reservoir. The water balance is slightly negative because of the reservoir storage changes, which is allowed in the medium-term operations (Zhang and Ponnambalam, 2006). Moreover, our results show that the distance between the demand and optimal release could be largely supplied by recovering via pumping wells the additional recharge of the aquifer provided by the seepage. In only three months, July, August, and September, the demand is not
fully satisfied for a small volume by the monthly water availability provided by the joint surface and groundwater scheme. The missing amount (about 0.5 Mm3; Table 2) may be withdrawn from the local aquifer without causing groundwater quantity and quality degradation: In fact, in the other months, recharge (seepage) is greater than pumping, being the total estimated seepage calculated by the optimization model 7.26 Mm3, while the needed groundwater withdrawal all in all is worth 6.3 Mm3. This analysis suggests that the risk of failure of managed aquifer recharge facilities is a very relevant step in design of water infrastructures and it should be well addressed at initial stage of planning (Rodríguez-Escales et al., 2018). Finally,Fig. 14shows the long-term monthly average reservoir allocation and groundwater pumping needs to fulfil water demand in conjunctive use operation.Fig. 14also shows the predicted monthly seepage. A time delay is predicted between the maximum diverted inflow and maximum expected seepage. This delay in recharge makes groundwater a reliable and slowly depleting resource, while the available surface water in the reservoir is diminishing at a faster rate.
Fig. 11. Relationship between leakage loss and the water level in Bar reservoir.
Fig. 12. Monthly storage volume and reservoir (lakebed) seepage of Bar reservoir for the optimal solution.
4. Conclusions
We presented a methodology based on modelling solutions for optimizing the Bar off-stream man-made reservoir operations, considering seepage losses to the aquifer, to ensure that water demand is satisfied and all planned reservoir objectives are met. In our analysis, the integration of well-known methods such as numerical groundwaterflow modelling and optimization models provided information on the reliability of the supply of a pre-defined optimal release, and also on the monthly volume of additional intentional groundwater recharge. Based on our calculations, the water demand may then be satisfied by the reservoir release in conjunction with groundwater withdrawal of the increased recharge. In only three months the whole water infrastructure (surface water reservoir and managed aquifer recharge) is not theoretically able to fulfill the demand considering the on-time recharged volume. In that case, the missing part of the demand will have to be covered by the volume previously recharged, exploiting the water banking capacity in the aquifer of a managed aquifer recharge scheme. The modelling method proposed in this study can be adapted to any artificial lake system to enhance its operation, planning and management, as it can provide accurate assessment of the effects of operational releases on lakebed seepage.
With this paper, we aim at pointing out the importance for potential conjunctive use of surface- and ground-water in water scarce areas by exploiting reservoir infrastructures, where the leakage losses are relevant, also for creating additional aquifer storage. In such systems, man-induced changes of lake stages, mainly dependent on temporally variable balance between inflow and regulated outflow, can significantly affect the volume of water that seeps through the basin floor. The infiltrated water constitutes an additional storage volume reliable for coping with the demand or for water banking purposes. The aquifer, under managed aquifer recharge operations, may then provide the resource not satisfied by the reservoir release, hence fulfilling 100 % reliability of water supply. Finally, the potential conjunctive use of surface water and groundwater by improving water security, may open new sustainability views for leaking reservoirs, even if they were not initially designed for increasing aquifer recharge, in many areas worldwide.
CRediT authorship contribution statement
Ata Joodavi: Methodology, Formal analysis, Visualization, Writing original draft. Azizallah Izady: Formal analysis, Writing -review & editing.Mohammad Taghi Karbasi Maroof: Investigation, Formal analysis. Maysam Majidi: Conceptualization, Formal analysis, Supervision.Rudy Rossetto: Conceptualization, Methodology, Writing - review & editing.
Declaration of Competing Interest
The authors declare that they have no known competingfinancial interests or personal relationships that could have appeared to influence the work reported in this paper.
Acknowledgement
The open access fee for this paper was provided by the Institute of Life Sciences, Scuola Superiore Sant’Anna. The Authors wish to acknowledge the support of three anonymous reviewers who helped in providing relevant suggestions for the improvement of the first version of this paper.
Appendix A. Supplementary data
Supplementary material related to this article can be found, in the online version, at doi:https://doi.org/10.1016/j.ejrh.2020. 100725.
544, 591–603.https://doi.org/10.1016/j.jhydrol.2016.12.011.
Chen, M., Izady, A., Abdalla, O.A., Amerjeed, M., 2018. A surrogate-based sensitivity quantification and Bayesian inversion of a regional groundwater flow model. J. Hydrol. (Amst) 557, 826–837.
Criollo, R., Velasco, V., Nardi, A., Vries, L.M., Riera, C., Scheiber, L., Jurado, A., Brouyère, S., Pujades, E., Rossetto, R., Vázquez-Suñé, E., 2019. AkvaGIS: an open source tool for water quantity and quality management. Comput. Geosci. 127, 123–132.https://doi.org/10.1016/j.cageo.2018.10.012.
Dariane, A., Momtahen, S., 2009. Optimization of multireservoir systems operation using modified direct search genetic algorithm. J. Water Resour. Plann. Manage. 135, 141–148.
De Filippis, G., Borsi, I., Foglia, L., Cannata, M., Velasco Mansilla, V., Vasquez-Suñe, E., Ghetta, M., Rossetto, R., 2017. Software tools for sustainable water resources management: the GIS-integrated FREEWAT platform. Rend. Online Soc. Geol. It. 42, 59–61.https://doi.org/10.3301/ROL.2017.14.
De Filippis, G., Pouliaris, C., Kahuda, D., Vasile, T.A., Manea, V.A., Zaun, F., Panteleit, B., Dadaser-Celik, F., Positano, P., Nannucci, M.S., Grodzynskyi, M., Marandi, A., Sapiano, M., Kopač, I., Kallioras, A., Cannata, M., Filiali-Meknassi, Y., Foglia, L., Borsi, I., Rossetto, R., 2020. Spatial data management and numerical modelling: demonstrating the application of the QGIS-Integrated FREEWAT platform at 13 case studies for tackling groundwater resource management. Water 12, 41.https:// doi.org/10.3390/w12010041.
Dillon, P., Stuyfzand, P., Grischek, T., et al., 2019. Sixty years of global progress in managed aquifer recharge. Hydrogeol. J. 27, 1–30.https://doi.org/10.1007/ s10040-018-1841-z.
Dogrul, E.C., Kadir, T.N., Brush, C.F., Chung, F.I., 2016. Linking groundwater simulation and reservoir system analysis models: the case for California’s central Valley Environ. Environ. Model. Softw. 77, 168–182.https://doi.org/10.1016/j.envsoft.2015.12.006.
Doherty, J., 2016. PEST, Model-Independent Parameter Estimation, User Manual Part I, 6th ed. Watermark Numerical Computing., Brisbane, Australia.
El-Zehairy, A.A., Lubczynski, M.W., Gurwin, J., 2017. Interactions of artificial lakes with groundwater applying an integrated MODFLOW solution. Hydrogeol. J. 26 (1), 109–132.https://doi.org/10.1007/s10040-017-1641-x.
FAO, 1995. Land and water integration and river basin management. In: Proceedings of an FAO Informal Workshop. Rome, Italy 31 January - 2 February, 1993. ISBN 92-5-103655-1.
Feinstein, D., 2012. Since“groundwater and surface water–a single resource”: some U.S. Geological survey advances in modeling groundwater/surface-water in-teractions. Italian Journal of Groundwater 1 (1).https://doi.org/10.7343/as-001-12-0001.2012.
Foglia, Laura, Borsi, Iacopo, Mehl, Steffen, De, Filippis, 2018. Giovanna; Cannata, Massimiliano; Vasquez-Sune, Enric; Criollo, Rotman; Rossetto, Rudy. FREEWAT, a free and open source, GIS-Integrated, hydrological modeling platform. GROUNDWATER 56 (4), 521–523.https://doi.org/10.1111/gwat.12654.
Genereux, D., Bandopadhyay, I., 2001. Numerical investigation of lake bed seepage patterns: effects of porous medium and lake properties. J. Hydrol. (Amst). 241 (3–4), 286–303.https://doi.org/10.1016/S0022-1694(00)00380-2.
Ghobadi, M.H., Khanlari, G.R., Djalaly, H., 2005. Seepage problems in the right abutment of the Shahid Abbaspour dam, southern Iran. Eng. Geol. 82 (212), 119–126. https://doi.org/10.1016/j.enggeo.2005.09.002.
Guan, J., Kentel, E., Aral, M., 2008. Genetic algorithm for constrained optimization models and its application in groundwater resources management. J. Water Resour. Plann. Manage. 134, 64–72.
Harbaugh, A.W., 2005. MODFLOW-2005, The U.S. Geological Survey Modular Ground-water Model– the Ground-water Flow Process. Techniques and Methods 6-A16. U.S. Geological Surveyhttps://doi.org/10.3133/tm6A16.
Hunt, R.J., Haitjema, H.M., Krohelski, J.T., Feinstein, D.T., 2003. Simulating ground water lake interactions: approaches and insights. Groundwater 41 (2), 227–237. Iwanaga, T., Partington, D., Ticehurst, J., Croke, B.F.W., Jakeman, A.J., 2020. A socio-environmental model for exploring sustainable water management futures:
participatory and collaborative modelling in the Lower Campaspe catchment. J. Hydrol. Reg. Stud. 28 (April 2020), 10066.https://doi.org/10.1016/j.ejrh.2020. 100669.
Joodavi, A., Zare, M., Mahootchi, M., 2015. Development and application of a stochastic optimization model for groundwater management: crop pattern and con-junctive use consideration. Stochastic Environ. Res. Risk Assessment J. 29 (6), 1637–1648.https://doi.org/10.1007/s00477-015-1049-x.
Joodavi, A., Zare, M., Ziaei, A.N., Ferré, T.P.A., 2017. Groundwater management under uncertainty using a stochastic multi-cell model. J. Hydrol. (Amst) 551, 265–277.https://doi.org/10.1016/j.jhydrol.2017.06.003.
Jothiprakash, V., Shanthi, G., Arunkumar, R., 2011. Development of operational policy for a multi-reservoir system in India using genetic algorithm. Water Resour. Manage. 25 (10), 2405–2423.https://doi.org/10.1007/s11269-011-9815-0.
La Vigna, F., Hill, M.C., Rossetto, R., Mazza, R., 2016. Parameterization, sensitivity analysis, and inversion: an investigation using groundwater modeling of the surface-mined Tivoli-Guidonia basin (Metropolitan City of Rome, Italy). Hydrogeol. J. 24, 1423–1441.https://doi.org/10.1007/s10040-016-1393-z. Labadie, J.W., 2004. Optimal operation of multireservoir systems: state-of-the-art review. J. Water Resour. Plan. Manag. 130, 93–111.https://doi.org/10.1061/
(ASCE)0733-9496(2004)130:2(93).
MATLAB and Statistics Toolbox Release 2016. The MathWorks, Inc., Natick, Massachusetts, United States. Michalewicz, Z., 1994. Genetic Algorithms + Data Structures = Evolution Programs, 2nd ed. Springer, New York.
Mylopoulos, N., Mylopoulos, Y., Tolikas, D., Veranis, N., 2007. Groundwater modeling and management in a complex lake-aquifer system. Water Resour. Manage. 21 (2), 469–494.https://doi.org/10.1007/s11269-006-9025-3.
Nicklow, J., Reed, P., Savic, D., Dessalegne, T., et al., 2010. State of the art for genetic algorithms and beyond in water resources planning and management. J, Water Resour. Plann. Manage. 136, 412–432.
Pan, C.C., Chen, Y.W., Chang, L.C., Huang, C.W., 2016. Developing a conjunctive use optimization model for allocating surface and subsurface water in an off-stream artificial lake system. Water 8 (8), 315.
Perdikaki, M., Manjarrez, R.C., Pouliaris, C., Rossetto, R., Kallioras, A., 2020. Free and open-source GIS-integrated hydrogeological analysis tool: an application for coastal aquifer systems. Environ. Earth Sci. 79 (14, 1 July), 348.
Razavi, S., Tolson, B.A., Burn, D.H., 2012. Review of surrogate modeling in water resources. Water Resour. Res. 48, 7.https://doi.org/10.1029/2011WR011527. Rodríguez-Escales, P., Canelles, A., Sanchez-Vila, X., Folch, A., Kurtzman, D., Rossetto, R., Fernández-Escalante, E., Lobo-Ferreira, J.P., Sapiano, M., San-Sebastián, J.,
et al., 2018. A risk assessment methodology to evaluate the risk failure of managed aquifer recharge in the Mediterranean Basin. Hydrol. Earth Syst. Sci. Discuss. 2018 (22), 3213–3227.https://doi.org/10.5194/hess-22-3213-2018.