ORIGINAL
ARTICLE
Impaired Activation of CA3 Pyramidal Neurons
in the Epileptic Hippocampus
Giuseppe Biagini,
1Giovanna D’Arcangelo,
2Enrica Baldelli,
1Margherita D’Antuono,
3Virginia Tancredi,
2and Massimo Avoli*
,3,4 1Dipartimento di Scienze Biomediche, Università di Modena e Reggio Emilia, 41100 Modena, Italy;2Dipartimento di Neuroscienze, Università di Roma ‘Tor Vergata,’ 00173 Roma, Italy; 3Montreal
Neurological Institute and Department of Neurology and Neurosurgery, McGill University, Montreal, QC, H3A 2B4, Canada; and 4Dipartimento di Fisiologia Umana e Farmacologia ‘V. Erspamer,’
Università di Roma ‘La Sapienza,’ 00185 Roma, Italy
Received June 6, 2005; Revised September 6, 2005; Accepted September 28, 2005
Abstr
act
We employed in vitro and ex vivo imaging tools to characterize the function of limbic neuron networks in pilocarpine-treated and age-matched, nonepileptic control (NEC) rats. Pilocarpine-treated animals represent an established model of mesial temporal lobe epilepsy. Intrinsic optical signal (IOS) analysis of hippocampal–entorhinal cortex (EC) slices obtained from epileptic rats 3 wk after pilocarpine-induced status epilepticus (SE) revealed hyperexcitability in many limbic areas, but not in CA3 and medial EC layer III. By visualizing immunopositivity for FosB/ ∆FosB-related proteins—which accumulate in the nuclei of neurons activated by seizures—we found that: (1) 24 h after SE, FosB/∆FosB immunoreactivity was absent in medial EC layer III, but abundant in dentate gyrus, hippocampus proper (including CA3) and subiculum; (2) FosB/∆FosB levels pr o-gressively diminished 3 and 7 d after SE, whereas remaining elevated (p < 0.01) in subiculum; (3)
FosB/∆FosB levels sharply increased 2 wk after SE (and remained elevated up to 3 wk) in dentate gyrus and in most of the other areas but not in CA3. A conspicuous neuronal damage was noticed in medial EC layer III, whereas hippocampus was more preserved. IOS analysis of the stimulus-induced responses in slices 3 wk after SE demonstrated that IOSs in CA3 were lower (p < 0.05) than
in NEC slices following dentate gyrus stimulation, but not when stimuli were delivered in CA3. These findings indicate that CA3 networks are hypoactive in comparision with other epileptic limbic areas. We propose that this feature may affect the ability of hippocampal outputs to control epileptiform synchronization in EC.
doi: 10.1385/NMM:7:4:325
Index Entries: Entorhinal cortex; hippocampus; immediate early genes; intrinsic optical signals; pilocarpine; temporal lobe epilepsy.
NeuroMolecular Medicine
Copyright © 2005 Humana Press Inc. All rights of any nature whatsoever reserved. ISSN0895-8696/05/07:325–342/$30.00 doi: 10.1385/NMM:7:4:325
Complex partial seizures, which are commonly generated in the temporal lobe, represent the most frequent form of epilepsy in adult patients (Hauser and Kurland, 1975; Wiebe et al., 2001). A lesion known as Ammon’s horn sclerosis is the hallmark of mesial temporal lobe epilepsy (MTLE). However, the hippocampus proper (made of CA1, CA2, and CA3 subfields) (Witter et al., 1989; Gloor, 1997) is not exclusively damaged, because other areas of the hippocampal formation, such as the dentate hilus and entorhinal cortex (EC), are also affected by cell loss (Mathern et al., 1997). To date, it is unclear whether these lesions precede (thus causing epilepsy) or follow chronic seizures in patients with MTLE (Jefferys, 1999). Electroencephalogram (EEG) recordings in patients have shown that seizures (also termed “ictal” events) are character-ized by long-lasting, synchronous discharges that initiate in EC (Rutecki et al., 1989; Spencer and Spencer, 1994; Bartolomei et al., 2001). Similar find-ings have also been obtained in animal models (Avoli et al., 2002). In addition, when seizures are not man-ifested, the EEG is abnormal because of the pres-ence of shorter periods of neuronal synchronization called “interictal” events (McNamara, 1994;
McCormick and Contreras, 2001).
Evidence obtained from animal models and patients with epilepsy (cf. de Curtis and Avanzini, 2001; Avoli et al., 2002) suggest that brief, interictal discharges generated within the CA3 area inhibit the recurrence of ictal events. For instance, interictal-like activity recorded in hippocampal–EC slices from nonepileptic control (NEC) rodents main-tained in Mg2+-free medium (Swartzwelder et al., 1987; Bragdon et al., 1992) or treated with the K+
channel blocker 4-aminopyridine (4AP) (Barbarosie and Avoli, 1997) can control the ictal-like activity originating in EC. This evidence has led us to pro-pose that hippocampal damage induced by status epilepticus(SE) may be responsible for a permanent decrease of hippocampal output activity, thus releas-ing ictal discharges in EC (Avoli et al., 2002). In line with this view, brain slices obtained from pilo-carpine-treated, epileptic mice (D’Antuono et al., 2002) or rats (Nagao et al., 1994; Köhling et al., 1995), treated with 4AP, generated CA3-driven interictal-like activity that was less frequent than in age-matched NEC tissue.
At variance with what was found following kainic acid administration (Esclapez et al., 1999; Dalby and
Mody, 2001), CA3 neuronal loss is relatively modest in pilocarpine-treated animals studied with either quantitative (Liu et al., 1994; André et al., 2000;
Fabene et al., 2003) or qualitative (Turski et al., 1983;
Esclapez et al., 1999) analytical methods. Thus, func-tional changes of CA3 networks subsequent to the initial pilocarpine-induced SE may be more rele-vant than neuronal damage in establishing the epileptogenic process. In order to further investi-gate the functional characteristics of altered CA3 networks in pilocarpine-treated rats, we have used here imaging techniques to analyze the activation of the hippocampal formation of rats presenting with recurrent seizures. In particular, we studied hippocampal–EC slices employing intrinsic optical signal (IOS) imaging that provides information on the spatiotemporal patterns of neuronal activity (MacVicar and Hochman, 1991; Andrew et al., 1996;
Jarvis et al., 1999; Weissinger et al., 2005) and thus can be used to monitor the onset and propagation of epileptiform synchronization (D’Arcangelo et al., 2001, 2005). In addition, taking advantage of FosB/∆FosB-related protein induction in neurons participating to seizures (Morris et al., 2000;
Mohapel et al., 2001), we compared the in vitro findings with the ex vivo patterns of network activ-ity identified in pilocarpine-treated epileptic rats. Both techniques provided evidence for functional downregulation of the CA3 subfield, although other hippocampal regions appeared to be hyperactive.
Methods
Animals and
Treatments
Ninety-one Sprague-Dawley rats (270–300 g,
Harlan Italy, S. Pietro al Natisone, Italy) were treated with pilocarpine (380 mg/kg) to induce SE and used for subsequent studies. Pilocarpine was adminis-tered intraperitoneally (ip) 30 min after a subcuta-neous scopolamine methylnitrate (1 mg/kg) injection (Biagini et al., 2001). Animal behavior was monitored for 4–6 h after pilocarpine and scored according to the classification of Racine (1972). All rats exhibited a stage-6 response to pilocarpine (i.e., tonic-clonic seizures for at least 1 h). Mortality was around 27%. After recovering from SE, rats became irritable and hypersensitive to sensory stimulation. Spontaneous seizures (consisting of facial automa-tisms, head nodding, forelimb clonus, rearing, and
CA3 Hypoactivity in Temporal Lobe Epilepsy 327 occasional generalization) appeared starting from
the 10th d onward as assessed by video recording 4 h/d, 5 d/wk. At the end of the observation period (3 wk), approx 90% of the pilocarpine-treated rats manifested stage-5 spontaneous seizures. Pilo-carpine-treated rats that did not present sponta-neous seizures were discarded. NEC rats (n= 41)
that were ip injected with saline did not develop any of these symptoms. Procedures were compli-ant with the Canadian and the European Union Councils of Animal Care. All efforts were made to minimize the number of animals used and their suffering.
IOS Studies
Brain slices from pilocarpine-treated epileptic and NEC rats were obtained 3 wk after treatment following standard procedures (D’Arcangelo et al., 2001). In brief, rats were decapitated under halothane anaesthesia, the brain was removed and placed in cold oxygenated artificial cerebrospinal fluid (ACSF). Horizontal slices (500 µm thick) including the EC and the hippocampus proper were cut with a vibratome along a horizontal plane of the brain that was tilted by approx 10° along a pos-terosuperior-anteroinferior plane passing between the lateral olfactory tract and the brainstem base. Slices were then transferred to a submerged tissue chamber in which they were placed under a nylon filament grid to prevent any artifact caused by flow, and were superfused with oxygenated (95% O2, 5% CO2) ACSF at 32–34°C. ACSF composition was (in 500 mM): NaCl 124, KCl 2, KH2PO41.25, MgSO42, CaCl22, NaHCO326, and glucose 10. 4AP (500 mM)
was bath applied. Chemicals were acquired from Sigma (St. Louis, MO, USA).
To visualize IOSs, the tissue chamber was mounted on the stage of an upright microscope. The slices were illuminated with a dark-field conden-sor and examined with a 2.5× objective; the illumi -nation light was filtered with a band-pass interference filter (750 ± 50 nm). To detect IOS changes, analog contrast enhancement, background subtraction, and a fivefold digital enhancement were applied on-line to video images that were obtained from an infrared video camera (C2400-07, Hama-matsu Photonics, HamaHama-matsu City, Japan). Images were processed with a real time digital video-image enhancement system (Argus 20, Hamamatsu
Photonics, Hamamatsu City, Japan). An averaged darkfield image was digitized at 16 bits, stored on a computer and then subtracted in real time from the incoming image before and at successive times after stimulation. Electrical stimuli were delivered either as single-shock (0.5–2 mA, 10–150 µs) or as a train (0.5–1.5 mA, 10–150 µs; 50 Hz for 2 s) through bipolar tungsten electrodes placed in the deep EC layers close to the angular bundle (Fig. 1), in the dentate gyrus (Fig. 3) or in the CA3 pyramidal layer (Fig. 5). Images were acquired before (background) and during electrical stimulation with a temporal resolution of 10 images per second and were dis-played in pseudocolors from blue (minimal changes) to red (maximal changes) (D’Arcangelo et al., 2001). Data were further analyzed off-line to quantify both the intensity and the area of the IOS changes in windows encopassing different regions of the slice by the software IAS2000 (Delta Sistemi, Roma, Italy). IOS intensity was measured calcu-lating the difference between pixel intensity in each region of interest and as percentage of the digital intensity of the control (background) image of the same series, using the following formula: [(Tt–T0)/T0] × 100 (in which T0 corresponds to the initial image of the series considered as back-ground, and Tt is the image acquired at given time t after the end of the stimulus).
Histopathological Studies
Brain slices used for IOS studies were fixed overnight in formalin, washed extensively in 15% and 30% sucrose-PB buffered solutions, frozen and cut with a cryostat in 14 µm sections for histology. They were then scored for damage as described by
Mikkonen et al. (1998), according to the following grading scale: ND, nondetectable damage; grade I, 0–25% cell loss (mild damage); grade II, 25–50% (moderate damage); grade III, 50–75% (severe damage); grade IV, 75–100% (near complete damage). The hippocampal areas CA1–2 and CA3, dentate gyrus and hilus, the subiculum, and the EC superficial layers (II–III) were acquired by a video-camera mounted on a Axiophot microscope and connected to the KS300 software for image analy-sis (Zeiss-Kontron, Munich, Germany). The area covered by toluidine blue-stained neurons was mea-sured in NEC and pilocarpine-treated rats and the grade of neuronal damage was then calculated.
Immunohistoc
hemical Studies
Neuronal activation was studied ex vivo with two different FosB/∆FosB rabbit polyclonal anti -bodies (Santa Cruz Biotechnology, Santa Cruz, CA, USA). The first one (H-75, sc-7203, Mohapel et al., 2001), raised against amino acids 75–150 in the amino terminus of human FosB, was previously shown to recognize all ∆FosB isoforms but not FosB in Western blots (Andersson et al., 1999; Werme et al., 2002); the second one (102, sc-48), a rabbit polyclonal antibody raised against amino acids of the central domain of mouse FosB, was shown to label various ∆FosB isoforms as well as FosB (Morris et al., 2000). FosB/∆FosB (1 : 500) antibodies were used on 50 µm-thick cryostat-cut horizontal sections obtained at level 7.4 mm from the bregma (Paxinos and Watson, 1998). Immunohistochemistry was made with the avidin–biotin complex (ABC) tech-nique and diaminobenzidine as chromogen (Biagini et al., 1993). Endogenous peroxidase was blocked by 0.1% phenylhydrazine in phosphate buffered saline (PBS) for 20 min, followed by sev-eral washes in PBS before incubation with the pri-mary antibody. The secondary biotinylated antirabbit IgG antibody and the streptavidin-biotinylated horseradish peroxidase complex (Amersham Italia, Milan, Italy) were diluted 1 : 200 and 1 : 300, respectively. Stained sections were ana-lyzed by densitometry using the KS300 image analysis software (Biagini et al., 1993, 2001). After such analysis, slides were counterstained with tolu-idine blue to localize cells presenting FosB/ ∆FosB-positive nuclei. These experiments were first based on hippocampal–EC slices obtained from the ani-mals used in the IOS studied, fixed as described for histopathological studies. Afterward, we ana-lyzed rats sacrificed at the following temporal intervals from the pilocarpine injection: 1 d (n= 6
and 3, pilocarpine- and saline-treated NEC rats, respectively), 3 d (n= 5 and 3), 7 d (n = 7 and 3), 14d (n= 5 and 3), and 21 d (n = 5 and 3). Animals were anaesthetized with chloral hydrate (450 mg/kg, ip) and perfused via the ascending aorta with 100 mLsaline followed by Zamboni’s fixative, as pre-viously described (Biagini et al., 1993). Brains were then kept overnight in the same fixative at 4°C and, after cryoprotection by immersion in 15% and 30% sucrose-phosphate buffer solutions, they were frozen and cut horizontally with a freezing microtome.
Histoc
hemical Studies
In addition to the histological analysis of hip -pocampal–EC slices, we stained degenerating neu-rons in pilocarpine-treated rats sacrificed 24 h after SE, using the fluorochrome Fluoro-Jade (Histo-Chem Inc, Jefferson, AR, USA). Twenty-five micrometer thick horizontal sections were obtained at level 7.4 mm from bregma, washed in PBS, mounted on gelatin-coated slides and dried overnight (37°C). Slides were pro-gressively hydrated by immersion in decreasing ethanol solutions (3 min in absolute ethanol and 1 min in 70% ethanol) and treated with 0.06% potassium per-manganate for 15 min. After a rinse (1 min) in distilled water, slides were stained in a 0.001% Fluoro-Jade solu-tion containing 0.1% acetic acid. Slides were then rinsed in water, dried on a prewarmed hotplate at 37°C, dipped in xylene and covered with mounting medium (Eukitt, EMS Inc, Hatfield, PA, USA) according to
Schmued et al. (1997). Sections were then examined with a fluorescence microscope, acquired by a digital camera and stored for analysis. Fluoro-Jade positive neurons were counted in dentate gyrus, CA1 and CA3 hippocampal subfields, subiculum and entorhinal cortex (EC) superficial layers, and expressed by the sampled area (cells/mm2).
Sections close (7.1 mm from bregma) to those processed with Fluoro-Jade were stained with tolu-idine blue in order to count surviving neurons (see Biagini et al., 1993;Liu et al., 1994). A cutoff corre-sponding to 3 mm was adopted in order to exclude cell fragments and glial cells. Two sections/animal were analyzed at high magnification; the fields (each covering an area = 0.28 mm2) were aimed at the
CA3a, CA3b, and CA3c pyramidal cell layer; by doing so we measured the number of cells in each hippocampal sector in the two close sections and calculated the mean of these counts.
Data
Analysis
Values throughout the text are expressed as mean ± SEM. Data were compared with the one-way analy-sis of variance (ANOVA) and were considered sig-nificantly different if p < 0.05. The time-course of
FosB/∆FosB immunoreactivity was analysed by two-way ANOVA considering the different limbic areas as “between factor” and the time as “within factor.” Whenever required, groups of values were also analyzed by Tukey’s test for multiple comparisons. IOS data were compared by a nonparametric test.
CA3 Hypoactivity in Temporal Lobe Epilepsy 329
Results
IOS Recor
dings Induced by Stimulation
of EC Projections
First, we used IOS recordings in NEC and pilo-carpine-treated (obtained 3 wk after SE) slices that were superfused with 4AP-containing medium to
compare the responses to single-shock stimuli. NEC slices (n= 10) generated IOSs that appeared first at the border (near to the stimulation site, 3 s frame in
Fig. 1A) between medial and lateral EC (hereafter identified as MEC and LEC, respectively), and spread later to the dentate gyrus and to CA3/CA1 (Fig. 1A, 15 s frame) (cf.D’Arcangelo et al., 2001). Similar stimulus-induced IOS responses were seen
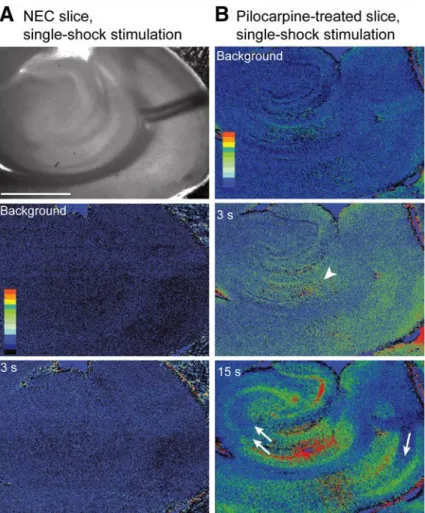
Fig. 1. Intrinsic optical signal (IOS) elicited by single-shock stimuli in nonepileptic control (NEC) (A) and pilo -carpine-treated (B) slices superfused with 4AP-containing medium. Darkfield-infrared images are shown in both
A and B on the left, whereas the other frames represent the changes in IOS at different times following a single-shock stimulus delivered in the entorhinal cortex (EC) deep layers. Note that IOSs in the NEC experiment appear in EC (3 s frame) and then propagate toward the hippocampal formation (15 s frame). In contrast, IOSs occur both in the EC and subiculum (arrowhead) of the pilocarpine-treated slice shortly after the stimulus. Note also that min-imal IOSs are seen in medial EC layer III (single arrow), dentate hilus, and CA3 (double arrows).(C) Changes in
IOS intensity measured in NEC (open columns, n= 10) and pilocarpine-treated slices (closed columns, n = 14)
during 4-aminopyridine (4AP) application. Identification of the different areas of a hippocampus-EC slice from which quantitative IOS measurements were obtained are shown in A. Note that the IOS values in the pilocarpine treated experiments are significantly smaller in CA3 and larger in subiculum (left panel). IOSs measured in layer V–VI, layer III, and layer I–II of the medial EC of NEC (open columns, n= 12) and pilocarpine-treated slices (closed
columns, n= 14) during 4AP application are shown in the right panel. Note that in NEC there were no differences
in IOS changes among layers, whereas in pilocarpine-treated slices the responses generated by layer III were lower than those in layer V-VI. *p < 0.05, **p < 0.01, Mann-Whitney test. MEC, medial entorhinal cortex; LEC, lateral entorhinal cortex; Sub, subiculum. Scale bar in the dark-field infrared image of panel A corresponds to 2 mm.
Fig. 2. Intrinsic optical signal (IOS) generated by nonepileptic control (NEC) (A) and pilocarpine-treated (B) in
response to single-shock stimulation of the angular bundle. Darkfield-infrared image of an NEC slice is shown on top of panel Awhile IOS frames were obtained before (background) and at two different times after the stimulus. Note that single-shock stimulation does not elicit any appreciable IOS change in the NEC slice when not super-fused with 4-aminopyridine (4AP) (Fig. 1A). In contrast, in the epileptic slice (21 d after pilocarpine-induced status epilepticus[SE]), a similar stimulation evokes IOSs that are present in different limbic areas. Note also that broad and robust IOSs increases occur in the subiculum 3 s after the stimulus (arrowhead) as well as that regions of min-imal IOS are observed in MEC layer III and in CA3 (single arrow and double arrows, respectively in the 15 s frame). In contrast, whereas IOSs are barely visible in CA3, the CA1 region is highly activated. Scale bar in the dark-field infrared image of panel A corresponds to 2 mm
in pilocarpine-treated slices (n= 14) (Fig. 1B). How-ever, IOSs early after the stimulus were detected in different areas of these slices, whereas they remained confined to the EC in NEC tissue (3 s frames in NEC and pilocarpine-treated slice in Fig. 1A,B). In addi-tion, we identified in pilocarpine-treated, but not in NEC slices, a clear activation of the subiculum (arrowheads in Fig. 1B,3 and 15 s frames). Finally, IOS were minimal in the superficial layers of the MEC and in the CA3 of epileptic slices (Fig. 1B, single and
double arrows in the 15 s frame, respectively). A semiquantitative analysis obtained from different areas of NEC and pilocarpine-treated slices con-firmed these data (Fig. 1C, left panel). In addition, we found that IOSs in the MEC were smaller in pilo-carpine-treated than in NEC tissue; such a differ-ence was mainly localized in layer III (Fig. 1C, right panel).
Next, we analyzed the IOSs generated by hip-pocampal–EC slices superfused with normal ACSF
CA3 Hypoactivity in Temporal Lobe Epilepsy 331
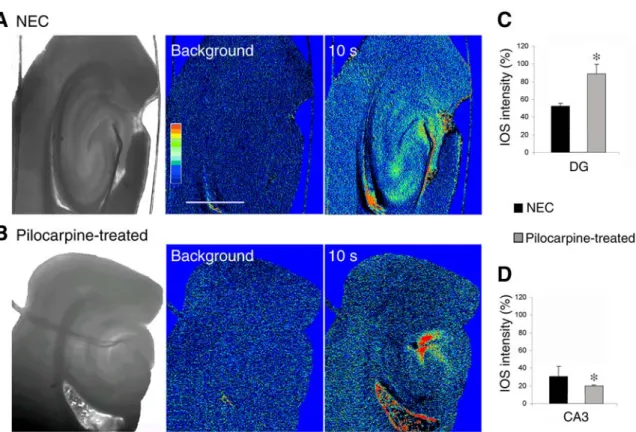
Fig. 3. Intrinsic optical signal (IOS) changes elicited by a stimulus train (50 Hz for 2 s) delivered in the dentate gyrus of nonepileptic control (NEC) (A) and pilocarpine-treated epileptic slices 21 d after status epilepticus (SE) (B). Dark -field-infrared images of NEC and pilocarpine-treated epileptic slices are shown on the left, whereas IOS frames were obtained before (background) and 10 s after stimulation. Note that in the NEC slice this stimulating protocol induces IOS increases in both dentate and CA3, whereas no IOS changes are seen in the CA3 of the pilocarpine-treated rat slice even though a very robust IOS activation is present in dentate area. Scale bar, 2 mm.C and D: Quantification of
the IOS changes elicited in dentate gyrus(C) and CA3 (D) of NEC and pilocarpine-treated slices by stimulus trains delivered in dentate gyrus. Note that the IOS intensity in the dentate gyrus is lower in NEC than in epileptic slices, whereas in CA3 it is lower in the epileptic than in NEC slices. * indicate p < 0.05, Mann-Whitney test.
that were obtained from rats 3 wk after pilocarpine treatment or saline injection. Single-shock, electrical stimulation of the angular bundle in NEC slices (n = 9) did not elicit any appreciable IOSs (Fig. 2A); in contrast, similar stimuli caused widespread IOS changes in epileptic slices (n= 14) (Fig. 2B). In these experiments, IOSs were seen a few seconds after the stimulus in both LEC and MEC as well as in several structures of the hippocampal formation including the subiculum (Fig. 2B, arrowhead in the 3 s frame). Over time, IOSs became more intense in all limbic regions with the exception of MEC superficial layers and CA3 in which minimal IOS changes could be identified (Fig. 2B, 15 s frame, single and double arrows, respectively).
IOS Recor
dings Following Dentate Gyrus
and CA3 Stimulation
We reasoned that the very low response observed in the CA3 hippocampal subfield of hippocampal– EC slices could depend on a poor preservation of neuronal connectivity in our preparation. There-fore, we utilized IOS recordings to establish whether a direct stimulation of dentate gyrus could elicit a series of comparable responses in CA3 of NEC and pilocarpine-treated epileptic rats. As illustrated in
Fig. 3A, we found that trains of stimuli delivered in dentate gyrus of NEC slices (n = 4) induced IOS
changes in both dentate and CA3. In contrast, in slices (n= 6) obtained from epileptic rats 21 d after
pilocarpine, this stimulation protocol caused IOS changes that were significantly larger in the den-tate gyrus, but smaller in the CA3 subfield when compared with NECs (Fig. 3B) (p < 0.05 in both
cases, Mann-Whitney test). These data are quanti-fied in term of changes in percent of basal signal (see Methodssection for details) in Fig. 3C,D.
To rule out the possibility that these IOS data reflected SE-induced neuronal damage in CA3, we scored neuronal lesion in the hippocampus and EC of the pilocarpine-treated slices used in these IOS experiments. As illustrated in Fig. 4A, we found that dentate hilus and MEC superficial layers were the most damaged areas, since they presented,
Fig. 4. Grading of the neuronal damage in toluidine blue-stained sections obtained from pilocarpine-treated hip-pocampal–entorhinal cortex (EC) slices (n= 6) used for intrinsic optical signal (IOS) experiments 3 wk after status epilepticus(SE). In (A) thegrading of the lesion from nondetectable (ND) to almost complete lesion (grade IV) is shown for different areas (see Methods section for details). In the medial EC (MEC) and lateral (LEC), only the super-ficial layers (I-III) were scored. Results are expresses in the Y-axis as percentage of sampled areas scored at any given grade of lesion. In(B), a section obtained from a nonepileptic control (NEC) hippocampal–EC slice is shown. In (C),
a section obtained from a pilocarpine-treated epileptic rat shows a limited damage (grade I, corresponding to a 0–25% decrease) in the dentate hilus (DH), and a pronounced lesion (arrows) in MEC superficial layers (grade III, corre-sponding to a 50–75% decrease). In panel (D), neuronal loss in EC (arrows) encompasses MEC (grade III) and LEC (grade II, corresponding to a 25–50% decrease) superficial layers (note that deep layers were not scored); lesion in DH is also more evident than in C (grade IV, corresponding to a 75–100% decrease) involving even DG (grade I, arrow-head), whereas the hippocampus presents about a 50% cell loss (grade III) in CA1 and CA3; note that also subiculum is damaged (grade I, asterisk). Scale bar corresponds to 500 µm.
CA3 Hypoactivity in Temporal Lobe Epilepsy 333
respectively, an almost complete (grade IV) or severe lesion (grade III) in about 80% of sampled areas. On the contrary, both subiculum and dentate gyrus were largely spared and presented only a mild (grade I) damage that was detected, respectively, in about 50% or 20% of samples. In addition, both CA3 and CA1 subfields generally displayed a mild-to-moderate (grade II) damage that could not justify the difference found in the pattern of IOS responses induced by stimulation trains delivered in the angu-lar bundle (cf. Fig. 1 and 2). Examples of the different grades of lesion are shown in Fig. 4B–D.
Finally, we directly stimulated the CA3 subfield of NEC and pilocarpine-treated slices anticipating that if CA3 was only mildly to moderately damaged then it would respond to direct stimulation. As shown in Fig. 5A,B, stimulus trains induced IOS changes in the CA3 pyramidal layer both in NEC (n= 5) and in pilocarpine-treated (n= 6) slices. In
addition, IOS quantification revealed values that
were not significantly different in the CA3 area of NEC and pilocarpine-treated slices (Fig. 5C). Therefore, 3 wk after SE, the epileptic CA3 sub-field appears to be excited by local stimuli to an extent similar to what was observed in NEC tissue, thereby, suggesting anatomical preservation of this hippocampal region.
F
osB/
∆F
osB Expression in Hippocampal–EC
Slices
The study of IOS signals evoked in hippocampal–
EC slices demonstrated that the CA3 hippocampal subfield is hypoactive in pilocarpine-treated epilep-tic rats without presenting cell depletion as in MEC layer III. However, it may be possible that this in vitro evidence does not reflect the activity of integrated neuronal networks activated in vivo by seizures. Thus, by immunohistochemistry we studied the expression of markers known to be synthesized
Fig. 5. Intrinsic optical signal (IOS) changes elicited by a stimulus train (50 Hz for 2 s) delivered in the CA3 pyra-midal layer of NEC (A) and pilocarpine-treated epileptic rat slices 21 d after SE(B). In both panels, darkfield-infrared images of nonepileptic control (NEC) and pilocarpine-treated epileptic slices are shown on the left, whereas IOS frames were obtained before (background) and 10 s after stimulation. Note that this procedure induces compara-ble IOSs both in NEC and pilocarpine-treated epileptic rat slices. Scale bar = 2.5 mm. (C) IOS quantification in CA3 demonstrating no significant differences between pilocarpine-treated and NEC slices after local stimulation.
in neuronal populations that are activated by seizures (Morris et al., 2000; Mohapel et al., 2001). Hippocampal–EC slices close to those studied in the IOS experiments were immunostained with two dif-ferent FosB/∆FosB antibodies and analyzed 3 wk after pilocarpine (n= 28) or saline (n = 19) injection.
We found intensely stained FosB/∆FosB neuronal nuclei in several limbic regions (identified in
toluidine blue-stained sections,Fig. 6A) with both antibodies (Fig. 6B,C). These FosB/∆FosB positive neurons were identified in LEC but not in MEC layer III (compare Fig. 6B and C). FosB/∆FosB expression in pilocarpine-treated brains was also distributed in the subiculum/CA1 region and in the dentate granule cell layer (Fig. 6B,C). How-ever, few positive cell nuclei were identified in
Fig. 6. Distribution of FosB/∆FosB-staining in the limbic system of hippocampal–entorhinal cortex (EC) slices from a pilocarpine-treated epileptic rat, after evaluation of IOS at 3 wk from status epilepticus (SE). Two different poly-clonal antibodies were used according to the ABC technique (see Methods for details); in this case, the reaction was intensified with nickel chloride. In (A), a section stained with toluidine blue illustrates a large damage in medial EC (MEC) layer III, extending also to lateral EC (LEC), and dentate hilus, whereas other hippocampal regions are well preserved. In (B), the antibody raised against the FosB central domain labeled FosB/∆FosB antigens in dentate gyrus, CA3, CA1, subicular areas, and EC. Note that MEC and, in part, also LEC layer III were devoid of immunoreactiv-ity because of cell loss, as illustrated in A. In (C), the antibody against the FosB amino terminus shows a staining lighter than in B in the hippocampus and LEC. Note that this difference is particularly evident in the CA3 hip-pocampal subfield, in which only few pyramidal cells were labeled. The arrows delimit the CA2 hiphip-pocampal sub-field. In (D–F), IOS changes elicited in different slices of the same animal were induced by a stimulus train (50 Hz for 2 s) delivered in the dentate gyrus. Note that IOS changes are imaged in dentate hilus (DG), CA1, subiculum and LEC, suggesting neuronal activation in the same areas labeled with the antibody directed against the FosB amino terminus (C). Darkfield-infrared images are shown on the left (D), whereas IOS frames were obtained before (back-ground, E) and 10 s after stimulation (F). Scale bar in C and F corresponds, respectively, to 500 and 2000 µm.
CA3 Hypoactivity in Temporal Lobe Epilepsy 335 CA3 with the antibody directed against the FosB
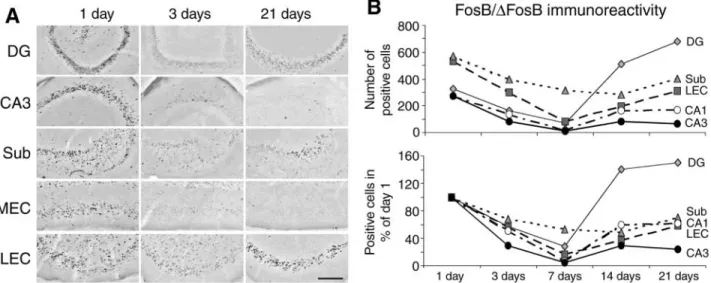
amino terminus (Fig. 6C), whereas pyramidal cell nuclei were instead well stained by the other anti-body (Fig. 6B). Only sparse neuronal cell nuclei were observed in sections obtained from NEC rats (not shown). Definitively, by using the antibody raised against the FosB amino terminus we were able to trace an ex vivo pattern of neuronal activation that was largely superimposable to the distribution of IOS signals (shown in Fig. 6D–F) observed in hip-pocampal–EC slices obtained from the same animals. We hypothesized that differences found in the CA3 staining with the two antibodies could be explained by a different affinity to transient and stable ∆FosB isoforms (McClung et al., 2004) in formaldehyde-fixed tissue. To confirm that the FosB/∆FosB distribution identified with the H-75 antibody 3 wk after SE largely corresponded to tran-siently expressed antigens, thus reflecting the recur-rence of limbic seizures in these animals, we designed a time-course experiment in which FosB/∆FosB-positive profiles were counted and ana-lyzed 1, 3, 7, 14, and 21 d after pilocarpine treatment. Two-way ANOVA of the FosB/∆FosB-positive pro-files revealed over time (F4, 236 = 40.66, p < 0.0001) changes in the sampled regions (F4, 236 = 42.74,
p< 0.0001), with a significant interaction of the two
factors (F16, 236 = 8.29, p < 0.0001). Thus, 1 d after SE we found a strong induction of immunoreactivity in all hippocampal and parahippocampal areas (Fig. 7A, 1 d). FosB/∆FosB-positive profiles were identified in both dentate granule cell layer and hilus as well as in CA3, in which the pyramidal cell layer was heavily stained. In addition, similar patterns of immunopositivity were present in CA1 (not shown) and subiculum (Fig. 7A, 1 d). Finally, positive pro-files were found throughout the LEC but not in MEC layer III in which only a few scattered positive cells could be observed (Fig. 7A, 1 d).
In the following time intervals, FosB/∆FosB immunoreactivity varied extensively in all limbic regions. Notably, we found a progressive decrease from 1 to 3 and 7 d (n= 6, 5, and 7 rats, respectively) after SE induction in all the previously positive areas (Fig. 7A, 3 d column, and B). However, 7 d after SE, FosB/∆FosB levels remained significantly (p < 0.01,
Tukey’s test) higher in the subiculum as compared with the other regions. Moreover, 14 d after SE (n= 5), FosB/∆FosB-positive profiles increased in many limbic structures except in the subiculum, and
in the dentate gyrus abruptly exceeded the FosB/∆FosB levels observed 1 d after pilocarpine injection (p < 0.01, Tukey’s test). Finally, FosB/
∆FosB-positive profiles increased further in dentate gyrus and LEC as well as in the subiculum, 21 d after pilocarpine injection (n = 5), whereas they remained stable in the hippocampus. Indeed, the lowest levels of FosB/∆FosB immunoreactivity were found in CA3 in which they were barely detectable. Thus, the time-course of the immunostaining demonstrated that we detected the transiently expressed, rather than stable FosB/∆FosB isoforms, and that these transient isoforms are generated at very low levels in MEC and CA3.
Changes in F
osB/
∆F
osB Expression
and Cell Loss
To investigate whether the changes in FosB/∆FosB immunoreactivity seen in these limbic areas corresponded to cell loss, we counterstained the immunolabeled sections with toluidine blue. First, we found that counterstained FosB/ ∆FosB-positive elements were localized over all LEC layers 1 d after SE, whereas 21 d later they were preva-lent in LEC layer IIb (Kohler, 1988) pyramidal cells (Fig. 8A,B); in both cases, no extensive damage was evident in every layer. Second, 1 d after SE, FosB/∆FosB-stained cells were observed in the MEC with the exception of layer III (Fig. 8C), in which only few positive pyramidal cells were spared. In addition, 21 d after SE, no positive ele-ments were seen in MEC, whose layer III was clearly devoid of neurons and contained many toluidine blue-stained nuclei of glial cells (Fig. 8D). Third, 1 d after SE we identified FosB/∆FosB-positive cell nuclei in the CA3 pyramidal layer (Fig. 8E) whereas no FosB/∆FosB signal was detected 21 d later (Fig. 8F) in animals in which the pyramidal layer appeared to be well preserved. Hence, whereas in MEC layer III the reduction of FosB/∆FosB-positive elements appeared to be attributable to an extensive cell loss, in CA3 it could be explained by a very low FosB/∆FosB synthesis in the remaining neurons.
To confirm that the changes in FosB/∆FosB immunoreactivity in MEC layer III and CA3 were distinct phenomena, we analyzed the presence of degenerating Fluoro-Jade-positive neurons in var-ious hippocampal and parahippocampal regions a day after SE (Fig. 9). Positively stained neurons were
we found a small (10%) decrease in CA3 pyramidal cells in rats sacrificed both 1 and 3 d after SE. In ani-mals studied 3 d following SE, pyramidal cell counts were significantly lower than NEC values (p < 0.05,
Tukey’s test). Thus, these histopathological data are at odds with the 70% decrease in FosB/∆FosB immunoreactivity found in the CA3 area of the same groups of pilocarpine-treated rats (Fig. 7).
Discussion
Till date, only few investigations have addressed in animal models of MTLE the functional changes identified in the CA3 area 24 h after pilocarpine
injection (Fig. 9A), but they were clearly less than in other limbic regions, such as MEC layer III (Fig. 9C) and dentate hilus. In fact, Fluoro-Jade-positive neu-rons in these areas were three- to fourfold higher than in the hippocampal subfields (Fig. 9D). Indeed, the damage found in CA3 was comparable to what was identified in CA1 (Fig. 9B) and subiculum (Fig. 9D), an area that responded to stimuli delivered in the hippocampal–EC slice (Figs. 1 and 2).
Finally, to rule out an underestimation of cell loss in CA3, we assessed the number of neurons in the CA3 pyramidal layer by using toluidine blue-staining sections (Fig. 9E). As shown in Fig. 9F,
Fig. 7. Time-course of FosB/∆FosB immunoreactivity after pilocarpine-induced SE. (A) Distribution of FosB/∆FosB positive cell nuclei in different limbic regions at 1, 3, and 21 d after status epilepticus (SE). Note that 1 d after SE,
immunoreactive cell nuclei are present in the granule cell layer of the dentate gyrus (DG) and in the hilus, whereas at 21 d they are visible only in the former structure. In contrast, immunopositivity in CA3 is evident 1 d after SE, declines at 3 d and does not reappear 21 d after SE. In addition, FosB/∆FosB-stained cells in the epileptic subicu-lum (Sub) are spread all over the pyramidal cell layer 1 d after SE, although they are localized close to CA1 at 21 d; this localization corresponds to the sector of lateral entorhinal cortex (LEC) projections. Note also that only few positive nuclei are detected in medial EC (MEC) layer III already 1 d after SE, whereas they are present in other layers; in addition 21 d after SE, only scattered positive cells are detected in MEC. In contrast, in LEC, FosB/∆F osB-positive cells are seen in deep and superficial layers shortly after SE, but are present in the superficial layers when spontaneous seizures appear. Scale bar = 250 µm. (B) Quantification of FosB/ ∆FosB-positive cell nuclei found in different limbic areas at successive times after pilocarpine-induced SE. Data in the top panel are cell counts obtained at different times after pilocarpine injection, whereas in the bottom panel they are normalized relative to the values found 1 d after SE. Note that only superficial LEC layers were sampled since few cells were positive in the deep layers 2–3 wk after SE. Standard deviations are not illustrated for sake of clarity. A two-way analysis of variance (ANOVA) revealed highly significant differences (p < 0.0001) among the regions and time intervals. Cell counts were found to be significantly (p < 0.01, Tukey’s test) higher in the subiculum 7 d, and in the dentate area 14 and 21 d after SE as compared with the other limbic areas. FosB/∆FosB-positive cell nuclei at 14–21 d after SE were significantly (p < 0.01) higher than those scored 1 d after SE, in the dentate area only.
CA3 Hypoactivity in Temporal Lobe Epilepsy 337 that typify the various sectors of the “trisynaptic
pathway” linking the EC with the hippocampus in a loop-like manner (Wu and Leung, 2001, 2003). By using IOS imaging in brain slices along with immunohistochemistry for the fosB gene family we
have found here that: (1) hyperexcitability can be imaged in several limbic regions of pilocarpine-treated epileptic rats; (2) impaired neuronal activa-tion could be identified in CA3 and MEC, although cell loss was severe in the EC only; (3) similar pat-terns of neuronal activity could be illustrated with both in vitro and ex vivo techniques.
Interictal-like epileptiform activity initiates in CA3 area of NEC slices that are stimulated with pilo-carpine (Nagao et al., 1996), high K+(Traynelis and Dingledine, 1988), or Mg2+-free medium (Wilson et al., 1988). This pattern of neuronal synchonization has been reported to initiate ictal-like activity in the CA1 region of NEC rat slices (Traynelis and Din-gledine, 1988). However, when the hippocampus is allowed to interact with EC in the presence of 4AP, a more complex phenomenon is observed as the EC generates ictal-like discharges that propagate to the hippocampus, but disappear after 1–2 h. In addi-tion, ictal-like activity is restored by cutting the hippocampus-EC connections, thus blocking the propagation of CA3-driven interictal-like dis-charges to EC (Barbarosie and Avoli, 1997). Finally, stimulation of hippocampal–EC slices at the same frequency as the CA3-driven interictal-like dis-charge suppresses the ictal-like disdis-charges origi-nating in EC (Barbarosie and Avoli, 1997; Barbarosie et al., 2002). Recently, these electrographic findings could be reproduced with the IOS technique in NEC slices (D’Arcangelo et al., 2005).
Previous electrophysiological investigations from our laboratories have addressed the role of hippocampus-EC interactions in slices obtained from pilocarpine-treated epileptic rodents (Nagao et al., 1994; Köhling et al., 1995; D’Antuono et al., 2002). These studies have consistently demonstrated a reduced frequency of CA3-driven interictal-like activity along with persistence of ictal-like dis-charges in EC. In line with this electrophysiologi-cal evidence we have found here that IOSs in the CA3 subfield are very low as compared with other hippocampal areas, regardless of the presence of 4AP in the bath medium. Although IOS imaging can provide limited information on the mechanisms underlying the reduced activity of CA3 networks,
Fig. 8. Localization of FosB/∆FosB-positive cell nuclei in lateral entorhinal cortex (LEC), medial EC (MEC), and CA3 following counterstaining with tolu-idine blue in sections obtained 1 and 21 d after SE. Note that positive neurons in LEC are maintained only in the superficial layers in epileptic rats studied 21 d after pilocarpine injection. In contrast, neither FosB/∆FosB-positive nuclei nor neuronal elements were detected in MEC layer III both 1 and 21 d after SE. Finally, in the CA3, FosB/∆FosB-positive cells are clearly visible 1 d after SE, whereas no spared neuron appears to be stained 21 d after pilocarpine injection. Scale bar = 100 µm.
the IOS data were supported by the pattern of FosB/∆FosB immunostaining that also provided evidence for a decreased activation of CA3 neurons. Genes belonging to the fosB family, similarly to
c-fos, are induced by a variety of factors, including
stress, drug treatments and convulsions (McClung et al., 2004). Recent evidence suggests that similar stimuli induce c-fos with a threshold lower than that required for fosB (Ji et al., 2005). Thus c-Fos is an effective marker but presents the disadvantage of
Fig. 9. Histopathological analysis of cell damage in the hippocampal formation. Photomicrographs of Fluoro-Jade-stained degenerating cells, 24 h after a pilocarpine injection are respectively shown in the CA3 (A) and CA1
(B) hippocampal subfields, and medial entorhinal cortex (MEC) (C). Note that few positive cells are detected in CA3 and CA1 compared with EC. The histogram in (D) illustrates Fluoro-Jade-positive neurons counted in CA1, CA3, hilus and dentate gyrus (DG-H), subiculum, and EC, expressed by the sampled area (cells/mm2). The most
damaged regions appeared to be MEC, lateral EC (LEC) and DG-H, in which Fluoro-Jade-positive cells scored three to fourfold higher than in the hippocampal subfields. Toluidine blue-stained sections of the CA3 subfield from nonepileptic control (NEC) and pilocarpine-treated epileptic rats, obtained 3 d after status epilepticus (SE), are
shown in (E). Note the presence of an infiltrate in all layers of the pilocarpine-treated CA3 subfield. (F) Neuronal
counts performed in the pyramidal layer of NEC (n= 6) and pilocarpine-treated rats 1 and 3 d after SE (n= 5 and
6, respectively). Asterisk indicates p < 0.05 as established by using one-way analysis of variance (ANOVA) and post hoc Tukey’s test for multiple comparisons. Scale bars = 200 µm.
CA3 Hypoactivity in Temporal Lobe Epilepsy 339 a rapid turn over (Chase et al., 2005). At variance,
FosB-related proteins tend to accumulate in neuronal nuclei with repeated stimulations, especially
∆FosB35-37 phosphorylated isoforms (McClung et al., 2004). This phenomenon has been exploited to map neuronal networks recruited by repeated seizure (Morris et al., 2000; Mohapel et al., 2001). However, when using a model based on SE induc-tion, the detection of long-lasting antigens such as the stable ∆FosB35-37 isoforms does not allow to distinguish neuronal networks activated by the convulsant injection from those recruited by sub-sequent spontaneous seizures. This was not the case in our study, since a different pattern of immuno-labeling emerged in the hippocampal–EC slices of pilocarpine-treated epileptic stained with the two FosB/∆FosB antibodies: the antibody raised against the FosB amino terminus gave a fainter staining and reproduced the localization of neuronal acti-vation found by IOS imaging, whereas the other raised against the central domain labeled also CA3 pyramidal neurons, suggesting a very different affin-ity for the various FosB-related proteins.
We have also discovered, with the antibody directed toward the amino terminus, that the pat-tern of FosB/∆FosB distribution occurring in vivo in CA3, 3 wk after SE was remarkably different from what was observed 1 d after pilocarpine injection since at that time the hippocampal area was heav-ily stained. These findings strongly suggest that this antibody only stained the transient FosB/∆FosB iso -forms as their detection in tissue is limited to approx 4 d from the induction (Chen et al., 1997) and could not be induced in the absence of further seizures. Accordingly, a progressive decrease in FosB/∆FosB immunoreactivity occurred in all the previously positive regions (including EC, subiculum, hip-pocampus proper and dentate gyrus) during the 1st wk after SE. In contrast, no positive cell nuclei were detected in MEC layer III neither 1 nor 21 d after SE, suggesting that the absence of immunolabeling could be explained by the extensive cell loss demon-strated in this region (Du et al., 1995). This hypoth-esis was then confirmed by Fluoro-Jade staining, which showed a very high number of positive cells in the layer III of this region, already 1 d after SE. At variance, in CA3 the Fluoro-Jade staining revealed a number of necrotic neurons similar to that found in CA1 and subiculum. In line with these data, histological analysis of toluidine blue-stained
sections showed a limited cell loss in CA3 of pilocarpine-treated rats until 3 d after SE.
Although we did not evaluate quantitatively the neuronal loss 3 wk after SE, several studies have demonstrated a moderate cell loss in the CA3 hip-pocampal subfield of pilocarpine-treated rats (Turski et al., 1983; Esclapez et al., 1999; André et al., 2000;
Fabene et al., 2003), that we previously found to be around 30% of NEC counts (Liu et al., 1994). By coun-terstaining FosB/∆FosB-immunoreacted sections, we demonstrated that neurons still populating the CA3 pyramidal layer were negative to fosB markers.
This finding was in contrast with the pattern of neu-ronal labeling observed in other partially damaged areas, such as subiculum and CA1. Surprisingly, even more severed areas, such as LEC superficial layers, stained positively to the antibody raised against the FosB amino terminus, both 1 and 21 d after SE. These contrasting findings suggest that the poor staining found by FosB/∆FosB aintibodies in some limbic regions is explained by cell depletion in some cases (such as for MEC layer III), although in the other cases it is probably related to a reduced probability of neuronal activation. This hypothesis is supported by the IOS data when showing a low excitability of CA3 networks to chemical (4AP) or electrical stim-ulation (in the angular bundle or in dentate gyrus). In line with this prediction, evidence for a decreased excitatory transfer from mossy fibers to CA3 pyra-midal cells was found in the kainate (Goussakov et al., 2000) and kindling (Gutierrez, 2003) models. Our results also suggest a possible way by which epileptic discharges can diffuse through hip-pocampal networks of pilocarpine-treated epileptic rats. Pharmacologically induced ictal activity is maintained in normal mouse hippocampal–EC slices after surgical isolation from the CA3 region through the temporoammonic path (Barbarosie and Avoli, 1997; Barbarosie et al, 2000). This pathway also sustains epileptiform activity in hippocampal–EC slices from pilocarpine-treated mice (D’Antuono et al., 2002) and rats (Wozny et al., 2005). Such evi-dence supports the view that seizures in MTLE may result from direct synaptic transmission from the EC to subiculum and CA1 (Avoli et al., 2002). In our study, when analysed in vitro, the subicu-lum of pilocarpine-treated rat slices produced IOS changes that were as robust as those detected in the dentate area, the gate of the trisynaptic circuit (Witter et al., 1989; Gloor, 1997). In addition,
FosB/∆FosB immunoreactivity was clearly detected both in CA1 and subiculum and, in the latter, we did not detect the same decreasing trend observed in other limbic areas during the latent period (in which seizures are not manifested).
Projections to the hippocampus originate from the EC superficial layers (seeWitter et al., 1989). In par-ticular, stellate cells, which are the main cell type in layer II in MEC as well as in the discontinuous layer IIa in LEC (Kohler, 1988), give origin to the perforant path that reaches dentate gyrus and CA3 pyramidal cells in rats (Witter et al., 1989). The EC superficial layers also innervate CA1 and subiculum through the temporoammonic projection that mainly arises from layer III neurons (Witter et al., 1989; Naber et al., 2001). Accordingly, LEC superficial layer cells gen-erated intense IOSs and overexpressed FosB/ ∆FosB-related proteins in layer IIb, which is composed by densely packed pyramidal cells that project to the subiculum as well as to extrahippocampal structures, such as the piriform cortex (Kohler, 1988). Hence, functionally active EC outputs to the hippocampal formation in pilocarpine-treated epileptic rats may arise from LEC superficial layers (Witter et al., 1988) that are in turn re-excited by subiculum/CA1 out-puts. This modality of network activity is supported by the early detection of IOS in the subiculum of pilo-carpine-treated epileptic slices stimulated in the angular bundle.
In conclusion, hippocampal network activity appears to be reorganized at a time when spontaneous seizures appears in pilocarpine-treated rats, present-ing a preferential flow of neuronal activation through the monosynaptic temporoammonic pathway and low activity of CA3 pyramidal neurons, which rep-resent a critical step in the trisynaptic pathway.
Ac
knowledgments
This work was supported by the Italian Ministry
of Education, University and Research (Research Project of Relevant National Interest-PRIN2003), the Canadian Institutes of Health Research (Grant MT-8109), and the Savoy Foundation.
Refer
ences
Andersson M., Hilbertson A., and Cenci M. A. (1999) Striatal fosB expression is causally linked with
L-DOPA-induced abnormal involuntary
move-ments and the associated upregulation of striatal prodynorphin mRNA in a rat model of Parkin-son’s disease. Neurobiol. Dis.6,461–474.
André V., Ferrandon A., Marescaux C., and Nehlig A. (2000) The lesional and epileptogenic conse-quences of lithium-pilocarpine-induced status epilepticus are affected by previous exposure to isolated seizures: effects of amygdala kindling and maximal electroshocks. Neuroscience99,469–481.
Andrew R. D., Adams J. R., and Polischuk T. M. (1996) Imaging kainate and NMDA-induced intrinsic optical signals from the hippocampal slice. J. Neur o-physiol.76,2707–2717.
Avoli M., D’Antuono M., Louvel J., et al. (2002) Net-work and pharmacological mechanisms leading to epileptiform synchronization in the limbic system. Prog. Neurobiol.68,167–207.
Barbarosie M. and Avoli M. (1997) CA3-driven hippocampal-entorhinal loop controls rather than sustains in vitro limbic seizures. J. Neurosci. 17,
9308–9314.
Barbarosie M., Louvel J., Kurcewicz I., and Avoli M. (2000) CA3-released entorhinal seizures disclose dentate gyrus epileptogenicity and unmask a temporoammonic pathway. J. Neurophysiol.83,
1115–1124.
Barbarosie M., Louvel J., D’Antuono M., Kurcewicz I., and Avoli M. (2002) Masking synchronous GABA-mediated potentials controls limbic seizures.
Epilepsia 43, 1469–1479.
Bartolomei F., Wendling F., Bellanger J. J., Regis J., and Chauvel P. (2001) Neural networks involving the medial temporal structures in temporal lobe epilepsy. Clin.Neurophysiol.112,1746–1760.
Biagini G., Pich E. M., Carani C., et al. (1993) Indole-pyruvic acid, a tryptophan ketoanalogue, antag-onizes the endocrine but not the behavioral effects of repeated stress in a model of depression. Biol. Psychiatry33,712–719.
Biagini G., Babinski K., Avoli M., Marcinkiewicz M., and Sequela P. (2001) Regional and subunit-specific downregulation of acid-sensing ion chan-nels in the pilocarpine model of epilepsy. Neur o-biol. Dis.8,45–58.
Bragdon A. C., Kojima H., and Wilson W. A. (1992) Suppression of interictal bursting in hippocam-pus unleashes seizures in entorhinal cortex: a proepileptic effect of lowering [K+]o and raising
[Ca2+]
o. Brain Res. 590, 128–135.
Chase T. D., Carrey N., Brown R. E., and Wilkinson M. (2005) Methylphenidate differentially regulates
CA3 Hypoactivity in Temporal Lobe Epilepsy 341 c-fos and fosB expression in the developing rat
stria-tum. Dev. Brain Res.157,181–191.
Chen J., Kelz M. B., Hope B. T., Nakabeppu Y., and Nestler E. J. (1997) Chronic Fos-related antigens: stable variants of ∆FosB induced in brain by chronic treatments. J.Neurosci.17,4933–4941.
D’Antuono M., Benini R., Biagini G., et al. (2002) Limbic network interactions leading to hyperexcitability in a model of temporal lobe epilepsy. J. Neur o-physiol.87,634–639.
D’Arcangelo G., Tancredi V., and Avoli M. (2001) Intrin-sic optical signals and electrographic seizures in the rat limbic system. Neurobiol. Dis.8, 993–1005.
D’Arcangelo G., Panuccio G., Tancredi V., and Avoli M. (2005) Repetitive low-frequency stimulation reduces epileptiform synchronization in limbic neuronal networks. Neurobiol. Dis.19,119–128. Dalby N. O. and Mody I. (2001) The process of
epilep-togenesis: a pathophysiological approach. Cur. Op. Neurol.14,187–192.
de Curtis M. and Avanzini G. (2001) Interictal spikes in focal epileptogenesis. Prog. Neurobiol. 63,
541–567.
Du F., Eid T., Lothman E. W., Köhler C., and Schwarcz R. (1995) Preferential neuronal loss in layer III of the medial entorhinal cortex in rat models of tem-poral lobe epilepsy.J. Neurosci.15,6301–6313.
Esclapez M., Hirsch J. C., Ben-Ari Y., and Bernard C. (1999) Newly formed excitatory pathways provide a substrate for hyperexcitability in experimental temporal lobe epilepsy. J. Comp. Neurol.408,449–460.
Fabene P. F., Marzola P., Sbarbati A., and Bentivoglio M. (2003) Magnetic resonance imaging of changes elicited by status epilepticus in the rat brain: diffusion-weighted and T2-weighted images, regional blood volume maps, and direct correla-tion with tissue and cell damage. Neuroimage18,
375–389.
Gloor P. (1997) The Temporal Lobe and Limbic System. Oxford University Press, New York.
Goussakov I. V., Fink K., Elger C. E., and Beck H. (2000) Metaplasticity of mossy fiber synaptic transmission involves altered release probability. J. Neurosci.20,
3434–3441.
Gutierrez R. (2003) The GABAergic phenotype of the “glutamatergic” granule cells of the dentate gyrus.
Prog. Neurobiol.71,337–358.
Hauser W. A. and Kurland L. T. (1975) The epidemi-ology of epilepsy in Rochester, Minnesota, 1935 through 1967. Epilepsia 16, 1–66.
Jarvis C. R., Lilge L., Vipond G. J., and Andrew R. D. (1999) Interpretation of intrinsic optical signals
and calcein fluorescence during acute excitotoxic insult in the hippocampal slice. Neuroimage 10,
357–372.
Jefferys J. G. (1999) Hippocampal sclerosis and tem-poral lobe epilepsy : cause or consequence? [Edi-torial]. Brain 122, 1007–1008.
Ji L. L., Fleming T., Penny M. L., Toney G. M., and Cunningham J. T. (2005) Effects of water depriva-tion and rehydradepriva-tion on c-Fos and FosB staining in the rat supraoptic nucleus and lamina terminalis region. Am. J. Physiol. Regul. Integr. Comp. Physiol.
288,R311–R321.
Kohler C. (1988) Intrinsic connections of the retro-hippocampal region in the rat brain. III. The lat-eral entorhinal cortex. J. Comp. Neurol. 271,
208–228.
Köhling R., Lucke A., Nagao T., Speckmann E. J., and Avoli M. (1995) Extracellular potassium elevations in the hippocampus of rats with long-term pilo-carpine seizures. Neurosci. Lett.201,87–91.
Liu Z., Nagao T., Desjardins G. C., Gloor P., and Avoli M. (1994) Quantitative evaluation of neuronal loss in the dorsal hippocampus in rats with long-term pilocarpine seizures. Epilepsy Res. 17, 237–247.
MacVicar B. and Hochman D. (1991) Imaging of synap-tically evoked intrinsic optical signals in hippo-campal slices. J. Neurosci.11,1458–1469.
Mathern G. W., Babb T. L., and Armstrong D. L. (1997) Hippocampal sclerosis. In: Engel J, Pedley T. A., eds. Epilepsy: A Comprehensive Textbook. Philadelphia (PA): Lippincott-Raven; 1997, pp. 133–155.
McClung C. A., Ulery P. G., Perrotti L. I., Zachariou V., Berton O., and Nestler E. J. (2004) DeltaFosB: a molecular switch for long-term adaptation in the brain. Mol.Brain Res.132,146–154.
McCormick D. A. and Contreras D. (2001) On the cel-lular and network bases of epileptic seizures. Annu. Rev. Physiol.63,815–846.
McNamara J. O. (1994) Cellular and molecular basis of epilepsy. J. Neurosci.14,3413–3425.
Mikkonen M., Soininen H., Kalvianen R., et al. (1998) Remodeling of neuronal circuitries in human tem-poral lobe epilepsy: increased expression of highly polysialylated neural cell adhesion molecule in the hippocampus and the entorhinal cortex. Ann. Neurol.44,923–934.
Mohapel P., Zhang X., Gillespie G. W., et al. (2001) Kin -dling of claustrum and insular cortex: comparison to perirhinal cortex in the rat. Eur. J. Neurosci.13,
Morris T. A., Jafari N., and DeLorenzo R. J. (2000) Chronic DeltaFosB expression and increased AP-1 transcription factor binding are associated with the long term plasticity changes in epilepsy. Mol. Brain. Res.79,138–149.
Naber P. A., Lopes da Silva F. H., and Witter M. P. (2001) Reciprocal connections between the entorhinal cortex and hippocampal fields CA1 and the subiculum are in register with the projec-tions from CA1 and the subiculum. Hippocampus
11,99–104.
Nagao T., Avoli M., and Gloor P. (1994) Interictal dis-charges in the hippocampus of rats with long-term pilocarpine seizures. Neurosci. Lett.174,160–164.
Nagao T., Alonso A., and Avoli M. (1996) Epileptiform activity induced by pilocarpine in the rat hippocampal–entorhinal slice preparation. Neur o-science72,399–408.
Paxinos G. and Watson C. (1998) The Rat Brain in Stereo-taxic Coordinates. Fourth ed. Academic, San Diego. Racine R. J. (1972) Modification of seizure activity by electrical stimulation. II. Motor seizure. Electr o-encephalogr. Clin. Neurophysiol.32,281–294.
Rutecki P. A., Grossman R. G., Armstrong D., and Irish-Loewen S. (1989) Electrophysiological connections between the hippocampus and entorhinal cortex in patients with complex partial seizures. J. Neur o-surg. 70, 667–675.
Schmued L. C., Albertson C., and Slikker W. Jr. (1997) Fluoro-Jade: a novel fluorochrome for the sensi-tive and reliable histochemical localization of neuronal degeneration. Brain Res. 751, 37–46.
Spencer S. S. and Spencer D. D. (1994) Entorhinal– hippocampal interactions in medial temporal lobe epilepsy. Epilepsia 35, 721–727.
Swartzwelder H. S., Lewis D. V., Anderson W. W., and Wilson W. A. (1987) Seizure-like events in brain slices: suppression by interictal activity. Brain Res.
410,362–366.
Traynelis S. F. and Dingledine R. (1988) Potassium-induced spontaneous electrographic seizures in the rat hippocampal slice. J. Neurophysiol.59,259–276.
Turski W. A., Cavalheiro E. A., Schwarz M., Czuczwar S. J., Kleinrok Z., and Turski L. (1983) Limbic seizures produced by pilocarpine in rats: behav-ioral, electroencephalographic and neuropatho-logical study. Behav. Brain Res.9,315–335.
Weissinger F., Buchheim K., Siegmund H., and Meierkord H. (2005) Seizure spread through the life cycle: optical imaging in combined brain slices from immature, adult, and senile rats in vitro.
Neurobiol. Dis.19,84–95.
Werme M., Messer C., Olson L., et al. (2002) ∆FosB r eg-ulates wheel running. J.Neurosci.22,8133–8138.
Wiebe S., Blume W. T., Girvin J. P., and Eliasziw M. (2001) A randomized, controlled trial of surgery for temporal lobe epilepsy. N. Engl. J. Med. 345, 311–318.
Wilson W. A., Swartzwelder H. S., Anderson W. W., and Lewis D. V. (1988) Seizure activity in vitro: a dual focus model. Epilepsy Res. 2, 289–293.
Witter M. P., Griffioen A. W., Jorritsma-Byham B., and Krijnen J. L. (1988) Entorhinal projections to the hippocampal CA1 region in the rat: an underesti-mated pathway. Neurosci. Lett.85,193–198.
Witter M. P., Groenewegen H. J., Lopes da Silva F. H., and Lohman A. H. M. (1989) Functional organi-zation of the extrinsic and intrinsic circuitry of the parahippocampal region. Prog. Neurobiol. 33,
161–253.
Wozny C., Gabriel S., Jandova K., Schulze K., Heinemann U., and Behr J. (2005) Entorhinal cortex entrains epileptiform activity in CA1 in pilo-carpine-treated rats. Neurobiol. Dis.19,451–460.
Wu K. and Leung L. S. (2001) Enhanced but fragile inhibition in the dentate gyrus in vivo in the kainic acid model of temporal lobe epilepsy: a study using current source density analysis. Neuroscience104,
379–396.
Wu K. and Leung L. S. (2003) Increased dendritic excitability in hippocampal CA1 in vivo in the kainic acid model of temporal lobe epilepsy: a study using current source density analysis.