Università degli Studi di Messina
PhD Course in “Medical and Surgical Biotechnologies”
XXIX Cycle
FIP2 promotes E. coli-induced IFN-β
production and phagocytosis, through its
interaction with TRAM
Federica Agliano
Supervisor: Coordinator:
Prof. Giuseppe Teti Prof. Giovanni Raimondo
Co-Supervisor:
Dr. Harald Husebye
i
Acknowledgements
All the experiments shown in this thesis have been carried out during my staying in Trondheim (Norway), at the Centre of Molecular Inflammation Research (CEMIR), at the Norwegian University of Science and Technology (NTNU).
I would like to thank my supervisor Prof. Giuseppe Teti for giving me the opportunity to spend most of my PhD abroad and for his always-welcome support and advice during these months.
Thanks to Prof. Diana Teti for allowing me to work with her team during the early stage of my PhD and for her lovely encouragements after my departure.
I would like to thank my co-supervisor Dr. Harald Husebye for being such an important guide, for encouraging and supporting me during the work in the lab as well as during this thesis writing.
Moreover, I would like to express all my gratitude to the CEMIR Director, Prof. Terje Espevik who gave me the opportunity to join the CEMIR and to have access to all its super furnished labs! It was a very positive and formative experience for me.
I am grateful to Dr. Astrid Skjesol and Dr. Mariia Yurchenko for teaching me a lots of lab techniques throughout these months, having the patience to answer to all my questions and giving me always very useful advice. I have learnt a lot from you!
A special thank also to all CEMIR Engineers, especially Unni and Liv: your help in the lab has been very precious.
And finally, last but definitely not least, I would like to say a big thanks to my family for their unconditional love and support and for their always encouraging words even during my most stressful and difficult days.
ii
Abstract
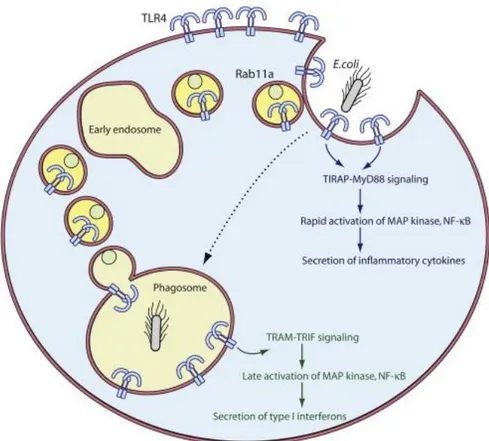
The Toll-like receptor 4 (TLR4) senses LPS from Gram-negative bacteria and triggers two distinct signaling pathways by the use of distinct pairs of signaling adaptors. Following activation at the plasma membrane the adaptors pair TIRAP and MyD88 are immediately recruited, leading to induction of pro-inflammatory cytokines. However, TLR4 located on the phagosomal membrane induces the type I interferons such as IFN-β, through the adaptor pair TRAM and TRIF. The small GTPase Rab11a is involved in the TLR4-induced IFN- β production, delivering TLR4 and TRAM to E. coli phagosomes. Here we report that the Rab11a effector protein, Rab11-FIP2, binds TRAM promoting its delivery to forming E. coli phagosomes and that both Rab11-FIP2 and TRAM are involved in phagocytosis of E. coli in human macrophages. These results show that FIP2 and TRAM are effectors involved in the E. coli-induced IFN- β induction and phagocytosis, which may point at new strategies for treatment Gram-negative induced inflammation that in severe cases may result in the development of sepsis.
iii
Table of Contents
Acknowledgements ... i Abstract ... ii Abbreviations ... v 1 INTRODUCTION ... 11.1 The innate immune system ... 1
1.2 Phagocytosis ... 2
1.3 Toll-like receptors (TLRs) ... 5
1.4 Toll-like receptor 4 (TLR4) ... 8
1.4.1 TLR4 trafficking ... 9
1.4.2 The TLR4-activated MyD88-dependent pathway ... 9
1.4.3 TLR4 internalization and the TRAM-TRIF-dependent pathway ... 11
1.4.4 The TLR4 adaptor protein TRAM ... 13
1.5 The role of Rab11-FIP2 as effector protein of the Rab11 family ... 14
2 AIMS OF THE THESIS ... 16
3 MATERIALS AND METHODS ... 17
3.1 Cell cultures and their maintenance ... 17
3.2 Differentiation and siRNA treatment ... 18
3.3 Cell stimulation ... 18
3.4 RNA extraction and quantitative real-time PCR ... 19
3.5 Cell-surface receptors analysis ... 20
3.6 Phagocytic Assay ... 20
3.7 Expression vectors and DNA transfection ... 21
3.8 Immunoprecipitation ... 21
3.9 Protein isolation ... 22
3.10 Immunoblotting ... 22
4 RESULTS ... 24
4.1 FIP2 is involved in E.coli induced IFN- signaling downstream of TLR4 ... 24
4.2 FIP2 and TRAM form a complex with Rab11a ... 28
4.3 FIP2 contributes to set the repertoire of surface receptors involved in E. coli uptake in THP-1 cells but not in primary human macrophages ... 30
iv
4.4 FIP2 is involved in phagocytosis of E. coli in human macrophages ... 34
4.5 TRAM, but not MyD88, is involved in E. coli phagocytosis in human macrophages ... 37
5 DISCUSSION ... 43
6 CONCLUSION AND FUTURE PERSPECTIVES ... 47
v
Abbreviations
BSA CD Cdc42 cDNA DAMPs DCs DD domain DMEM DTT E. coli EDTA ERC FACS FCS FcγRs FSC GFP GTP HEK IFN IL IRAKs IRFs IκBα KD LBP LDS LPSBovine serum albumin Cluster of differentiation Cell division control protein 42 Complementary DNA
Damage associated molecular patterns Dendridic cells
Death domain
Dulbecco’s modified Eagle’s medium Dithiothreitol
Escherichia coli
Ethylenediaminetetraacetic acid Endocytic recycling compartment Fluorescence-activated cell sorting Fetal calf serum
Fc gamma receptors Forward scatter
Green fluorescent protein Guanosine triphosphate Human Embrionic Kidney Interferferon
Interleukin
IL-1 receptor-associated kinases IFN regulatory factors
NF-κB inhibitor, alpha Knock down
LPS binding protein Lithium dodecyl sulfate Lipopolysaccharide
vi LRR MAPKs MD2 MFI MHC MyD88 NF-κB NLRs NS RNA PAMPs PBMCs PBS PCNA PMA PRRs PtdIns(3,4,5)P3 PtdIns(4,5)P2 (PIP2) q-PCR Rab GTPase Rab11-FIPs Rac 1 RBD RLRs S. aureus SD siRNA SSC TBK1 TBP TBS TIR domain
Leucine rich repeats (LRR)
Mitogen-activated protein kinases Myeloid differentiation factor 2 Median fluorescence intensity Major histocompatibility complex
Myeloid differentiation primary response gene88 Nuclear factor-κB
NOD (nucleotide-binding oligomerization domain)likereceptors Non-silencing RNA oligo
Pathogen associated molecular patterns Peripheral blood mononuclear cells Phosphate-buffered saline
Proliferating Cell Nuclear Antigen Phorbol 12-myrstate 13-acetate Pattern-recognition receptors
Phosphatidylinositol-3,4,5-trisphosphate Phosphatidylinositol-4,5-bisphosphate Quantitative Polymerase chain reaction Ras-related in brain
Rab11 family interaction protein
Ras-related C3 botulinum toxin substrate 1 Rab11-binding domain
Retinoic acid-inducible gene (RIG)-I-like receptors
Staphylococcus aureus
Standars deviation Silencing RNA Side scatter
TANK binding kinase 1 TATA-Box binding Protein Tris Buffered Saline
vii TIRAP TLRs TMED7 TNF TRAM TRIF WT YFP
TIR-containing adaptor protein Toll-like receptors
Transmembrane emp24 domain-containing protein 7 Tumor necrosis factor
TRIF-related adaptor molecule TIR-containing adaptor-inducing Wild type
1
1 INTRODUCTION
1.1 The innate immune system
Human beings are colonized by a large variety of microbes which exist in close association with their hosts.
The consequence of such colonization can affect the host’s health and depends on the microbial adaptation strategy: if the microbes provide a range of benefits to the host the effect can be positive (e.g. intestinal microbiota), but if microbes are harmful to the host they are called pathogens and can cause infectious diseases [1]. A third group of microbes are called opportunistic pathogens, which are not dangerous for healthy people but can affect individuals who are weakened or immunosuppressed, thus many factors can contribute to infection.
Mammals have evolved different defense mechanisms that are able to counteract microbial infections and these are traditionally dividend in to two types of defense, innate and adaptive immunity [1].
Innate immunity is the first line of defense against invading microbes and its response is immediate. As postulated by Janeway, already 27 years ago, the innate immune system is regulated by germline-encoded pattern-recognition receptors (PRRs) which recognize conserved and invariant features of microorganisms [2], by sensing pathogen associated molecular patterns (PAMPs). PAMPs are molecules with essential roles in microbial physiology, such as components of the cell walls (lipopolysaccharides, lipoproteins, lipotheicoic acid, etc.) proteins or nucleic acids [1]. Moreover, it has been shown that PRRs can also recognize endogenous molecules released from cells of damaged tissues,
known as damage associated molecular patterns (DAMPs)[3].
Several classes of PRR families have been identified [4] and divided into two main classes: transmembrane proteins, such as Toll-like receptors (TLRs) and C-type lectin receptors (CLRs) expressed at the cell surface and/or in endosomal compartments; and cytoplasmic proteins such as the Retinoic acid-inducible gene (RIG)-I-like receptors
(RLRs) and NOD-like receptors (NLRs)[5]. Another feature of the innate immunity is the
2
which assemble in the cytosol upon a PAMP or DAMP stimulus and activate pro-inflammatory caspases 1 (canonical inflammasome) and 11 (non-canonical inflammasome). Activation of these proteases by auto-proteolytic cleavage leads to the generation of biologically active IL-1β and IL-18 from their respective precursors and to the death of the cell by pyroptosis [6].
PRRs are expressed in both immune cells (e.g. macrophages, dendritic cells and B- and T-cells) as well as non-immune cells, such as fibroblasts and epithelial cells [3, 7]. Innate immune cells directly kill pathogens through phagocytosis or inducing the production of cytokines, chemokines and type I interferons (IFN-α or IFN-β), which lead to elimination of the pathogens [1, 8-10] and development of the long-lasting pathogen-specific adaptive immune responses. Adaptive immune recognition is mediated by B- and T-cells, which leads to pathogen-specific immunity, thanks to somatic rearrangement of antigen receptors [11], a process that provide an extremely diverse set of receptors. Even though the innate immunity is not as specific as the adaptive immunity, it can discriminate between self and non-self and if this discrimination is not perfect, it can lead to the development of autoimmune diseases [12]. Moreover, the adaptive immune response leads to an antigen-specific activation of the cells belonging to the innate immunity system. This activation is more efficient than direct activation and therefore a constant interaction between innate and adaptive immunity is often required for a complete pathogen clearance [1].
1.2 Phagocytosis
Phagocytosis is a very complex process that contributes to host defense [13] and plays a crucial role in immune system. Phagocytosis was first observed by Elie Metchnikoff in 1882 and for this he was awarded the Nobel Prize in Physiology/Medicine in 1908. Phagocytosis can be defined as the process by which cells ingest particles larger than 0.5 µm, inside their plasma-membrane [13]. This process appeared very early during evolution, since unicellular organisms use it as source of nourishment [14].
By contrast, in Metazoans, phagocytosis is mainly involved in development, tissue homeostasis maintenance, and immunity [15].
3
Thus, cells can be divided into professional phagocytes such as neutrophils, macrophages, DCs and osteoclasts, and non-professional or facultative phagocytes such as epithelial cells, which are capable to engulf particles only during certain, often pathological, conditions [13]. Phagocytes belong to the innate arm of immunity and are able to recognize both altered self-particles, such as apoptotic cells and non-self particles such as pathogens and potential pathogenic microbes, discerning from commensals [13]. Moreover, some phagocytes, macrophages and DCs in particular, use phagocytosis to internalize pathogens for degradation in phagosomes and loading of antigens for antigen presentation on MHC I and II molecules [16], making phagocytosis a bridging process between the innate and adaptive immunity [17]. In order to recognize their targets, immune cells possess a unique repertoire of receptors, which are sensitive to particular and definite molecules [14].
Interaction between the phagocytic cells and pathogens can occur directly through PRR, which recognize PAMPs, or indirectly, through opsonisation. Opsonins are host factors, such as immunoglobulin G (IgG) or components of the complement cascade that bind to the surface of the pathogen, leading to a recognition by phagocytic receptors such as CD11b (also known as complement receptor 3, CR3) and Fcγ receptors (FcγRs) respectively [18]. Once activated, these receptors undergo clustering that triggers downstream signaling transduction which culminates with the engulfment of the pathogen [19]. Even though signal transduction is not completely understood, remodeling of actin filaments plays a central role. This is controlled by small GTPases proteins belonging to the Rho family such as Rac1 and Cdc42, that control lamellipodia and filopodia, respectively [19]. Moreover, also phosphoinositides such as
phosphatidylinositol-4,5-bisphosphate [PtdIns(4,5)P2] and
phosphatidylinositol-3,4,5-trisphosphate [PtdIns(3,4,5)P3] are important for actin remodeling and phagocytosis
[20]. Thus, the recruitment of actin, Rac1, Cdc42 and molecules such as Myosin X [20] and the Wiskott-Aldrich syndrome protein (WASP) [18] lead to the formation of the phagocytic cup and pseudopod-like structures and regulate the engulfment of the pathogen [14]. Thereby, the formed phagosome undergoes a series of fusion and fission events involving cytosolic organelles, which lead to phagosome maturation [13].
4
It’s still unclear whether a complete fusion between membranes or the so called ‘kiss and run’ model is involved or whether a combination of both occurs [20].
During these events the phagosomal membrane fuses in sequence with early endosomes, late endosomes and eventually with lysosomes [21], which lead to the phagolysosome formation, through a Rab7a-dependent process [20] (Figure 1).
Figure 1. Stages of phagosomal maturation. Early (a), intermediate (b) and late (c) phagosomes,
that culminate with the formation of phagolysosomes (d). Figure taken from Flannagan et al., 2009 [20].
Furthermore, during the maturation events, the phagolysosome acquires different microbicidal characteristics, such as lumen acidification, synthesis of reactive oxygen species (ROS), reactive nitrogen species (RNS) and synthesis of antimicrobial proteins and peptides [20]. Lumen acidification, with a pH around 4.5, prevents microbial growth [22], impairing pathogen metabolism and activating many hydrolytic enzymes. ROS are generated by NOX2 NADPH oxidase, whereas RNS are generated by inducible nitric oxide synthase (iNOS) and both of them act to cause an oxidative damage in pathogen DNA, proteins and lipids [20]. Antimicrobial proteins and peptides are able to impair growth or the integrity of the microorganism, for example by limiting the presence of nutrients inside the phagosome [20].
Nevertheless, several pathogens have evolved diverse strategies in order to survive host defense, eluding one of these features [23-25] and some of them can even replicate
5
inside phagocytes [20]. However, when phagocytes can successfully kill the pathogens, phagolysosome resorption occurs and the products digestion are either moved into the cytoplasm (if they are beneficial to the host cell) or exported out of the cell by exocytosis [14].
1.3 Toll-like receptors (TLRs)
Toll-like receptors family is the best characterized among PRRs and is able to sense invading pathogens at the cell surface and in intracellular compartments upon internalization [8], or molecules released from damaged cells [3]. The TLRs were discovered almost 20 years ago and led to increased focus on innate immunity, seen at that time as the less important and interesting part of the immune system [26]. In 2011 the key investigators, Hoffman and Beutler, were awarded the Nobel Prize in Physiology/Medicine. The first human TLR discovered was TLR4, homologue to the Toll receptor in the fruitfly Drosophila melanogaster a decade earlier [27]. In the fly, the Toll protein was known to regulate the dorsoventral polarity during embryonic development, but in 1996 Toll was shown to be also involved in immunity towards fungal infections in the fly [28]. Thus, since 1997, 10 different functional TLRs in humans and 13 in mice have been identified [4, 8].
All TLRs are type I membrane glycoproteins and consist of an extracellular domain rich in leucine repeats (LRR), a transmembrane domain and a cytoplasmic domain containing the Toll-Interleukin-1 receptor domain (TIR) [29]. The extracellular LRR domain (or ectodomain) folds into a characteristic solenoid structure and consist of 16–28 tandem repeats of the LRR motif [30, 31]. It is involved in the recognition of ligands such as the lipids LPS (lipopolysaccharide) and LTA (lipoteichoic acid), proteins flagellin and porin, sugar zymosan, nucleic acids CpG-containing DNA and single or double stranded RNA and derivatives of proteins or peptides [8].
By contrast, the TIR domain, which got this name because of its homology with the cytoplasmic region of the IL-1 receptor [29, 32], consists of approximate 150 amino acids. This domain is critical for the downstream signal transduction.
6
Several TIR-domain-containing adaptors have been identified: MyD88 (myeloid differentiation primary response gene88), TIRAP [TIR-containing adaptor protein, also known as MAL (MyD88-adaptor-like)], TRIF [TIR-containing adaptor-inducing interferon-β, also known as TICAM1 (TIR-domain containing adaptor molecule 1)], TRAM (TRIF-related adaptor molecule, also known as TICAM2) and SARM1 (sterile-α- and armadillo-motif-containing protein 1). Moreover, recently, a protein termed BCAP (B cell adaptor for PI3K; also known as PIK3AP1) has been proposed as a sixth TIR adaptor molecule [33, 34]. These adaptors, in turn, can activate MAPKs (mitogen-activated protein kinases) and transcription factors, such as NF-κB (nuclear factor-κB) through the MyD88-dependent pathway, or IRFs (IFN regulatory factors) in order to induce the type I interferons (IFNs) production through the TRAM-TRIF-dependent pathway (Figure 2). In addition, the different TLRs show a different localization within the cell, depending on the type of PAMAPs/DAMPs they recognize. Thus, TLR1, TLR2, TLR5 and TLR6 are expressed on the plasma membrane, whereas TLR3, TLR7, TLR8 and TLR9 are expressed on the endosomal or endolysosomal membranes. TLR4 is expressed on both locations and since it has a unique signaling among TLRs that will be separately discussed below. Exposition to their specific ligands induces TLRs dimerization: TLRs on the cell surface
can homo- or heterodimerize. TLR5 can homodimerize [35], whereas TLR2
heterodmerize with TLR1 or TLR6 when it binds triacyl or diacyl lipopeptides, respectively [36, 37]. On the contrary, almost all the members of the endosomal TLR subfamily are synthesized as stable preformed dimers [38, 39]. TLR3 is the exception, since it is a monomer when inactive [30].
7
Figure 2. Summary of the TLRs family signaling pathways and TLR localization with respective
ligands. Upon stimulation, MyD88- and TRAM-TRIF-dependent pathways can be activated. Figure taken from Gay et al., 2016 [30].
In addition, endosomal TLRs needs a proteolytic cleavage of their ectodomain before efficient binding with their ligands [40, 41]. This process might be necessary in order to give an additional protection from self-nucleic acids, avoiding autoimmune responses.
8
1.4 Toll-like receptor 4 (TLR4)
As mentioned above, TLR4 was the first human TLR to be discovered, showing that it had a homology with the cytosolic domain of the Toll receptor found in Drosophila [28]. TLR4 has an extracellular domain and an intracellular domain, made of 608 and 187 amino acidic residues, respectively. It binds to several types of PAMPs and DAMPs, leading to both infectious and non-infectious inflammatory diseases, such as ischemia/reperfusion injury and neurodegenerative diseases [42]. The first TLR4 ligand to be discovered, and by far the most studied is LPS (also known as endotoxin). LPS is the major component of the outer membrane of Gram-negative bacteria [43, 44]. LPS comprises three parts: O antigen (or O polysaccharide), core oligosaccharide and Lipid A, responsible for most of the toxicity of Gram-negative bacteria. This endotoxin is a strong immunogenic molecule and a high concentration in the blood can lead to septic shock [45].
For a TLR4 ligand-induced activation, a physical association between the extracellular domain of TLR4 and myeloid differentiation factor 2 (MD2) is necessary [46-49]. Moreover LPS needs to bind LBP (LPS binding protein). LBP, a plasma protein which binds the lipid A moiety of LPS, also contributes to the cytokines release in response to LPS [46, 47]. MD2 is a small secreted glycoprotein and it is critical for the LPS to bind TLR4 [48, 49]. After LPS binding, two TLR4/MD2 complexes dimerize, leading to conformational changes of the TLR4 homodimer which allows binding of the TIR-adaptor proteins [30]. Another accessory molecule which enhances LPS sensing is CD14 (cluster of differentiation 14). CD14 is a glycosylphosphatidylinositol (GPI)-linked protein, found on the surface of many TLR4 expressing cells and called mCD14 (membrane-CD14) [50]. A soluble form of CD14 (sCD14) is circulating in the blood and might enhance the cells response to LPS [51]. Its role is to transfer LPS-LBS complex to the TLR4-MD-2 heterodimer [52-54].
TLR4 is the most studied in the TLR family. It engages four TIR domain–containing
adaptors: MyD88, TIRAP, TRIF and TRAM [32] and can induce both MyD88-dependent
9
recruitment of TRAM and TRIF signaling adapters (TRAM-TRIF-dependent pathway) [55]. It can signal from two different location of the cell. The MyD88-dependent pathway starts from the plasma membrane, whereas the TRAM-TRIF-dependent pathway is
activated from the phagosomal membrane [56, 57]. TLR2 was also shown to be able to
recruit the TRAM-TRIF adaptors, however the TRAM-TRIF-mediated responses induced by TLR2 ligands, are weaker compared to TLR4 ligands [58].
1.4.1 TLR4 trafficking
As all TLRs, TLR4 undergoes a highly regulated trafficking through different cellular compartments in order to sustain the signal transduction and regulation. Proper processing in the ER (endoplasmatic reticulum) requires the chaperone molecules, heat shock protein HSP90β1 (also known as endoplasmin, GRP94, GP96 and TRA1) and the protein associated with TLR4 PRAT4A (also known as CNPY3) [59-61]. Moreover, in the ER, the association of TLR4 with MD2 occurs and this step has been demonstrated to be
critical for a correct glycosylation, transport to the plasma membrane and a proper
response to LPS [53, 62, 63]. TLR4 delivery to the plasma membrane might also require the COPII (coat protein complex II) adaptor protein called TMED7 (transmembrane emp24 domain-containing protein 7) [64]. Furthermore several small Rab GTPase (Ras-related in brain) proteins are involved in TLR4 trafficking. Rab10 controls the rate of TLR4 trafficking from the Golgi to the plasma membrane in response to LPS [65], whereas, Rab11a is responsible for TLR4 trafficking from the endocytic recycling compartment (ERC) to the phagosomal membrane [57]. Rab7b is a negative regulator of the TLR4 signaling pathway since it promotes the movement of TLR4 into late endosomes for its degradation [66].
1.4.2 The TLR4-activated MyD88-dependent pathway
After LPS binding and TLR4/MD-2 tetramerization the β2 integrin CD11b, which interact with CD14, leads to the activation of the GTPase ARF6 (ADP ribosylation factor 6) and
10
kinase PI5K (Phosphatiidylinositol 4-phosphate 5-kinase) [67]. PIP2 enrichment at the cell
surface mediates TIRAP recruitment, which has a PIP2 binding domain and can bind TLR4
more easily trough a TIR-TIR interaction. By another TIR-TIR interaction TIRAP, acting as
a “sorting adaptor” can recruit MyD88 to PIP2-rich plasma-membrane subdomains and
facilitates the interaction between TLR4 and MyD88, which can be defined as the “signaling adaptor” [67]. When MyD88 is recruited, MyD88-dipendent pathway can start to signal. Thus, MyD88 triggers, through its DD domain (death domain), IRAK4 (IL-1 receptor-associated kinase 4) which consequently activates IRAK1, inducing its
kinase-activity (akira2004 37). IRAK-1 can be functionally substituted by IRAK-2 and thus these
kinases might have a redundant role in this pathway [68].
Moreover, in vitro studies showed that the MyD88 DD domain forms, in the presence of IRAK4 a heterocomplex called the Myddosome [69]. The Myddosome can be composed of six to eight molecules of MyD88 and four molecules of IRAK4. Whereas a variant Myddosome containing IRAK2 consists of three layers with six MyD88 DDs, four IRAK4 DDs and four IRAK2 DDs, facilitating their interaction and thus their phosphorylation [70]. It seems that the Myddosome might exist even in physiological conditions [71]. The activated IRAKs proteins can associate with the E3 ubiquitin ligase TRAF6 (TNF receptor-associated factor 6). The polyubiquitinated TRAF6 activates the preformed complex composed of the protein kinase TAK1 (transforming growth factor-β-activated kinase 1) and TABs (TAK1-binding proteins) TAB1 and TAB2 or TAB3. This complex can activate the canonical IKK complex (inhibitor of nuclear factor kappa-B kinase complex) or MAPKs (Mitogen-activated protein kinase) [29]. IKK complex (consisting of the two catalytic subunits IKK-α and IKK-β and a regulatory subunit IKK-γ) phosphorylates IκBα (nuclear factor of kappa light polypeptide gene enhancer in B-cells inhibitor, alpha),
leading to its polyubiquitylation and proteasome-mediated degradation. Since IκBα acts
as an inhibitor of the transcription factor NF-κB, after its degradation, NF-κB can be released and translocated to the nucleus, inducing the transcription of inflammatory genes [29]. On the other hand, MAPKs such as ERK (extracellular-signal-regulated kinase), JNK (c-jun N-terminalkinase) and p38 lead to the activation of a second inflammatory transcription factor, AP-1 (activator protein 1) [72].
11
1.4.3 TLR4 internalization and the TRAM-TRIF-dependent pathway
The TRAM-TRIF-dependent pathway signals from the phagosomal membrane [56]. According to the model proposed by Kagan and coworkers, after the immediate MyD88-dependent signal has started, the invagination of the plasma membrane due to the
phagocytic process occurs and PIP2 concentration goes dramatically down, leading to
the release of the TIRAP-MyD88 complex and allowing the TRAM-TRIF complex to bind to the TIR domain of TLR4 on intracellular compartment. This second phase of TLR4-induced signaling leads to the production of type I IFNs [56].
However, another model has been subsequently proposed by Husebye and coworkers who showed that even though in a very early stage of the phagocytic process the TRAM-TRIF-dependent signaling pathway may start with the internalization of TLR4 from the plasma membrane, the major source for phagosomal TLR4 is the ERC [57]. They also demonstrated, as mentioned above, that TLR4 is delivered from the ERC to the phagosomal membrane by the small GTPase Rab11a containing vesicles, promoting the type I IFNs production (Figure 3). Moreover, studies using Dynasore, a dynamin inhibitor, showed that TLR4 internalization is a dynamin-dependent process [56, 73]. It was also demonstrated that TLR4 uptake depends on CD14 by the tyrosine kinase Syk/PLCγ2 regulation [74] and that the involvement of CD11b is required for a proper LPS response [75-77]. Once TLR4 has been engulfed together with its ligand, TRIF is recruited from the cytoplasm by TRAM, which acts as a bridging adaptor, like TIRAP in the MyD88-dependent pathway [56]. TRIF has a critical role in this pathway, shown in TRIF-deficient cells which lose the ability to produce IFN-β [78, 79]. TRIF interacts with
RIP1 (receptor-interacting protein 1) through its C-terminal part [80] and with TRAF6
(TNF receptor associated factor 6) through its TRAF6-binding motif located in its
N-terminal part [81]. Both RIP1 and TRAF6 lead to the activation of the late inflammatory
response [82]. TRIF can also recruit TRAF3 (TNF receptor associated factor 3) which consequently activate IKKε (also known as IKKi) [83, 84] and the IKK-related kinase TBK1 (TANK binding kinase 1). Therefore the formed complex of kinases IKKε-TBK1 phosphorylates IRF3, which dimerizes and translocate into the nucleus.
12
Figure 3. Schematic representation of the two signaling pathways activated by TLR4 and how it
is delivered to the phagosomal membrane by Rab11a positive vesicles. Figure taken from Kagan, based on Husebye et al., 2010 [57].
Once activated IRF3, along with the co-activators p300 and CBP
[cAMPresponsive-element-binding protein (CREB)-binding protein][29], binds to the ISREs (IFN-stimulated
response elements) and activates the transcription of the type I IFNs genes and the chemokine CCL5 (RANTES) [85].
The type I IFNs, IFN-α and IFN-β, make an important link between the innate and adaptive immune response against pathogen microbes. The type I IFNs have mainly been described as anti-viral cytockines, preventing virus replication [86]. However it is now demonstrated that they are produced also in response to bacterial infections, even though their role seems to be controversial, being sometimes beneficial and sometimes detrimental [87, 88]. Indeed they were shown to be involved in suppression of innate cell recruitment and pro-inflammatory response, upon S. aureus infections [89, 90], but
13
on the other hand they are crucial for the host resistance to different bacteria, like group B streptococci, pneumococci and E. coli [91].
Furthermore, it has been showed that the autophagy-related 16-like 1 factor (Atg16L1) negatively regulated the TRIF-dependent signaling pathway suggesting that autophagy might be involved in innate immune regulation [92].
1.4.4 The TLR4 adaptor protein TRAM
TRAM is a TIR-containing adaptor protein used by TLR4 [93] and its role is to function as
a bridging molecule between TLR4 and TRIF[56].
Moreover, it has been shown that upon LPS stimulation, Rab11a plays a crucial role to deliver TRAM from the Golgi to the ERC and subsequently to the endo/phagosomes
[49]. TRAM is a protein made of 235 amino acids, with a myristoylated domain and a
phosphoinositide-binding domain in its N-terminus, and the TIR domain in its C-terminus. The myristoylated domain is necessary for its localization to the plasma membrane, the trans-Golgi-network (TGN) and endosomes and it has been demonstrated to be fundamental for the activation of IRF 3 [56, 94].
Inside TRAM N-terminus, a protein kinase C-ε ( PKCε ) phosphorylation acceptor site has been found, responsible for TRAM phosphorylation (at S16) and its consequent dissociation from the plasma membrane upon LPS stimulation [95].
By contrast, the TIR domain is crucial for the interaction with TRIF and TLR4 TIR domains [32].
Huai and coworkers showed that upon TLR4 activation TRAM undergoes a tyrosine phosphorylation, at Y167 position. This tyrosine is located in the TIR domain and is required for the TLR4-induced IRF3 activation and IFN-β secretion. Furthermore they showed that a protein tyrosine phosphatases (PTP) called PTPN4 (PTP non-receptor type 4) is a negative regulator of the TRAM-TRIF pathway, attenuating TRAM Y167 phosphorylation and thus its cytoplasm translocation and inhibiting the TRAM–TRIF
14
Moreover, two TRAM motifs seem to be crucial for the TRAM-TRIF signaling pathway
activation: the E87/E88/D89 motif, which regulates the bond of TRAM to TRIF [97] and
the D91/E92 motif, which is critical for IFN-β activation [98].
An alternative splice variant of TRAM, called TAG (TRAM adaptor with Gold domain), a protein which contains a GOLD domain instead of the myristoilated domain has been shown to sequester TRIF from TRAM, acting as a negative regulator of the TRAM-TRIF signaling cascade and this disruption is TMED7-mediated [99, 100].
1.5 The role of Rab11-FIP2 as effector protein of the Rab11 family
Rab proteins are small GTPases anchored to the lipid bilayers of intracellular compartments, trough C-terminal prenylation of their cysteine residues [101], and they are known to be involved in transport regulation systems [102].
Rab11 subfamily comprises three isoforms: Rab11a, Rab11b and Rab25 [103], which localize to the ERC or to the apical recycling endosomes in polarized cells, in order to regulate endosomal trafficking through these compartments [104-106].
Rab11a has been shown to have a crucial role in both TLR4 and TRAM trafficking, upon LPS stimulation [49, 57].
Rab11a (like all the Rab proteins) needs effector proteins in order to work properly and over the last decades, several proteomic studies led to the identification of a highly conserved effector protein family, known as the Rab11-FIPs (Rab11 famyly interacting proteins) which act downstream of Rab11 [103].
Among them, Rab11-FIP2 (also known as FIP2), belonging to class I FIPs, is a 512 residue protein characterized by a conserved 20 amino acid RBD (Rab11-binding domain) and a α-helical coiled-coil structure, both located at its C-terminus and a phospholipid binding C2-domain close to its N-terminus [104].
FIP2 has a role in cellular physiological processes such as cell division, but it is mainly involved in recycling and delivery systems.
Indeed FIP2 was shown to be involved in receptor-mediated endocytosis [107], recycling of the chemokine receptor CXCR2 (CXC chemokine receptor 2) [108] and the water channel protein AQP2 (aquaporin-2) [109].
15
Moreover, it is has also a role in trafficking of GLUT4 (Glucose transporter type 4) [110] and the RSV (respiratory syncytial virus) [111].
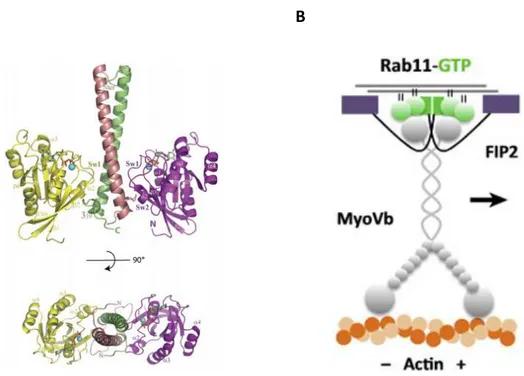
Studies made on crystal structure of Rab11a-FIP2 complex, demonstrated that two FIP2 molecules form a parallel coiled-coil homodimer with two symmetrical RBD domains, interacting with two Rab11-GTP molecules [101, 112, 113] forming thereby a heterotetrameric complex (Figure 4).
Moreover it’s known that FIP2 can also interact with Myosin5B, which is an actin-based motor protein and it has been showed that the tripartite association of Rab11a with both FIP2 and Myosin5B is crucial for movement regulation of Rab11a-containing recycling vesicles which can thus slide along the cytoskeleton [114, 115].
A B
Figure 4. Ribbon representation of Rab11a-FIP2 complex. Rab11 molecules are yellow and
magenta, while FIP2 is colored dark pink and green (A). Figure taken from Jagoe et al., 2006 [101].
Rab11-FIP2-Myo5b tripartite complex and its interaction with actin filaments (B). Figure taken from Welz et al. 2014 [115].
16
2 AIMS OF THE THESIS
Since Rab11a has the critical role to recruit TLR4 and TRAM to E. coli phagosomes and induce IFN-β mRNA, one of the aims of this thesis was to investigate whether the Rab11 effector protein FIP2 might have a role in the E. coli-induced TRAM-TRIF-dependent IFN-β production.
Secondly, a potential interaction between TRAM, FIP2 and Rab11a was addressed. Moreover, since both FIP2 and TRAM accumulate at the E. coli phagocytic cup (along with F-actin), as well as at the early E. coli phagosome, their roles in phagocytosis were addressed. MyD88, already shown to be involved in E. coli phagocytosis and phagosome maturation in mice was included as a control.
Since FIP2 is also known to control recycling of endocytosed receptors to the cell surface, the role of FIP2 in the control of surface levels of CD11b (CR3), CD16 (FcγRIII), CD14 and TLR4 (receptors involved in E. coli response and internalization), was investigated.
17
3 MATERIALS AND METHODS
3.1 Cell cultures and their maintenance
Two clones of the human monocyte-like cells THP-1 were used: wild type (WT) (ATCC® TIB-202™) and a 50% FIP2 knock down clone, F2, made with TALEN® technology (source) and called F2 (Patanè, F., Skjesol, A., Husebye, H. et al.) THP-1 cells were
cultured in RPMI (Roswell Park Memorial Institute)-1640 medium (ATCC® #30-2001TM)
supplemented with 10% heat inactivated fetal calf serum (FCS), 0.05 mM β-mercaptoethanol (Sigma) and 100 nM penicillin/streptomycin (Life Technologies) and
incubated at 37ºC in 5% CO2 atmosphere. Cultures were maintained by splitting cells 2-3
times a week, to keep the density between 0,2x10⁵ and 106 cells/ml. Immortalized
murine black 6 macrophages (B6 macrophages): WT and the B6 knock out macrophages,
MyD88-/- and TRAM-/-, were cultured in Dulbecco’s modified Eagle’s medium (DMEM),
supplemented with 10% heat inactivated FCS, 10 μg/ml ciprofloxacin (CellGro®) and 700
μM L-glutamin (Sigma) and incubated at 37ºC and 8% CO2. The cell cultures were
maintained by splitting cells at 70-80% of confluence using 3 ml of Trypsin-EDTA (Lonza) in PBS (Phosphate-buffered saline) to detach cells. Human monocytes were isolated from buffycoat by Lymphoprep gradient and adherence as previously described [73]. The use of human monocytes from blood donors has been approved by the Regional Committee for Medical and Health Research Ethics at NTNU. Monocytes were maintained in RPMI1640 (Sigma) supplemented with 10% of pooled human serum (The Blood Bank, St Olavs Hospital, Trondheim, Norway). Human Embrionic Kidney (HEK 293T) cells were cultured in DMEM supplemented with 10% FCS and 100 nM
penicillin/streptomycin (Life Technologies) and incubated at 37ºC in 8% CO2. The cells
were cultured and maintained by splitting cells when the confluency reached 70-80%, using 3 ml of Trypsin-EDTA (Lonza).
18
3.2 Differentiation and siRNA treatment
THP-1 cells were seeded in 6-well plates (Nunc™), at a density of 0.4x10⁶ per well and
differentiated into macrophages using 40 ng/ml PMA (phorbol 12-myrstate 13-acetate) in free media for 72 hours and rested for 48 hours in PMA-free and antibiotic-free medium. When needed, the cells were stimulated 96 hours after siRNA
transfection. HEK293T were seeded in 6-well plates (Nunc™) with a density of 0.4x10⁶
cells/well. Both THP-1 and HEK293T cells were transfected 24h after seeding using Lipofectamine® RNAiMAX Transfection Reagent (Invitrogen) according to the manufacturer’s instructions. The final siRNA concentration was 16nM in all experiments. Media was changed to fresh antibiotic-free 48 hours after transfection and the cells were stimulated 96 hours after transfection. PBMCs were seeded in 6-well plates
(Nunc™) with a density of 6.0x10⁶ cells per well, before being differentiated into
macrophages using 50 ng/ml recombinant human M-CSF (R&D Systems) in RPMI1640
(Sigma) with 10% human serum, 700 μM L-glutamin (Sigma)and 20 μg/ml Gensumycin
(Sanofi-Aventis). Media was changed on day 3 and on day 5. On day 6 and day 8, the cells were transfected with 32nM siRNA using the Lipofectamine® 3000 Transfection Reagent (Invitrogen), according with the manufacturer’s instructions. Media was changed to fresh antibiotic-free media at least 2 hours before the second siRNA transfection and the cells were stimulated on day 10. The AllStars Negative Control (QIAGEN) was used as a non-silencing RNA oligo and the Hs_Rab11FIP2_5, Hs_MyD88_5 and Hs_TICAM2_2 Validated siRNA (QIAGEN) were used to target the FIP2, MyD88 and TRAM mRNA, respectively.
3.3 Cell stimulation
B6 macrophages were seeded in 6-well plates (Nunc™) with a concentration of 0.2x10⁶
cells/well (WT and TRAM-/-) or 0.3x10⁶ cells/well (MyD88-/-). Cells were then stimulated
the day after seeding. PMA-differentiated THP-1 cells, primary human macrophages or B6 macrophages were stimulated in a final volume of 1ml/well with pHrodo® Red E. coli BioParticles® (ThermoFisher Scientific) or pHrodo® Red S. aureus BioParticles® (ThermoFisher Scientific), using 25, 50 or 100 μl (corresponding to 18,7 37,5 and 5
19
bioparticles per cell, respectively). E. coli K12 LPS Ultrapure (InvivoGen) (100ng/ml) stimulation were done in some experiments as well. All stimulations were done at different time points.
LPS and bioparticles were pre-incubated in 10% of mouse serum for of B6 macrophage
stimulation or 10-12% of A+ human serum, for opsonization. After stimulation, cells
were washed in PBS and treated either with 500μl of QIAzol® (Qiagen) Lysis Reagent and frozen at -80ºC, for total RNA extraction; or with 500μl of Accutase® (Sigma-Aldrich) cell detachment solution for flow cytometry analysis.
3.4 RNA extraction and quantitative real-time PCR
The QIAzol®-treated lysates were slowly thawed on ice and left at room temperature for 5 min. After addition of 100μl of chloroform and vigorous shaking, the tubes were centrifugated at 11600g for 15 min at 4ºC. The top layer was aspirated and moved into a new tube, where 0,5X volume of absolute ethanol was added. The lowest phenol-ethanol layer was kept and stored at -80 ºC for protein isolation. Purification on RNeasy® Mini Kit (Qiagen®) spin columns as well as DNase digestion step (QIAGEN), were performed, according to the manufacturer’s protocol. RNA quantity and purity was checked using Nanodrop ND-1000 (Thermo Scientific) spectrophotometer. 450 ng of extracted RNA were added to a mixture containing reverse transcriptase and converted into cDNA using the Maxima Fist Strand cDNA Synthesis Kit (ThermoFisher Scientific), according to the manufacturer’s instructions. cDNA synthesis was performed in a thermocycler, following three steps: 10 min at 25ºC, 30 min at 50ºC and 5min at 85ºC. 5 µl of diluted (1:10) cDNA were added to the reaction mixture containing PerfeCTa qPCR Fast Mix (Quanta Bioscience), TaqMan probe (Applied Biosystems) and Nuclease-free water, with a final volume of 20 µl, according with the manufacturer’s instructions. Quantitative real-time PCR (qPCR) was performed using StepOnePlus™ Real-Time PCR System (ThermoFisher Scientific). TaqMan probes used were: TBP, TATA-Box binding Protein, (Hs00427620_m1) as endogenous control, RAB11-FIP2 (Hs00202593_m1), TICAM2 (Hs04189225_m1), MYD88 (Hs01573837_g1), IFNB1 (Hs01077958_s1) and TNF (Hs00174128_m1). The level of TBP mRNA was used for normalization and results
20
presented as relative expression compared to the control-treated sample. Relative gene expression was evaluated using StepOnePlus™ software, performing the quantitative comparative (ΔCt) program. and it was calculated using the Pfaffl's mathematical model [116].
3.5 Cell-surface receptors analysis
After differentiation, plates were put on ice and cells were washed with cold PBS and treated with 500μl of Accutase® (Sigma) for 10-15 min. Then they were harvested by gentle scraping, transferred into FACS tubes and washed with PBS and PBS containing 0,1% BSA (bovine serum albumin), removing supernatants by centrifugation. Cells were then surface-stained with different PE-labeled primary antibodies, targeting different receptors, for 30 minutes on ice in the dark. After a wash in PBS and a second one using PBS+ 0,1% BSA, cells were resuspended in 200 μl of PBS.
Antibodies used were: mouse IgG2B PE-conjugated Antibody (R&D Systems) as Isotype
control; anti-human CD14 (MφP9) conjugated, anti-human CD11b (D12) PE-conjugated and anti-human CD16 (3G8) PE-PE-conjugated from Bioscience and anti-human CD284 (TLR4) (HTA125) PE-conjugated from eBioscience.
Live cells were gated setting a living cell gate based on forward scatter/side scatter (FSC/SSC) plot. Fluorescence intensity was measured by BD LRSII flow cytometer using FACS Diva software (BD Biosciences). Data were exported and analyzed using FlowJo software v10.0.5 (Trees Star).
3.6 Phagocytic Assay
This assay measures the phagocytic efficiency of macrophages after stimulation with pHrodo®-conjugated bioparticles (more details in cell stimulation section). Indeed, since pHrodo dye conjugates are pH sensitive, they are non-fluorescent outside the cell, where pH is neutral, but fluoresce brightly red in phagosomes, where the pH is strongly reduced. Thus there will be a positive correlation between high fluorescence intensity values and phagosomal acidification, necessary for an efficient phagocytosis [14, 20].
21
After differentiation and stimulation, plates were put on ice and cells were washed with cold PBS and treated with 500μl of Accutase® (Sigma-Aldrich) for 10-15 min. Then they were gently scraped, transferred into FACS tubes, washed with PBS and Flow wash (PBS containing 2% FCS) and resuspended with 200 μl of the same buffer.
In some experiments cells were also stained with a viability dye for 15 min on ice in the dark. Fluorescence intensity was measured by BD LRSII flow cytometer using FACS Diva software (BD Biosciences), after gating single live cells in FSC/SSC plots, as well as viability dye staining negative cells. Data were exported and analyzed using FlowJo software v10.0.5 (Trees Star).
3.7 Expression vectors and DNA transfection
Human TRAMYFP from K. Fitzgerald (University of Massachusetts Medical School,
Worcester, MA, USA), RAB11aFLAG [57], TRAMFLAG from Mariia Yurchenko (Norwegian
University of Science and Technology, Trondheim, Norway), FIP2GFP from Mary
McCaffrey (Cork University College, Cork, Ireland ) and Rab11aCFP (Klein et al., 2015)
were used for transfections. pDUO-hMD-2/CD14 (Invivogen) was co-expressed with TLR4Cherry [57] to ensure TLR4 dimer formation.
Empty EGFP -N1, empty EYFP-N1 and empty C-terminal-DYKDDDDK vectors (Clontech) were used for control GFP, YFP or FLAG protein expression, respectively. For endo-free plasmids preparations Endofree plasmid Maxi kit (QIAGEN) was used. One day after silencing, HEK 293T cells were transfected using 0.2-0.3 ug of vectors/well. Transfections were performed using GeneJuice® Transfection Reagent (Novegen), according with the manufacturer’s instructions. The day after, media was changed and replaced with antibiotic-free and PMA-free media. Cells were lysed 48 hours after transfection, in order to perform immuno-precipitation.
3.8 Immunoprecipitation
HEK293T cells expressing FLAG-tagged and/or YFP-tagged proteins, were lysed using 1X lysis buffer (150 mM NaCl, 50 mM TrisHCl pH 8.0, 1 mM EDTA, 1% NP40), supplemented
22
with EDTA-free Complete Mini protease Inhibitor Cocktail Tablets (Roche), PhosSTOP
phosphatase inhibitor cocktail (Roche), 50 mM NaF, 2 mM NaVO3 (Sigma) and 2,5U/ml
Benzonase® Nuclease (Novagen®). Immunoprecipitations were carried out using anti-FLAG (M2) antibody conjugated to agarose beads (Sigma) which was incubated with lysates on rotation overnight. After washes using the same lysis buffer, agarose pellets were resuspended in 1X NuPAGE LDS (lithium dodecyl sulfate) sample buffer (Novex) and heated at 70 ºC for 7-8 min, before removing agarose beads sitting on the bottom of the tubes and adding 25 mM DTT (Dithiothreitol). Samples were then heated again at 70 ºC for 7-8 min and analyzed by Western-blot (Immunoblott).
3.9 Protein isolation
Proteins were isolated from the lower phenol-ethanol layer saved from QIAzol® lysates, according with the manufacturer’s instructions. The protein pellet was dissolved in 50-200 μl of a buffer made of 4% SDS (Sigma), 4M urea, EDTA-free Complete Mini protease Inhibitor Cocktail Tablets (Roche) and PhosSTOP phosphatase inhibitor cocktail (Roche), 1X NuPAGE® LDS sample buffer (Novex) and 25 mM DTT. Samples were then heated at 95ºC for 5 min and analyzed by Western blot.
3.10 Immunoblotting
Heated samples were run in pre-cast protein gels NuPAGETM NovexTM (ThermoFisher
Scientific), with 1X MES buffer (ThermoFischer Scientific) and were transferred on nitrocellulose membranes, using the iBlot®2 Gel Transfer Device (Invitrogen). Membranes were washed in TBS-T (Tris Buffered Saline + 0,1% Tween) and incubated with blocking buffer (TBS-T containing 5% milk/BSA) for 45 min at room temperature on a shaker . Afterwards, membranes were incubated with primary antibodies in TBS-T containing 1% milk/BSA, at 4ºC, overnight or for 2-3-days, depending on the antibody. The following primary antibodies were used: anti–FLAG M2, from Sigma; anti -GFP from Clontech; anti-phospho IRF3 (S396) (4D4G), anti-phospho TBK1 (S172), anti-total TBK1/NAK (D1B4), anti-phospho IκBα (I4D4) and anti-phospho p38 MAPK (T180/Y182)
23
from Cell Signaling; anti-phospho IRF3 (S386) (ab76493) and anti β-tubulin (ab15568) from Abcam and anti-total IRF3 (FL-425) from Santa Cruz.
Membranes were then washed three times in TBS-T and incubated with secondary antibodies (HRP-conjugated, from DAKO Denmark A/S) for one hour at room
temperature in TBS-T containing 1% milk/BSA and developed with SuperSignalTM West
Femto Substrate (ThermoFisher Scientific), capturing the specific signal using the LI-COR Odissey® detection system. Images were analyzed by Odyssey Image Analysis software.
24
4 RESULTS
4.1 FIP2 is involved in E.coli induced IFN- signaling downstream of TLR4
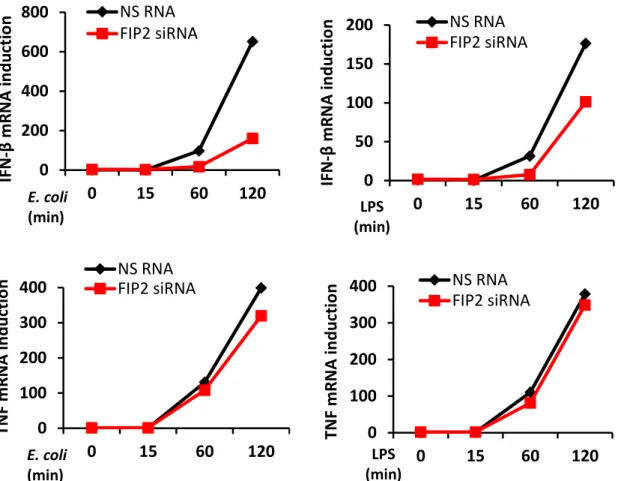
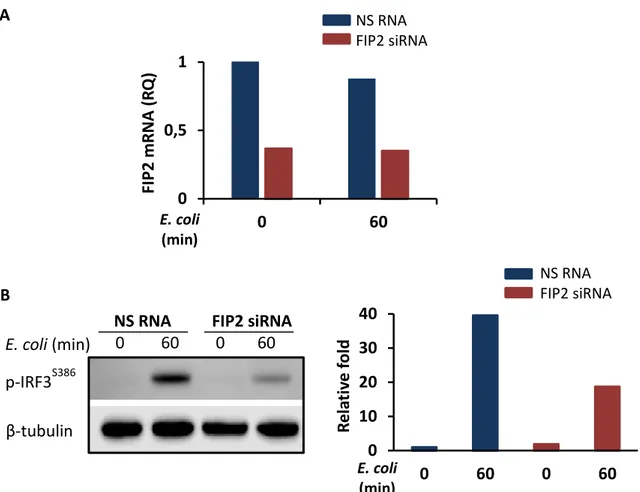
To investigate the role of FIP2 in E. coli induced IFN- signaling downstream of TLR4, differentiated THP-1 cells were treated with a non-silencing RNA oligo (NS RNA) or FIP2 siRNA. Following silencing, the cells were stimulated with pHrodo E. coli particles or ultrapure LPS for 15, 60 and 120 minutes. FIP2 silencing was verified by realtime quantitative PCR (q-PCR), showing a knockdown level (KD) of approximately 95% for the investigated time points (Figures 5A and 5B, upper panels).
As shown in Figure 5A and 5B (middle and lower panels), FIP2 silencing markedly impaired both E. coli and LPS stimulated IFN-β induction after 60 and 120 minutes of stimulation, whereas TNF (pro-inflammatory cytokine) induction was largely unaffected. Furthermore, the effect of FIP2 depletion was stronger on E.coli stimulated IFN- than LPS stimulated IFN-, especially after 120 min of stimulation showing a 72% and 45% reduction, respectively. A B 0 0,5 1 0 15 60 120 0 0,5 1 0 15 60 120 NS RNA FIP2 siRNA NS RNA FIP2 siRNA FI P2 m R NA (R Q ) FI P2 m R NA (R Q ) E. coli (min) LPS (min)
25
Figure 5. Relative quantification of FIP2 (upper panels), IFN-β (middle panels) and TNF (lower
panels) mRNA by q-PCR in differentiated THP-1 cells, treated with a nonsilencing RNA oligo (NS RNA) or FIP2 siRNA and stimulated with E. coli particles (7.5x10⁶/ml) (A) or LPS (100 ng/ml) (B).
TBP was used as endongenous control for normalization. Results show one representative of three independent experiments.
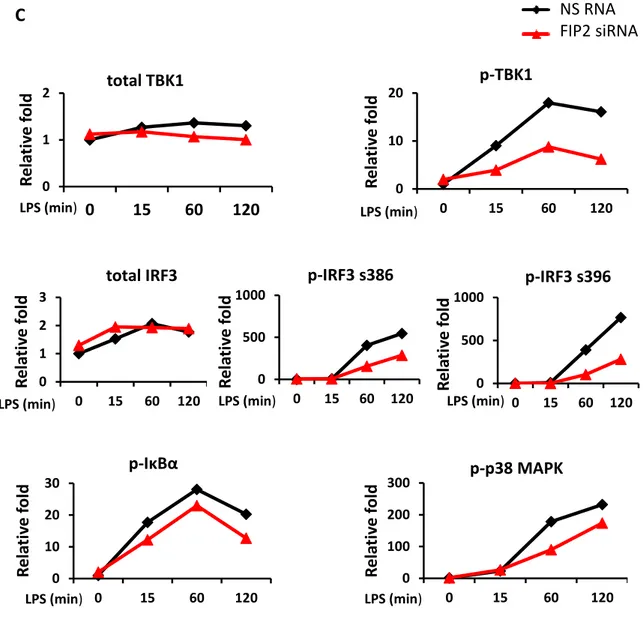
To verify these results, proteins from the same biological samples were isolated and immunoblotting performed, addressing phosphorylation of TBK1 at S172 and IRF3 at S386 and S396 known to be important for the LPS-induced TRAM-TRIF-dependent signaling pathway giving IFN- [117, 118]. Silencing of FIP2 gave a markedly reduced phosphorylation of TBK1 at S172 and IRF3 at S386 and S396 following stimulation with
E. coli (Figures 6A and 6B). Phosphorylation of IκBα and p38 MAPK, known to be
involved in the MyD88-dependent signaling pathway, were also addressed and showed no marked reduction. In contrast to E. coli stimulated cells, following LPS stimulation FIP2 silencing also reduced the phosphorylation of IκBα and p38 MAPK (Figure 6A and 6C). 0 200 400 600 800 0 15 60 120 NS RNA FIP2 siRNA 0 50 100 150 200 0 15 60 120 NS RNA FIP2 siRNA 0 100 200 300 400 0 15 60 120 NS RNA FIP2 siRNA 0 100 200 300 400 0 15 60 120 NS RNA FIP2 siRNA IFN -β m R NA in d u ct io n IFN -β m R NA in d u ct io n TNF m R NA in d u ct io n TNF m R NA in d u ct io n E. coli (min) E. coli (min) LPS (min) LPS (min)
26 A 0 1 2 0 15 60 120 0 10 20 30 0 15 60 120 0 1 2 0 15 60 120 0 500 1000 0 15 60 120 0 500 1000 0 15 60 120 0 100 200 0 15 60 120 0 10 20 30 0 15 60 120 p-IRF3S396 t-IRF3 p-IRF3S386 p-IκBα p-P38 MAPK
NS RNA FIP2 siRNA
0 15 60 120 - - - 0 15 60 120 - - - - - - - 15 60 120 - - - - 15 60 120 p-TBK1 t-TBK1 E. coli (min) LPS (min) PCNA B p-TBK1 p-IRF3 s386 p-IRF3 s396 p-p38 MAPK p-IκBα total TBK1 total IRF3 R e la ti ve f o ld R e la ti ve f o ld R e la ti ve f o ld NS RNA FIP2 siRNA E. coli (min) E. coli (min) E. coli (min) E. coli (min) E. coli (min) E. coli (min) E. coli (min) R e la ti ve f o ld R e la ti ve f o ld R el ati ve f o ld R e la ti ve f o ld
27
Figure 6. Immunoblot from THP1 cells treated with NS RNA or FIP2 siRNA and stimulated with E.
coli particles (7.5x10⁶/ml) or LPS (100 ng/ml) (A). Graphs show quantification of protein levels
normalized with PCNA (B-C).
Results show one representative of three independent experiments.
In primary human macrophages only the activation of IRF3S386 was addressed, since for
still unknown reasons S396 is not detected in these cells [119]. Immunoblotting
confirmed previous results, showing that IRF3S386 phosphorylation was strongly impaired
after FIP2 silencing (Figure 7A and 7B).
0 1 2 0 15 60 120 0 10 20 0 15 60 120 0 1 2 3 0 15 60 120 0 500 1000 0 15 60 120 0 500 1000 0 15 60 120 0 10 20 30 0 15 60 120 0 100 200 300 0 15 60 120 C p-TBK1 R e la ti ve f ol d total TBK1 LPS (min) LPS (min) R e la ti ve f ol d R e la ti ve f ol d R el ati ve f ol d R e la ti ve f ol d R e la ti ve f ol d R e la ti ve f ol d LPS (min) LPS (min) LPS (min) LPS (min) LPS (min) LPS (min) p-TBK1 p-p38 MAPK p-IκBα total IRF3 NS RNA FIP2 siRNA p-IRF3 s386 p-IRF3 s396
28
A
Figure 7. Relative quantification of FIP2 mRNA by q-PCR in primary human macrophages treated
with NS RNA or Rab11-FIP2 siRNA and stimulated with E .coli particles (3x10⁷/ml). TBP was used
as endongenous control for normalization (A). Immunoblot of protein obtained from the same samples as in A (B, left panel). Graph shows the level of p-IRF3S386 normalized with β-tubulin (B,
right panel). Results show one representative of three independent experiments.
In summary, these data suggest a crucial role for FIP2 in the TRAM-TRIF-dependent signaling upon stimulation with both E. coli and LPS. For LPS induced response, FIP2 also affect MyD88-dependent signaling, giving lower levels of IB and markedly lower levels of p38MAPK phosphorylation upon silencing.
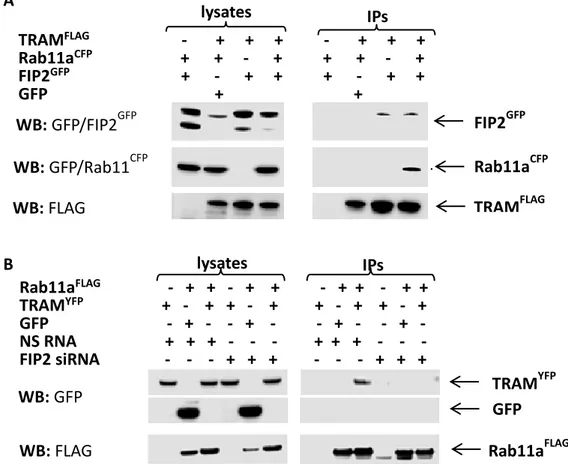
4.2 FIP2 and TRAM form a complex with Rab11a
To investigate whether FIP2 can bind TRAM and whether Rab11a is also involved in this interaction, HEK293T cells were transfected with plasmids encoding the respective
tag-proteins and immunoprecipitations performed. Results showed that FIP2GFP could
immunoprecipitate with TRAMFLAG, with or without Rab11aCFP overexpression; whereas
0 0,5 1 0 60 0 10 20 30 40 0 60 0 60 NS RNA FIP2 siRNA
NS RNA FIP2 siRNA
0 60 0 60 E. coli (min) FI P2 m R NA (R Q ) B R e la ti ve f ol d E. coli (min) p-IRF3S386 β-tubulin E. coli (min) NS RNA FIP2 siRNA
29
Rab11aCFP could not immunoprecipitate with TRAMFLAG when FIP2GFP was not
overexpressed (Figure 8A). Moreover, TRAMYFP could immunoprecipitate with
Rab11aFLAG only when FIP2 was expressed and the interaction did not occur when FIP2
was silenced (Figure 8B).
These results suggest that Rab11a, FIP2 and TRAM all bind each other, forming a protein complex where FIP2 has the crucial role as a bridging molecule.
Figure 8. Immunoprecipitations (IPs) of FLAG-tagged versions of TRAM or Rab11a. HEK293T
cells with expression of indicated proteins, without FIP2 silencing (A). HEK293T cells with co-expression of indicated proteins, treated with NS RNA or FIP2 siRNA (B). FLAG-antibody (M2) conjugated agarose beads were used carrying out the IPs, and FLAG- and GFP-antibodies used for detection. Results show one representative of three experiments.
A B TRAMFLAG - + + + - + + + Rab11aCFP + + - + + + - + FIP2GFP + - + + + - + + GFP + + lysates IPs WB: GFP/FIP2GFP WB: GFP/Rab11CFP WB: FLAG FIP2GFP Rab11aCFP TRAMFLAG Rab11aFLAG - + + - + + - + + - + + TRAMYFP + - + + - + + - + + - + GFP - + - - + - - + - - + - NS RNA + + + - - - + + + - - - FIP2 siRNA - - - + + + - - - + + + lysates IPs WB: FLAG WB: GFP TRAM YFP GFP Rab11aFLAG
30
4.3 FIP2 contributes to set the repertoire of surface receptors involved in
E. coli uptake in THP-1 cells but not in primary human macrophages
To determine whether FIP2 is involved in the regulation of cell-surface receptors involved in E. coli response and phagocytosis, such as TLR4, CD14, CD11b, and CD16 [51, 74-77, 120] differentiated THP-1 cells and primary human macrophages were treated with NS RNA or FIP2 siRNA. FIP2 silencing was verified by realtime q-PCR, showing a knockdown level of approximately 95% in THP-1 cells and 65% in primary human macrophages (Figures 9A and 10A). Differentiated THP-1 cells, WT and F2 were also analyzed for this purpose. Single live cells were gated by setting FSC/SSC and FSC-A/FSC-H plots using flow cytometry. The surface level of CD14 and CD11b, were halved upon FIP2 silencing, while no difference was observed in TLR4 levels (Figure 9B). CD16 could not be detected on the surface of the THP-1 cells by any treatment. Similar results were obtained in F2 THP-1 cells (50% KD Talen clone) compared to WT, were the level of CD14 and CD11b were reduced by approximately 80% and 50%, respectively and still no differences were observed in levels of TLR4 (Figure 9C).
A 0 0,5 1 FI P2 m R NA (R Q )
31
B
C 0 0,5 1 1,5 2 CD14 CD11b TLR4 IgG isotype ctr NS RNA FIP2 siRNA NS RNA FIP2 siRNA CD14 CD14 CD16 TLR4 CD11b CD11b TLR4 CD16 % of M ax % of M ax % of M ax % of M ax % of M ax M FI re la ti ve s va lues % of M ax % of M ax % of M ax IgG isotype ctr WT F232
Figure 9. Relative quantification of FIP2 mRNA by q-PCR in THP-1 cells treated with NS RNA or
FIP2 siRNA. TBP was used as endongenous control for normalization. Values represent means of two independent experiments ± SD (A). Expression and MFI relative values of four different cell-surface receptors in differentiated THP-1 cells treated with NS RNA or FIP2 siRNA (B) and differentiated THP-1 cells WT and F2 (C). Histograms show a representative of three experiments. Graphs represent means of three independent experiments ± SD. SD=standars deviation. MFI=median fluorescence intensity.
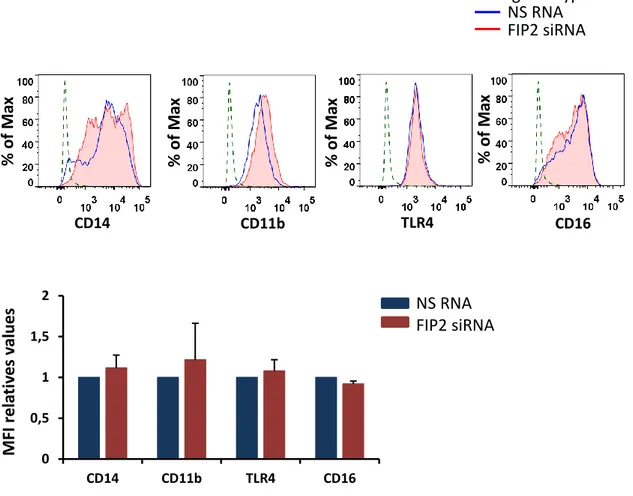
On the contrary, primary human macrophages showed a similar surface expression of these receptors compared to their control cells upon FIP2 silencing. Indeed the level of CD14, CD11b and TLR4 were even slightly increased, whereas the level of CD16 (which is now detected) was decreased to a non-marked extent (Figure 10B).
A 0 0,5 1 1,5 2 CD14 CD11b TLR4 0 0,5 1 WT F2 FI P2 m R NA (R Q ) M FI r e la ti ve s va lu e s
33
B
Figure 10. Relative quantification of FIP2 mRNA by q-PCR in primary human macrophages
treated with NS RNA or FIP2 siRNA. TBP was used as endongenous control for normalization. Values represent means of two independent experiments ± SD (A).
Expression and MFI relative values of four different cell-surface receptors in primary human macrophages treated with NS RNA or FIP2 siRNA (B). Histograms show one representative of two independent experiments. Graphs represent means of two independent experiments ± SD.
Taken together these data suggest that FIP2 controls the surface levels of CD14 and CD11b in THP1 cells, both reported to be involved in E. coli phagocytosis. Whereas FIP2 behaves differently in primary human macrophages, where a relevant decrease of the receptors investigated is not observed upon silencing.
0 0,5 1 1,5 2 CD14 CD11b TLR4 CD16 IgG isotype ctr NS RNA FIP2 siRNA NS RNA FIP2 siRNA CD14 CD11b TLR4 CD16 % of M ax % of M ax % of M ax % of M ax M FI r e la ti ve s va lu e s
34
4.4 FIP2 is involved in phagocytosis of E. coli in human macrophages
To investigate a possible role of FIP2 in E. coli phagocytosis it was silenced in differentiated THP-1 cells and phagocytosis was compared to cells treated with NS RNA. The cells were stimulated for 30 and 60 minutes with pHrodo E. coli particles
(1.5x10⁷/ml) and harvested, before phagocytosis was monitored using flow-cytometry.
FIP2 KD levels monitored by realtime q-PCR were in compliance with the ones shown in the section above (Figure 9A) and for this reason they are not shown. The cells were gated (as explained above) and the percentage of pHrodo-positive cells and MFI relative values registered.
Upon FIP2 silencing, E. coli phagocytosis was strongly altered: approximately -40% at 30 minutes and -90% at 60 minutes (Figures 11A, upper panels and 11B, left panel). Also primary human macrophages following siRNA treatment (KD levels by realtime q-PCR comparable with the ones shown in Figure 10A) and upon E. coli particles
(3x10⁷particles/ml) stimulation for 60 minutes, showed a decreased phagocytosis by
around 90% (Figure 11C). A % of M ax pHrodo FI 0 30’ 60’ E. coli stimulation S. aureus stimulation NS RNA FIP2 siRNA