Abstract
The efficiency of transport through Band 3 protein, mediating HCO3–/Cl–exchange across erythrocytes membrane, is reduced by oxidative stress. The aim of the present study was to verify whether Band 3 protein transport efficiency is compromised by treatment with Cadmium (Cd2+), an extremely toxic heavy metal known to
interfere with antioxidant enzymes, energy metabolism, gene expression and cell membranes. To this end, the rate constant for SO4=uptake through Band 3 protein (accounting for velocity of anion exchange) was measured along with membrane –SH groups, Malonyldialdehyde (MDA) and Band 3 protein expression levels in Cd2+-treated human erythrocytes (300 µM, 1 mM). Our results
show that Cd2+reduced the rate constant for SO4=uptake, with a
significant increase in MDA levels at both concentrations and with a reduction in –SH groups observed after 1 mM Cd2+ treatment,
whereas Band 3 protein expression levels were unchanged in both
conditions. In conclusion: i) Cd2+ reduces Band 3 protein transport
efficiency via different mechanisms depending on metal concentration and with unchanged expression levels; ii) the assessment of Band 3 protein anion exchange capability is a good tool to assay the impact of heavy metals on cell homeostasis and, possibly, useful for diagnosis and monitoring of development of Cd2+ toxicity-related pathologies.
Introduction
Band 3 protein is the most abundant integral protein of erythrocyte membrane1 and its crystal structure was defined in
2015.2Band 3 protein has been extensively studied in wild-type
human mature erythrocytes, during their maturation, and in connection with possible defects of membrane skeleton.3,4It is
critically involved in maintenance of erythrocytes deformability and ion balance essential to gas exchange efficiency, making thus the evaluation of anion exchange capability (Cl–/HCO3–) useful to
check erythrocytes homeostasis in health and disease.5,6Band 3
protein functions are mediated by two domains, a membrane domain for anion exchange and a cytoplasmic domain which mainly contributes to the protein-protein interactions, by coupling the lipid bilayer to the underlying cytoskeleton, through cysteine – SH groups.7Human erythrocytes, being constantly exposed to
oxidative stress, have been already used as a model to study possible alterations due to oxidants like H2O2or N-Ethylmaleimide (NEM) at level of methemoglobin production, lipid peroxidation, membrane –SH groups oxidation, efficiency of anion exchange capability through Band 3 protein and phosphorylation of Band 3 protein Tyrosine residues.8,9
Among oxidants, Cadmium (Cd2+), a widely distributed and
extremely toxic heavy metal, has been proven to alter antioxidant enzymes, energy metabolism, membrane arrangement, gene expression and apoptosis, though the exact mechanism of its toxicity is still not completely understood.10–13 It enters blood
stream, binds to the erythrocyte membrane and stimulates reactive oxygen species (ROS) formation,10affecting the antioxidant system
and increasing lipid peroxidation.10,13In addition, Cd2+has been
shown to alter lipid bilayer molecular structure, thus modifying the biophysical properties of cell membrane such as fluidity, which in turn affects signals transduction, channel functions and protein activity.14
Cadmium is found in many natural foods, particularly in grains and seaweed among vegetables, and, with regard to animals, in fishes and shellfishes. As pointed out by Satarug et al.,15 human
exposure to Cd2+is mostly through foods (90%) and has been
Correspondence: Angela Marino, Department of Chemical, Biological, Pharmaceutical and Environmental Sciences, University of Messina, Viale F. Stagno D’Alcontres 31, 98166 Messina, Italy.
E-mail: [email protected]
Key words: Cadmium; Oxidative stress; SO4=uptake; Band 3 protein; Erythrocyte.
Contributions: RM, AR, AM1, BA, performing experiments, data col-lecting and analysis; MG and GLS, manuscript reviewing; AM2, experimental design, manuscript writing and reviewing.
Conflict of interest: the authors declare no potential conflict of interest. Funding: none.
Received for publication: 27 November 2017. Revision received: 7 February 2018. Accepted for publication: 13 February 2018. ©Copyright R. Morabito et al., 2018
Licensee PAGEPress, Italy
Journal of Biological Research 2018; 91:7203 doi:10.4081/jbr.2018.7203
This article is distributed under the terms of the Creative Commons Attribution Noncommercial License (by-nc 4.0) which permits any noncommercial use, distribution, and reproduction in any medium, provided the original author(s) and source are credited.
Effect of cadmium on anion exchange capability through Band 3 protein in
human erythrocytes
Rossana Morabito,
1Alessia Remigante,
1Benedetta Arcuri,
1Angela Marino,
1Marco Giammanco,
2Giuseppina La Spada,
1Angela Marino
11
Department of Chemical, Biological, Pharmaceutical and Environmental Sciences, University of Messina, Messina;
2Department of Biomedicine and Clinical Neurosciences, University of Palermo, Palermo, Italy
Non-commercial
[page 2] [Journal of Biological Research 2018; 91:7203] linked to increased risk of bone fracture, cancer, kidney dysfunction,
and hypertension.15 However, cigarette smoke should be not
excluded as source of the body cadmium Cd2+ burden, being
tobacco plant a cadmium bioaccumulator.16In any case, once
absorbed into blood circulation, Cd2+may exert its toxic effect by
damaging cell membranes17at concentrations 10 folds lower than
those currently used in in vitro assays.14Despite this discrepancy,
in vitro experiments have been conducted in order to rapidly evaluate Cd2+effects at cellular level after brief exposure to the
metal.14,18In particular, Suwalski et al.14point out that 1 mM Cd2+,
from one hand is effective in altering erythrocytes membrane, and, from the other hand, similarly to other in vitro studies,17,19is at least
10-folds higher than its toxic concentration in blood.20
On these premises, the present investigation aims to verify whether and how Band 3 protein transport efficiency in human erythrocytes is affected by a transient exposure to Cd2+and whether
monitoring anion exchange capability may be considered as an additional tool for diagnosis and monitoring of development of pathologies related to cadmium Cd2+toxicity.
To this end, erythrocytes have been exposed for 1 h at Cd2+(300
µM and 1 mM), in order to produce oxidative damage, according to other in vitro investigations,14 assaying the effects of Cd2+within
this range of concentrations.
Cd2+-induced oxidative damage has been assessed by measuring
levels of both membrane –SH groups, mostly deriving from Band 3 protein,21and Malonyldialdehyde (MDA) – the end product of
lipid peroxidation – while the efficiency of anion transport through Band 3 protein has been monitored by determining the rate constant for SO4=uptake, which accounts for exchange velocity and is more easily estimated than Cl–or HCO3–uptake.22–24Expression levels
of Band 3 protein in Cd2+-treated erythrocytes have been also
determined.
Materials and Methods
Erythrocytes preparation
Human blood was obtained from healthy volunteers upon informed consent. Blood was collected in heparinized tubes, washed in an isotonic solution (composition in mM: 145 NaCl, 20 HEPES (4-(2-hydroxyethyl)-1 piperazineethanesulfonic acid), pH 7.4, osmotic pressure 300 mOsm) and centrifuged thrice (ThermoScientific, 1000 g, 5 min) to remove plasma and buffy coat.
SO
4=uptake measurement
Human erythrocytes were suspended to 3% hematocrit in 35 mL isotonic SO4=-containing medium defined as SO4= medium (composition in mM: 118 Na2SO4, 20 HEPES, 15 glucose, pH 7.4, osmotic pressure 300 mOsm). At specified time intervals (5-10-15-30-45-60-90-120 min), 5 mL samples of erythrocytes suspension were treated with 10 μM 4,4’-diisothiocyanatostilbene-2, 2’-disulphonic acid (DIDS), a specific and irreversible blocker of Band 3 protein25
and kept on ice. After the last sample withdrawal, erythrocytes were washed thrice by centrifugation in cold isotonic solution (ThermoScientific, 4°C, 1000 g, 5 min) to remove SO4= from the external medium and then hemolysed by 1 mL distilled water, while proteins were hydrolysed with 4% v/v perchloric acid. Centrifugation (4°C, 2400 g, 10 min) allowed to obtain SO4=-containing supernatant used for turbidimetric method. SO4=was precipitated by adding 500 μL supernatant from each sample to 1 mL glycerol and distilled water solution (1:1), 1 mL 4 M NaCl plus hydrochloric acid (HCl 37%)
solution (12:1) and 500 μL 1.24 M BaCl2·2 H2O. Total amount of SO4= internalized by erythrocytes at fixed times was spectrophotometrically quantified (425 nm wavelength, Beckman DU 640) and the absorption converted to mM of SO4=using a calibrated standard curve previously obtained by precipitating known SO4=amounts. The rate constant, measured in min–1, was then calculated by the following equation: Ct
= C∞(1–e–rt) + C0, where Ct, C∞and C0represent the intracellular SO4= total amount measured at time t, 0 and ∞ respectively; e indicates Neper number (2.7182818); r is the rate constant of the transport process and t is time fixed for each sample withdrawal (5-10-15-30-45-60-90-120 min). The reciprocal of rate constant for SO4=uptake (min) represents the time needed to reach 63% of total SO4= intracellular total amount.23
With regard to Cd2+treatment, erythrocytes, after washing, were
diluted to 3% hematocrit and treated with CdCl2doses comprised between 50 µM and 1 mM for one hour at 37°C in isotonic solution. During incubation, light microscope observations were performed to exclude possible Cd2+-dependent hemolysis. After incubation,
samples were centrifuged (1000 g, 5 min) to remove the supernatant, re-suspended to 3% hematocrit in SO4=medium containing Cd2+ and SO4=uptake measured as described for control conditions.
Based on SO4=uptake measurement, two Cd2+doses (300 µM and 1 mM) have been chosen to complete the experimental design.
Membrane –SH groups determination
Membrane –SH groups estimation was performed on erythrocytes (untreated or treated with Cd2+) according to Roy and
co-workers.21In details, erythrocytes, after washing, were treated
with 300 µM and 1 mM Cd2+to 3% hematocrit for one hour at
37°C. After the incubation, they were centrifuged (ThermoScientific, 1000 g, 5 min), concentrated to 10% hematocrit and lysed by cold hypotonic buffer (2.5 mM NaH2PO4, 5 mM HEPES). After 10 min stirring at 0°C, hemoglobin and intracellular content were discarded by repeated centrifugations (Eppendorf microfuge, 4°C, 18000 g, 20 min). The process was repeated with the same hypotonic buffer to discard hemoglobin. One volume of membranes (from both treated and untreated erythrocytes) was then incubated with nine volumes of 0.1 M NaOH for 30 min at 0°C plus 200 μM dithiothreitol and 20 μg/ml Phenylmethylsulfonil fluoride (PMSF). After incubation, samples were centrifuged (4°C, 18000 g, 45 min). The pellet, containing Band 3 protein, was washed thrice with 5 mM sodium phosphate (pH 8.0) and used for –SH groups determination. For this purpose, pellet (200 μl) was solubilized by incubating 300 μL of 20% v/v Sodium dodecyl sulphate (SDS) reagent in 3 ml of 100 mM sodium phosphate (pH 8.0), for 30 min at 37°C. Samples were further incubated with 100 μl of 10 mM DTNB (5,5’-dithiobis-(2-nitrobenzoic acid) in 100 mM sodium phosphate (pH 8.0), for 20 min at 37°C. DTNB reacts specifically with thiol groups producing a highly colored yellow anion. Levels of membrane –SH groups were spectrophotometrically read at 405 nm21and expressed as percentage of –SH groups in untreated
erythrocytes.
Determination of Malondialdehyde levels
To assess oxidative stress, levels of MDA, as end product of lipid peroxidation, have been measured on both treated and untreated erythrocytes.26The assay is based on the reaction between
MDA and thiobarbituric acid (TBA) which produces thiobarbituric acid-reactant substances, colorimetrically detectable at 532 nm wavelength. Erythrocytes, after washing, were suspended to 3% hematocrit in isotonic medium and incubated with either 300 μM or 1 mM CdCl2 plus 2 mM NaF for one hour at 37°C. Samples were
Non-commercial
centrifuged (ThermoScientific, 1000 g, 5 min), suspended to 10% hematocrit in 1 mL distilled water to induce hemolysis and frozen overnight at –20°C until analysis. After thawing, sample aliquots (200 µL) were treated with 500 μL TBA (1% v/v dissolved in 1 N HCl) and incubated at 95°C for 1 h. Samples were then cooled on ice, centrifuged (13000 g, 15 min, 4°C) and the supernatant spectrophotometrically read at 532 nm. MDA levels were converted in micromolar by comparing results with a calibration standard curve previously obtained by known concentrations of 1,1,3,3-tetramethoxypropan 99% MDA bis (dimethyl acetal) 99% (Sigma).
Erythrocytes membrane preparation and Sodium
dode-cyl sulphate-PolyAcrylamide gel electrophoresis
Membrane extracts were prepared as previously described9with
slight modifications. Briefly, after washing, packed erythrocytes were diluted into 1.5 mL of cold hemolysis buffer (2.5 mM Sodium Phosphate, 1 mM EGTA, pH 8) containing a protease and phosphatase inhibitor cocktail (1 mM PMSF, 1mM NaF, 1 mM Sodium Orthovanadate) and then repeatedly centrifuged (Eppendorf, 13000 g, 4°C) to discard hemoglobin. Membrane were then solubilized by 1% (v/v) SDS and incubated on ice for 20 min. Solubilized membrane proteins, contained in the supernatant, were addressed to protein content quantification, according to Bradford method27and frozen at −80°C until use. Membranes obtained from
each experimental condition, once thawed, were solubilized in Laemmli Buffer28in a volume ratio of 1:1, heated for 5 min at 95°C
and then loaded (2 μg proteins). Samples were then separated on 12% polyacrylamide gel under reducing conditions and then transferred to polyvinylidenefluoride (PVDF) membrane.
Western blot analysis
PVDF membranes were incubated at 4°C overnight with monoclonal anti-Band 3 protein (1:100000; Santa Cruz Biotechnology, produced in mouse) diluted in 1×phosphate-buffered saline, 5% (w/v) non-fat dried milk and 0.1% Tween-20. Membranes were then incubated with peroxidase-conjugated goat anti-mouse IgG secondary antibodies (1:5000, Affini Pure), for 1 h at room temperature, followed by chemioluminescent detection, according to the manufacturer’s instruc-tions (Super Signal West Pico Chemiluminescent Substrate, Pierce Thermo Scientific, Rockford, IL,
USA). To verify whether blots contained equal amounts of protein, they were also incubated with monoclonal antibodies against β-actin (1:1000, Santa Cruz Biotechnology) produced in mouse. Quantification of Band 3 protein (approximately 95 kDa) expression was done by densitometry (Bio-Rad ChemiDoc™ XRS equipped with Image Quant 171 TL, v2003) and standardized to β-actin levels. Molecular weight standards, ranging between 10 and 250 kDa, were used to define molecular weight positions.
Experimental data and statistics
Data are expressed as means ± S.E.M. GraphPad Prism software (version 5.00 for Windows; San Diego, CA) was used. Significant differences between means were tested by paired one-way analysis of variance (ANOVA), followed by Bonferroni’s, post hoc test. Statistically significant differences were assumed at P<0.05 (*P<0.05, **P<0.01, ***P<0.001); N represents the number of independent experiments.
Results
SO
4=uptake measurement
Treatment with Cd2+at all concentrations did induce hemolytic
events. With regard to SO4= uptake measurement, doses lower than 300 µM did not significantly alter the rate constant, therefore data presented in Figure 1 refer to SO4=uptake in either 300 µM or 1 mM Cd2+-treated erythrocytes, compared to control (untreated
erythrocytes) and reported as a function of time. The velocity of this process is represented by the rate constant for SO4= uptake (min–1). SO4=transport in control erythrocytes progressively increased and reached equilibrium in 30 min, with a rate constant of 0.057±0.001 min–1(time to reach 63% of total SO4=intracellular
total amount=17 min). Erythrocytes treated with 300 µM Cd2+
exhibited a rate constant of 0.051±0.001 min–1 (19 min),
significantly lower than those observed in control conditions (P<0.05) and total amount of SO4=internalized at 30 min and 45 min by such treated cells (118.75±6.5 mM and 162.72±4.3 mM respectively, Table 1) was significantly lower those determined in control at both time intervals (163.72±2.4 mM and 186±18 mM respectively, Table 1). Similarly, erythrocytes exposed to 1 mM Cd2+
showed a rate constant for SO4=uptake (0.041±0.001 min–1, 24 min) significantly lower than control (P<0.001) and SO4=total amount trapped by the cells at 30 min and 45 min (78.52±11 mM and 140±8.8 mM respectively, Table 1) significantly lower than what determined in untreated erythrocytes at both time intervals (163.72±2.4 mM and 186±18 mM respectively, Table 1).
Treatment with 10 µM DIDS applied at the beginning of incubation in SO4= medium completely blocked SO4=uptake (rate constant of 0.018±0.001 min–1, 55 min) and significantly reduced
SO4=total amount detected at both 30 and 45 min (20.25±12 mM and 4.75±9 mM respectively, Table 1) with respect to both control and Cd2+-treated cells (P<0.001).
As said, Cd2+concentrations comprised between 50 and 200
µM did not alter the rate constant for SO4= uptake when compared to the control, and, hence, have been not shown and no longer considered for the experimental protocol.
Membrane –SH groups determination
Determination of membrane –SH groups was performed in erythrocytes treated with either 300 µM or 1 mM Cd2+(Figure 2).
After exposure to 300 µM Cd2+, levels of membrane –SH groups Figure 1. Time course of SO4= uptake measured in control (untreated
erythrocytes) or in erythrocytes treated with either 300 µM Cd2+, or
1 mM Cd2+or 10 µM 4,4’-diisothiocyanatostilbene-2, 2’-disulphonic
acid (DIDS). *P<0.05 and ***P<0.001 vs control, §P<0.05 vs 300 µM
Cd2+, as determined by one-way analysis of variance followed by
Bonferroni’s Multiple Comparison post hoc test, by comparing all values of theoretical curves, at all time points (N=6).
Non-commercial
[page 4] [Journal of Biological Research 2018; 91:7203] were not significantly different when compared to control (untreated
erythrocytes), while, after treatment with 1 mM Cd2+, significantly
lower than those of untreated erythrocytes (P<0.001). Results were compared to what obtained after treatment with 2 mM NEM, a thiol oxidizing compound, which significantly reduced –SH groups when compared to control (Figure 2, P<0.001).
Malondialdehyde membrane levels
As shown in Figure 3, levels of MDA, the end product of lipid peroxidation, in erythrocytes treated with either 300 µM or 1 mM Cd2+ were significantly higher than those measured in control
conditions (untreated erythrocytes, P<0.001). These data have been compared with MDA levels produced by the oxidant NaF, known to induce a significant lipoperoxidation. As expected, in this latter case MDA levels were significantly higher than those measured in both control and Cd2+treated (300 µM and 1 mM) erythrocytes
(P<0.001).
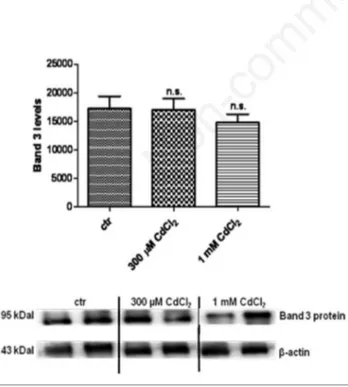
Western blot analysis
Band 3 protein expression levels in erythrocytes treated with either 300 µM or 1 mM Cd2+ were not significantly different with
respect to those determined in untreated erythrocytes (Figure 4).
Discussion
In the present investigation experiments have been carried out to evaluate anion exchange capability through Band 3 protein after a brief exposure of human erythrocytes to Cd2+. For this purpose,
the rate constant for SO4=uptake has been determined, as SO4=can be more slowly exchanged than Cl– and, hence, more easily
measured.2,23This parameter accounts for one of Band 3 protein
functions, which, as currently known, involves gas exchange, membrane deformability and ion balance across erythrocytes
Table 1. Amount of SO4=trapped in human erythrocytes during SO4=kinetics experiments and measured at both 30 and 45 min (at
equilibrium) in control conditions (untreated erythrocytes) or in erythrocytes treated with either CdCl2at different concentrations (300 µM and 1 mM) or 10 µM 4,4’-diisothiocyanatostilbene-2, 2’-disulphonic acid (DIDS). Data are presented as means ± SEM from sepa-rate N experiments, where: ***P<0.001 and **P<0.01 vs control; §P<0.05 vs 300 µM CdCl2 as determined by one-way analysis of
vari-ance followed by Bonferroni’s Multiple Comparison post hoc test.
mM SO4=trapped by erythrocytes N
Time (min) Control 300 µM CdCl2 1 mM CdCl2 10 µM DIDS
30 min 163.72±2.4 118.75±6.5** 78.52±11***,§ 20.25±12*** 4
45 min 186.00±18 162.72±4.3** 140.00±8.8***,§ 4.75±9*** 4 Figure 2. Membrane –SH groups levels (expressed as optical
density, OD measured in control (untreated erythrocytes) or in either 300 µM or 1 mM Cd2+or 2 mM N-Ethylmaleimide
(NEM)-treated erythrocytes. Bars represent the mean ± SEM from at least 8 experiments, where n.s. not significant vs control, **P<0.001 vs control,°°P<0.01 vs 300 µM Cd2+, §§§P<0.001 vs 300 µM Cd2+, #P<0.05 vs 1 mM Cd2+, as determined by one way analysis of
variance followed by Bonferroni’s Multiple Comparison post hoc test.
Figure 3. Malonyldialdehyde (MDA) levels (expressed as µM) measured in control (untreated erythrocytes) and in erythrocytes
treated with either 300 µM or 1 mM Cd2+or 2 mM NaF. Bars
represent the mean ± SEM from at least 7 experiments, where ***P<0.001 vs control, §§§P<0.001 vs 300 µM Cd2+,°°°P<0.001 vs
300 µM Cd2+, ###P<0.001 vs 1 mM Cd2+ as determined by one way
analysis of variance followed by Bonferroni’s Multiple Comparison post hoc test.
Non-commercial
membrane.2,23The efficiency of Band 3 protein in anion exchange
not only depends on an intact protein structure, but also on its crosslink with other proteins, including cytoskeletal components, hemoglobin and Glucose-6-phosphate dehydrogenase, placed underneath erythrocytes membrane.29Hence, alterations at level of
Band 3 protein may impact on these components, and vice versa. In the recent years, monitoring of Band 3 protein anion exchange capability has been more widely used to assay the effect of different conditions, i.e. toxins and oxidants6,22, 30–32 or of diseases.5,6In this
context, as previous investigations revealed that the rate constant for SO4=uptake is a sensitive tool to detect the effects of xenobiotics,22 this parameter has been used in the present work to verify the effect of Cd2+ on erythrocytes homeostasis, in an attempt to provide a novel
tool for diagnosis and monitoring of development of cadmium Cd2+
toxicity-related pathologies. This issue is in line with what recently proven by Morabito et al.,reporting about Band 3 protein monitoring in diseases associated to oxidative stress, such as canine leishmaniasis33and Systemic sclerosis.5
The present results show that the rate constant for SO4=uptake is significantly reduced by a transient exposure to both 300 µM and 1 mM Cd2+, putatively mediated by a significant increase in MDA
levels in both experimental conditions and a decrease in membrane –SH groups only in 1 mM Cd2+-treated erythrocytes. Interestingly,
the metal seems not to alter the expression levels of Band 3 protein. At his point, we may suggest that the reduction in anion exchange capability is affected by Cd2+ via different mechanisms
depending on Cd2+ concentration, as the oxidative state of
membrane –SH groups is not affected by low-concentrated Cd2+.
Hence, an impairment of Band 3 protein function in this experimental condition may be more likely due to a lipoperoxidative effect of Cd2+, as attested by high MDA levels, rather than on a
direct oxidation of membrane –SH groups. Though this result is in line with what already described by Tezcan et al.,18reporting about
MDA production in human erythrocytes after 1 hour Cd2+treatment,
its novelty relies in the altered anion exchange capability through Band 3 protein, never proven so far.
The evidence that oxidation state of membrane –SH groups is critically involved in the efficiency of transport through Band 3 protein is actually supported by other studies, as –SH groups mostly belong to Band 3 protein structure.21The importance of changes in
Band 3 protein structure caused by cysteine –SH groups oxidation, especially after exposure to NEM and pH 6.5, has been already proven.34 Nevertheless, the correspondence between reduced
membrane –SH groups and Band 3 protein anion exchange capability may be not always univocal, as Morabito et al.,30have
demonstrated that H2O2, used as an oxidant molecule on human erythrocytes, significantly reduced the rate constant for SO4=uptake through Band 3 protein, but did not alter –SH groups levels. At this point, we could even suggest that 300 µM Cd2+may act on Band 3
protein with a mechanism similar to that one exerted by H2O230with the difference that, based on the present findings, Cd2+affects Band
3 protein via lipid peroxidation, while H2O2, not inducing lipid peroxidation, seems to inflict damage by putatively affecting cytoplasmic components, cross linking with Band 3 protein.30
As said, a second result from the present study, confirming what already reported by other authors,18,35is that Cd2+induces oxidative
stress by increasing lipid peroxidation. MDA is a marker of membrane lipid peroxidation resulting from the interaction of ROS and cell membrane, which may be attributed to alterations in the antioxidant defense system, including glutathione (GSH) peroxidase, superoxide dismutase, catalase as well as non-enzymatic antioxidants, such as reduced glutathione.19,36 In particular,
cadmium Cd2+ has high affinity for cell membrane, probably
deriving from its strong interaction with lipids.37Both 300 µM and
1 mM Cd2+ CdCl2 , which did not induce hemolysis, induced lipid
peroxidation on erythrocytes membrane, with consequent impairment of anion exchange capability through Band 3 protein. A cell membrane re-arrangement due to Cd2+-induced lipid
peroxidation, in line with what previously observed by Suwalsky et al.,14seems to be responsible for the reduction in rate constant for
SO4=uptake observed after exposure to 300 µM Cd2+. Noteworthy, the hypothesis that Cd2+-induced lipoperoxidation may contribute
to the membrane –SH groups decrease observed after treatment with 1 mM Cd2+CdCl2 can’t be excluded at all. In this regard, other
authors also showed that oxidative events from alcohol administration clearly induced erythrocytes lipid peroxidation increase, –SH groups decrease and deplation of antioxidant enzyme activities.38 On this basis lipid peroxidation would affect not only
the arrangement of membrane bilayer, which per se is sufficient to reduce the rate constant of SO4=uptake,5,33but also the oxidation state of membrane –SH groups, essential for Band 3 protein function. Such combined effect would finally result in a reduction in anion exchange capability.
To better focus on the effect of Cd2+, expression levels of Band 3
protein in treated erythrocytes have been evaluated. As the decrease in the rate constant for SO4= uptake observed in Cd2+-treated erythrocytes is not associated to reduced Band 3 protein expression levels, the inhibitory effect would be rather due to the oxidation state of Band 3 protein –SH groups, or lipoperoxoidative events when high concentrated Cd2+is considered. Therefore, these findings corroborate
the hypothesis that the rate constant for SO4=uptake is a sensible tool to evaluate erythrocytes homeostasis under oxidative conditions, namely when changes in parameters currently associated to oxidative stress are undetectable. Moreover, Band 3 protein transport efficiency may be useful to assay the effects of heavy metals, whose impact on public health represents a common threat.
Figure 4. Band 3 protein and β-actin expression levels in control (untreated erythrocytes) and in erythrocytes treated with either 300 µM or 1 mM Cd2+detected by Western blot analysis. N.s. not
significant vs control as determined by one-way analysis of variance followed by Bonferroni’s Multiple Comparison post hoc test (N=4).
Non-commercial
[page 6] [Journal of Biological Research 2018; 91:7203] One more finding arising from the present work is related to
Cd2+concentrations. In particular, to prove a possible effect of
Cd2+on Band 3 protein, a brief exposure to the metal, according
to what reported in other in vitro tests14has been used. As pointed
out by Suwalsky et al.,14Cd2+was applied at concentrations up to
10 folds higher than those either used in in vivo experiments or reported as tolerable weekly intake in humans, when Cd2+enters
food chain.18Nonetheless, they are not hemolytic and allow to
rapidly evaluate erythrocytes function and morphology after a brief exposure to the metal.
As Cd2+concentrations lower than 300 µM are proven not to
alter the rate constant for SO4=uptake (data not shown), they could be proposed as not observed effect levels, though an in vivo investigation is required to better prove this aspect.
Among heavy metals, cadmium Cd2+ displays a variety of
effects35,39,40 and molecular mechanisms have been tentatively
explained, though not completely unraveled. The evidence that membrane transport systems, along with antioxidants enzymes activity and GSH levels are affected in in vivo models by exposure to Cd2+ has been already proven,13but such effects have been
described after chronic Cd2+administration, which implies that
detoxification systems and time to reach the Minimum Effective Dose should be taken into account. In this context, the present investigation would add some more knowledge about the impact of this metal on cell membrane and ion transport systems. Morabito and co-workers41have already demonstrated that HEK 293 Phoenix
cells, exposed to 200 µM Cd2+are not able to exhibit a homeostatic
response to hyposmotic shock, referred to as Regulatory Volume Decrease, common to many cell types and mediated by both ion transport through channels and exchangers.42The evidence that ion
transport can be targeted by Cd2+ motivated the present choice of
verifying the efficiency of a specific ion exchanger, such as Band 3 protein, in an anucleated cell, based also on Tezcan et al.,18
hypothesis for explaining Cd2+mechanism of action. These authors
point out that a direct interaction of Cd2+with ion transport systems
may explain Cd2+toxicity, though an inter-action between the metal
and membrane phospholipids affecting ion channel activity can’t be excluded at all. On this basis, Cd2+toxicity is not specific at the
membrane level.
Erythrocytes have been reasonably chosen as a model for this type of investigation, being continuously threatened by oxidative events, namely related to aging, strenuous exercise, and pathologies associated to high ROS levels.43,44 Therefore, their possible
adaptation to oxidative stress, and in particular to Cd2+-induced
oxidative stress, could add more information to both toxicology and oxidative stress impact on cells.
Conclusions
Taken together these findings show that: i) a significant reduction in the rate constant for SO4=uptake through Band 3 protein is seen after exposure to Cd2+; ii) such reduction is mainly
due to lipid peroxidation at low Cd2+concentrations, while, at higher
concentrations, to a possible combined effect lipid peroxidation acting on lipid bilayer arrangement and on membrane –SH groups oxidation as well; iii) in both cases expression levels of Band 3 protein are not altered; iv) Band 3 protein anion exchange capability is a suitable tool to monitor toxic effects of Cd2+. Further studies
are needed to better focus on signaling pathways possibly involved in alterations of Band 3 protein function with possible use of antioxidants preventing detrimental Cd2+effects.
References
1. Steck TL. The organization of proteins in the human red blood cell membrane. J Cell Biol 1974;62:1-19.
2. Arakawa T, Kobayashi-Yurugi T, Alguel Y, et al. Crystal structure of the anion exchanger domain of human available online erythrocyte band 3. Science 2015;350:680-4.
3. Tomishige M, Sako Y, Kusumi A. Regulation mechanism of the lateral diffusion of band 3 in erythrocyte membranes by the membrane skeleton. J Cell Biol 1998;42:989-1000.
4. Kodippili GC, Spector J, Kang GE, et al. Analysis of the kinetics of band 3 diffusion in human erythroblasts during assembly of the erythrocyte membrane skeleton. Br J Haematol 2010;150:592-600.
5. Morabito R, Remigante A, Bagnato G, et al. Band 3 protein function and oxidative stress in erythrocytes from systemic sclerosis patients with interstitial lung disease. EJCBS 2017;3-4:80-4.
6. Teti D, Crupi M, Busà M, et al. Chemical and pathological oxidative influences on band 3 protein anion-exchanger. Cell Physiol Biochem 2005;16:77-86.
7. Anong WA, Franco T, Chu H, et al. Adducin forms a bridge between the erythrocyte membrane and its cytoskeleton and regulates membrane cohesion. Blood 2009;114:1904-12. 8. Snyder LM, Fortier NL, Trainor J, et al. Effect of hydrogen
peroxide exposure on normal human erythrocyte deformability, morphology, surface characteristics, and spectrin-hemoglobin cross-linking. J Clin Invest 1985;76:1971-7.
9. Pantaleo A, Ferru E, Pau MC, et al. Band 3 erythrocyte membrane protein acts as redox stress sensor leading to its phosphorylation by p 72 Syk. Ox Med Cell Long 2016;21:1-11. 10. Ikediobi CO, Badisa VL, Ayuk-Takem LT, et al. Response of antioxidant enzymes and redox metabolites to cadmium-induced oxidative stress in CRL-1439 normal rat liver cells. Int J Mol Med 2004;14:87-92.
11. Habeebu SS, Liu J, Klaassen CD. Cadmium-apoptosis in mouse liver. Toxicol Appl Pharmacol 1998;149:203-9.
12. Bauman JW, Liu J, Klaassen CD. Production of metallothionein and heat-shock proteins in response to metals. Fundam Appl Toxicol 1993;21:15-22.
13. Sarkar S, Yadav P, Bhatnagar D. Cd2+induced lipid peroxidation
and the antioxidant system in rat erythrocytes: Role of antioxidants. J Trace Elem Biol 1997;11:8-13.
14. Suwalsky M, Villena F, Norris B, et al. Cadmium-induced changes in the membrane of human erythrocytes and molecular models. J Inorg Biochem 2004;98:1061-6.
15. Satarug JR, Baker S, Haswell-Elkins PEB, et al. A global perspective on cadmium pollution and toxicity in non-occupationally exposed population. Toxicol Lett 2003;137:65-83. 16. Chaney RL, Ryan JA, Li YM, Brown SL. Soil cadmium as a threat to human health. In: McLaughlin MJ, Singh BR, eds. Developments in plant and soil sciences, 85. Dordrecht: Kluwer Academic Publishers; 1999. pp 219-256.
17. Steffensen IL, Mesna OJ, Andruchow E, et al. Cytotoxicity and accumulation of Hg, Ag, Cd, Cu, Pb and Zn in human peripheral T and B lymphocytes and monocytes in vitro. Gen Pharmacol 1994;25:1621-33.
18. Tezcan Ö, Pandır D, Ba H. The effects of cadmium on enzymatic antioxidant system and lipid peroxidation of human erythrocytes in vitro and the protective role of plasma level of vitamins C and E. Pol J Environ Stud 2012;21:1849-54. 19. Girault L, Boudou A, Dufourc EJ. 113 Cd-, 31P-NMR and
Non-commercial
fluorescence polarization studies of cadmium(II) interactions with phospholipids in model membranes. Biochim Biophys Acta 1998;1414:140-54.
20. Asar M, Kayisly UA, Izgut-Uysal VN, et al. Cadmium-induced changes in parietal cell structure and functions of rats. Biol Trace El Res 2000;74:153-70.
21. Roy SS, Sen G, Biswas T. Role of sulfhydryl groups in band 3 in the inhibition of phosphate transport across erythrocyte membrane in visceral leishmaniasis. Arch Biochem Biophys 2005;436:121-7.
22. Morabito R, Marino A, Romano P, et al. Sulphate and chloride-dependent potassium transport in human erythrocytes are affected by crude venom from nematocysts of the jellyfish Pelagia noctiluca. Cell Physiol Biochem 2013;32:86-95. 23. Romano L, Passow H. Characterization of anion transport
system in trout red blood cell. Am J Physiol 1984;246:330-8. 24. Jennings ML. Proton fluxes associated with erythrocyte
membrane anion exchange. J Membrane Biol 1976;28:187-205. 25. Jessen F, Sjoholm C, Hoffmann EK. Identification of the anion exchange protein of Ehrlich cells: a kinetic analysis of the inhibitory effects of 4,4′-diisothiocyano-2,2′-stilbene-disulfonic acid (DIDS) and labeling of membrane proteins with 3H-DIDS. J Membrane Biol 1986;92:195-205.
26. Jain SK, Levine SN, Duett J, Hollier B. Elevated lipid peroxidation levels in red blood cells of streptozotocin-treated diabetic rats. Metabolism 1990;39:971-5.
27. Bradford MM. A rapid and sensitive method for the quantitation of microgram quantities of protein utilizing the principle of protein-dye binding. Anal Biochem 1976;72:248-54.
28. Laemmli UK. Cleavage of structural proteins during the assembly of the head of bacteriophage T4. Nature 1970;5259:680-5.
29. Pantaleo A, Ferru E, Giribaldi G, et al. Oxidized and poorly glycosylated band 3 is selective lyphosphorylated by Syk kinase to form large membrane clusters in normal and G6PD-deficient red blood cell. Biochem J 2009;418:359-67.
30. Morabito R, Romano O, La Spada G, Marino A. H2O2-induced oxidative stress affects SO4= transport in human erythrocytes. PlosOne 2016;11:1-16.
31. Morabito R, Remigante A, Casili G, et al. Magnesium prevents both H2O2-and NEM-induced oxidative damage at Band 3 protein level in human erythrocytes. Proceedings of the 68thSIF
National Congress, Italian Physiological Society, 2017 Sept 6-8, Pavia, Italy; 2017. pp 149.
32. Morabito R, Remigante A, Di Pietro ML, et al. SO4=uptake and catalase role in preconditioning after H2O2-induced oxidative stress in human erythrocytes. Pflugers Arch 2017;469:235-50. 33. Morabito R, Remigante A, Cavallaro M, et al. Anion exchange
through band 3 protein in canine leishmaniasis at different stages of disease. Pflugers Arch 2017;469:713-24.
34. Morabito R, Falliti G, Geraci A, et al. Curcumin protects -SH groups and sulphate transport after oxidative damage in human erythrocytes. Cell Physiol Biochem 2015;36:345-57.
35. Manca D, Ricard AC, Trottier B, Chevalier G. In vitro and in vivo responses of rat tissues to cadmium-induced lipid peroxidation. Bull Environ Contam Toxicol 1991;46:929-36. 36. Cimen MY. Free radical metabolism in human erythrocytes.
Clin Chim Acta 2007;390:1-11.
37. El-Demerdash FM, Yousef MI, Kedwany FS, Baghdadi HH. Cadmium-induced changes in lipid peroxidation, blood hematology, biochemical parameters and semen quality of male rats: protective role of vitamin E and b-carotene. Food Chem Toxicol 2004;42:1563-71.
38. Jabri MA, Sani M, Ritibi K, et al, Chamomile decoction extract inhibits human neutrophils ROS production and attenuates alchol-induced haematological parameters changes and erythrocytes oxidative stress in rat. Lipid Health Dis 2016;15:65.
39. Hussein T, Shukla GS, Chandra SV. Effects of cadmium on superoxide dismutase and lipid peroxidation in liver and kidney of growing rats: In vivo and in vitro studies. Basic Clin Pharmacol Toxicol 1987;60:355-8.
40. Calderoni AM, Oliveros L, Jahn G, et al. Alterations in the lipid content of pituitary gland and serum prolactin and growth hormone in cadmium treated rats. Biometals 2005;18:213-20. 41. Morabito R, Remigante A, Costa R, et al. Cd2+ affects
regulatory volume decrease (RVD) in cultured human kidney (HEK 293 Phoenix) cells. J Biol Res 2016;89:12-9.
42. Hoffmann EK, Sørensen BH, Sauter DP, et al. Role of volume-regulated and calcium-activated anion channels in cell volume homeostasis, cancer and drug resistance. Channels (Austin) 2015;9:380-96.
43. Macchi B, Di Paola R, Marino-Merlo F, et al. Inflammatory and cell death pathways in brain and peripheral blood in Parkinson’s disease. CNS Neurol Disord Drug Targets 2015;14:313-24. 44. Inal ME, Kanbak G, Sunal E. Antioxidant enzyme activities and
malondialdehyde levels related to aging. Clin Chim Acta 2001;305:75-80.