R E S E A R C H
Open Access
Novel promoters and coding first exons in
DLG2 linked to developmental disorders
and intellectual disability
Claudio Reggiani
1,2, Sandra Coppens
3,4, Tayeb Sekhara
4,24, Ivan Dimov
5, Bruno Pichon
6, Nicolas Lufin
1,6,
Marie-Claude Addor
7, Elga Fabia Belligni
8, Maria Cristina Digilio
9, Flavio Faletra
10, Giovanni Battista Ferrero
8,
Marion Gerard
11, Bertrand Isidor
12, Shelagh Joss
13, Florence Niel-Bütschi
7, Maria Dolores Perrone
10,25,
Florence Petit
14, Alessandra Renieri
15,16, Serge Romana
17,18, Alexandra Topa
19, Joris Robert Vermeesch
20,
Tom Lenaerts
1,2,21, Georges Casimir
22, Marc Abramowicz
1,6, Gianluca Bontempi
1,2, Catheline Vilain
1,6,23,
Nicolas Deconinck
4and Guillaume Smits
1,6,23*Abstract
Background: Tissue-specific integrative omics has the potential to reveal new genic elements important for developmental disorders.
Methods: Two pediatric patients with global developmental delay and intellectual disability phenotype underwent array-CGH genetic testing, both showing a partial deletion of the DLG2 gene. From independent human and murine omics datasets, we combined copy number variations, histone modifications, developmental tissue-specific regulation, and protein data to explore the molecular mechanism at play.
Results: Integrating genomics, transcriptomics, and epigenomics data, we describe two novel DLG2 promoters and coding first exons expressed in human fetal brain. Their murine conservation and protein-level evidence allowed us to produce new DLG2 gene models for human and mouse. These new genic elements are
deleted in 90% of 29 patients (public and in-house) showing partial deletion of the DLG2 gene. The patients’
clinical characteristics expand the neurodevelopmental phenotypic spectrum linked to DLG2 gene disruption to cognitive and behavioral categories.
Conclusions: While protein-coding genes are regarded as well known, our work shows that integration of multiple omics datasets can unveil novel coding elements. From a clinical perspective, our work
demonstrates that two new DLG2 promoters and exons are crucial for the neurodevelopmental phenotypes associated with this gene. In addition, our work brings evidence for the lack of cross-annotation in human versus mouse reference genomes and nucleotide versus protein databases.
Keywords: Functional genomics, Promoters, Neurodevelopmental disorders, Intellectual disability, DLG2
* Correspondence:[email protected]
Sandra Coppens, Tayeb Sekhara, and Ivan Dimov contributed equally to this work
Gianluca Bontempi, Catheline Vilain, Nicolas Deconinck, and Guillaume Smits contributed equally to this work
1
Interuniversity Institute of Bioinformatics in Brussels ULB-VUB, Brussels 1050, Belgium
6ULB Center of Medical Genetics, Hôpital Erasme, Université Libre de
Bruxelles, Brussels 1070, Belgium
Full list of author information is available at the end of the article
© The Author(s). 2017 Open Access This article is distributed under the terms of the Creative Commons Attribution 4.0 International License (http://creativecommons.org/licenses/by/4.0/), which permits unrestricted use, distribution, and reproduction in any medium, provided you give appropriate credit to the original author(s) and the source, provide a link to the Creative Commons license, and indicate if changes were made. The Creative Commons Public Domain Dedication waiver (http://creativecommons.org/publicdomain/zero/1.0/) applies to the data made available in this article, unless otherwise stated.
Background
Neurodevelopmental disorders (NDDs) are impairments of the growth, development, and function of the brain. They show vast genetic heterogeneity, pleiotropy, mono-genic to polymono-genic origin, and age-related phenotypic variability [1–6]. Considering the main phenotype, age at presentation, and pathophysiology, one can group NDDs into discrete clinical categories [1, 2]—for example, cogni-tive (e.g., global developmental delay (GDD)/intellectual disability (ID), language disorders), behavioral (e.g., autism spectrum disorders (ASDs), attention deficit hyperactivity disorders (ADHDs)), psychiatric (e.g., schizophrenia, bipo-lar disorders), and epileptic (early infantile epileptic en-cephalopathies, generalized seizures). Patients can present with phenotypes of more than one category and pheno-typic presentation can vary inside families, highlighting the importance of genetic background, modifier genes, and environment [5–7].
ID is a frequent and often severe pediatric condition. The prevalence of ID is estimated to be between 1 and 3% and lifetime costs of treatment and support average more than $1 million per person [8]. The formal diagnosis of ID requires cognitive testing, which is inaccurate below 5 years of age. Therefore, in this age category, the term global de-velopmental delay (GDD) is considered more appropriate [8]. The development of higher resolution genetic screen-ing methods has underlined the prevalence of genetic anomalies, such as copy number variations (CNVs), in chil-dren with ID [9]. Many of these CNVs occur de novo, but some can be inherited from an asymptomatic parent and nevertheless be clinically significant, increasing the diffi-culty for genetic counseling [10, 11]. Furthermore, the pre-cise pathophysiological role of the majority of structural aberrations remains unknown [12–15]. Among the causes, one could be the presence of yet uncharacterized func-tional genomic regions.
The identification of all protein-coding transcripts encoded in the human genome is still an open problem [16]. As several studies have pointed out, the expression of novel transcripts and splicing sites is highly tissue-specific [16–18]. De novo transcriptome assembly in various fetal and adult human tissues identified thousands of novel transcripts, coding regions, genes, and splicing sites [19, 20]. Alongside this, the search for first exons and their upstream promoters gave birth to several promoter predictor programs [21]. Some of them integrate DNA se-quence information with H3K4me3 histone modification and cap analysis gene expression (CAGE) data [22–26].
Genetic research in mouse has also improved the under-standing of human gene functions, annotation of the hu-man genome, and genotype–phenotype mapping of huhu-man diseases [27, 28]. Mice and humans share about 99% of their genes and many of the Mendelian/polygenic disorders [27, 29]. Furthermore, the synteny property of genes in
these organisms enables their cross-identification [17, 27]. For these reasons, mice are often used as a model organism to study candidate functional regions in humans [30].
The DLG1, DLG2, DLG3, and DLG4 gene products (also called SAP97, PSD-93, SAP102, PSD-95 in mouse) are proteins belonging to the membrane-associated guanylate kinase (MAGUK) superfamily [31]. They are located in the postsynaptic density (PSD) of glutamater-gic excitatory brain synapses with specific distribution according to brain subregions, type of synapses, syn-apse maturation, and age [31–33]. They contain differ-ent domains (e.g., PDZ, GK, SH3), allowing them to bind to multiple proteins present at the synapse [31]. As scaffolding proteins binding to both cytoskeleton proteins and signaling complexes, they play an import-ant role in the development, plasticity, and stability of synapses [31–43]. Mice and humans share conserved functional roles of DLG2 in complex cognitive and learning tasks [44].
A multi-omics integration approach can discover the link between genotypes and phenotypes, especially in the pres-ence of complex pathologies [45]. In this study, our in silico multi-omics integration analysis of several independent functional datasets contributed to the identification of two novel promoters and coding first exons in the DLG2 gene. These novel isoforms are expressed in the fetal brain and have protein coding murine equivalents. Deletions of these new elements were found statistically associated with NDDs by comparing multiple independent case and control cohorts. So far, human CNV deletions in DLG2 have been linked to psychiatric disorders [44, 46–49]. Our study now pinpoints DLG2’s association with neurodevelopmental disorders in general, and GDD/ID in particular.
Methods
Case reports
Here, we present two unrelated cases of young male chil-dren from Hôpital Universitaire Des Enfants Reine Fabiola (HUDERF; Université Libre de Bruxelles (ULB)) showing developmental delay and bearing a partial deletion of the DLG2gene as a single CNV: they both have introns 6 and 7 and exon 7 deleted; patient 1 has also lost exon 8. Both variants have been inherited from asymptomatic mothers.
Patient 1 (DECIPHER: 317136)
Patient 1 is the third child born to healthy unrelated adults and has two older unaffected sisters. He was born after an uneventful pregnancy and normal delivery. Growth param-eters were within normal limits for height, weight, and head circumference. Motor delay was evident early on. He was able to sit unsupported at 17 months and started walking at around 24 months. Around 18 months of age, the parents reported an episode of mental absence without complete loss of consciousness that lasted around 15 minutes; there
has been no recurrence. Language delay was also clearly evident; the child began forming comprehensible words not long before his third birthday. The child was referred to a pediatric neurologist by the resident school psychologist upon entry into the first year of preschool (at 3 years of age) as he had noticed major difficulties in climbing and descending stairs, as well as a hesitant and unsure gait, and a general slowness in executive function. Socially, the child was excessively shy and did not interact with others or participate in class activities; sometimes he spent almost the entire school day crying. The teachers noted that, on occasion, he repeated the same simple gesture over and over, at times for as long as 15 min.
At this time the physical examination was unremark-able. There were no facial dysmorphism nor skin pigmen-tation anomalies. The neurological examination was difficult as the child was very timid and refused to leave
his mother, but there seemed to be no apparent deficit. He smiled often and eye contact was good. He was capable of pointing to and identifying various parts of the face. The parents reported that at home he likes to pretend to be cooking and that he often plays with the dolls of his sisters. Eating and sleeping habits were normal.
A complete workup for developmental delay including a head MRI, overnight EEG monitoring, and CNS evoked potentials showed normal results. Genetic testing was performed through CGH-array 180 K ISCA (see Additional file 1: Supplementary note 8 for a description of the array-CGH method used). It revealed a heterozy-gous 523-kbp deletion inside cytogenetic band 11q14.1 producing a deletion of the coding exons 7 and 8 of
DLG2 (Fig. 1, patient 317136). Further testing of the
parents revealed the same deletion in the healthy mother, who did not report any related problems during
Fig. 1 Patient overview for the DLG2. Four tracks are shown representing the data at different granularity levels. The first track,“chr11”, shows chromosome 11 with its cytobands; the rectangular red box indicates the DLG2 location. The second track,“DLG2”, shows genomic coordinates on the top and all unified exons (Additional file 1: Table S1 and Figure S1) at the bottom. The third track,“Patients’ deletions”, shows CNV locations for the 29 patients from DECIPHER, ULB, and the literature; each box represents a deletion carrying three kinds of patient information: i) id, ii) gender, and iii) inheritance type (detailed in Additional file 1: Tables S7–S11). Vertical solid black lines represent exons, while dotted lines highlight histone peaks (HPs) discovered using Roadmap Epigenomics data integration and described in the present work. The fourth track,“Statistics”, summarizes some basic statistics about the patients’ CNVs and clinical characteristics. In the “Inheritance” pie chart, we used the following abbreviations: DNC de novo constitutive, IMH inherited from a healthy mother, IMU inherited from a mother with unknown phenotype, IPH inherited from a healthy parent, IPU inherited from a parent with unknown phenotype, IPA inherited from a parent affected by the same phenotype. NDD neurodevelopmental disorder. All genomics coordinates are in hg19
childhood nor later. Siblings were not tested according to recommendations concerning genetic tests in asymp-tomatic children.
The child was hence diagnosed with psychomotor de-velopmental delay of undetermined origin. Physical and speech therapy were continued and relational psycho-motor therapy was added to the treatment. At 4 years of age, the parents reported a clear improvement in verbal and non-verbal communication. At school, the child was more willing to participate in activities and play with other children. He was calmer and less prone to crying. His vo-cabulary reached over 100 words and he was able to make
simple sentences such as “Is where mom?” He was less
afraid to speak with people other than his parents, but he was still very apprehensive in regards to unknown people or situations. At 4.5 years of age, the parents reported fur-ther progress. Verbally, the child could make full sen-tences but used“me” instead of “I” as a subject. He also had difficulty conjugating verbs. He could count to three but was not yet able to recognize colors. In view of the persisting difficulties in preschool, an eventual placement in a special education program was discussed with the parents. On cognitive evaluation at the age of 6 years by verbal and performance Wechsler Preschool and Primary Scale of Intelligence (WPPSI-R), his full scale IQ was 65 (patient details reported in Additional file 1: Table S11).
Patient 2 (DECIPHER: 317185)
Patient 2 is the first and only child born to healthy unre-lated adults. Pregnancy and delivery were uneventful. Microcephaly was noted at birth (head circumference of 32 cm, 2.3 standard deviations below the mean) and the birth weight was 2990 g. The Apgar score was 7-8-10. Height and weight growth rates were normal, with pro-gressive microcephaly. The medical history included re-current otitis media (requiring bilateral tympanic tube placement), slight bilateral hyperopia (diagnosed at age 2), and surgical excision of right pre-auricular tag. Motor milestones were marginally delayed (seating position, 8 months; walking, 18 months), but there was a clear delay in language and social skills. The child exhibited poor vis-ual contact, lack of facial expression, and minimal social exploratory behavior.
The child was first referred to a pediatric neurologist with concerns regarding global developmental delay at the age of 17 months. At this time, physical examin-ation showed microcephaly (head circumference of 43 cm, 3.6 standard deviations below the mean) and a low-set right ear with an underfolded helix. There were no other facial dysmorphism and skin pigmentation anomal-ies. Neurological evaluation revealed a generalized mild hypotonia with no other abnormal findings.
A complete workup for developmental delay including head MRI, overnight EEG monitoring, and CNS evoked
potentials did not show any specific findings. CGH-array 180 K ISCA (see Additional file 1: Supplementary note 8 for a description of the array-CGH method used) re-vealed a heterozygous 463-kbp deletion inside cytogen-etic band 11q14.1, producing a deletion of coding exon 7 of DLG2 (Fig. 1, patient 317185). Further testing of the parents revealed the same deletion in the healthy mother, who did not report any related problems during childhood nor later.
From the age of 3 onwards, he was sent to a school for special educational needs. At the age of 5, he presented a clear global developmental delay, without autistic features. Verbal comprehension was poor and expression was limited to a few words with many phonological difficulties. At school, he had learned to use augmentative and alter-native communication devices. Reasoning and visuospatial skills were limited, with a poor attention span. Gross motor function was in the normal range but he still had difficulties with fine motor skills. He could count to three and began to recognize colors. On cognitive evaluation at the age of 6 by WPPSI-R, his full scale IQ was 62 (patient details reported in Additional file 1: Table S11).
Standard karyotypes as well as FMR1 repeat amplification analysis were normal in both patients.
Datasets
Patient and control CNV datasets
We first considered two public CNV datasets: i) the Database of Chromosomal Imbalance and Phenotype in Humans Using Ensembl Resources (DECIPHER) [15], a collection of thousands of patients with rare copy num-ber variations and phenotypes; and ii) the Database of Genomic Variants (DGV) [50], a collection of structural variations identified in healthy control samples. We used release version dated January 1st, 2015 for DECIPHER and October 16th, 2014 for DGV. As validation, we used two more datasets: the Coe et al. [11] and Cooper et al.
[51] “Developmental Delay” case and control cohorts
recently available through the UCSC genome server and public repositories, and the database of structural vari-ants discovered in the 1000 Genomes Project [52]. These are hereafter named GDD/ID (cases or controls, as specified) and 1KG datasets, respectively.
DLG2has been known to be linked to psychiatric disor-ders [44, 46–49]; therefore, we collected from the literature those patients whose clinical description and CNV were publicly available (Table 1). Genomic locations in hg18 were converted to hg19 using the UCSC liftOver tool.
Since those datasets come from distinct studies, differ-ent protocols might have been used to report CNVs. Hence, we decided to apply a common set of filtering rules on all datasets as a preprocessing step. We consid-ered CNVs having a length between 50 bp and 3 Mbp (as imposed by DGV) with an absolute log2ratio value
Table 1 Description of the 29 patients having deletions in the DLG2 7-9 region Patie nt ID Type of CNV DLG2 CNV hg19 coordinat es CNV size (Mb) DLG2 delete d features Gen der O ther rare CNVs Inh eritance of DLG2 variant Neurod evelop menta l phe notype Patie nt 1 31 7136 D el Chr11: 84245 639-84 77274 1 0.52 Exons 7– 8; HPi n7 Mal e 0 Inh erited from an unaf fected moth er C, B Patie nt 2 31 7185 D el Chr11: 84334 015-84 79721 9 0.46 Exon 7; HPi n7 Mal e 0 Inh erited from an unaf fected moth er C, B DEC IPHER 2486 68 D el Chr11: 84548 697-84 62896 3 0.08 Intron 7 Mal e 32 U nknow n C DEC IPHER 2565 92 D el Chr11: 84456 097-84 60744 0 0.15 Intron 7 Mal e 1 a U nknow n C, B DEC IPHER 2632 16 D el Chr11: 84003 279-84 27607 2 0.27 Exons 8– 9; HPi n8 Mal e 0 Inh erited from a pare nt wit h same phe notype Unknow n DEC IPHER 2708 92 D el Chr11: 84108 622-84 33425 3 0.23 Exon 8; HPi n8 Mal e 0 Inh erited from normal pare nt C, B DEC IPHER 2722 51 D el Chr11: 83805 117-84 21502 4 0.41 Exons 9– 13 ; HPin8 Fema le 3 b Inh erited from an unaf fected moth er C, B, P DEC IPHER 2739 69 D el Chr11: 83996 254-84 21490 3 0.22 Exon 9; HPi n8 Mal e 0 U nknow n Unknow n DEC IPHER 2780 11 D el Chr11: 84367 238-84 72134 0 0.35 Exon 7; HPi n7 Mal e 1 c D e novo cons titu tive C DEC IPHER 2811 97 D el Chr11: 84085 773-84 47708 8 0.39 Exon 8; HPi n7-8 Mal e 0 Inh erited from an unaf fected moth er C, B DEC IPHER 2848 04 D el Chr11: 84046 644-84 53963 6 0.49 Exon 8; HPi n7-8 Mal e 0 D e novo cons titu tive C, B DEC IPHER 2866 41 D el Chr11: 84291 759-84 47708 8 0.19 Intron 7; HPi n7 Mal e 1 d Inh erited from an unaf fected moth er Unknow n DEC IPHER 2880 27 D el Chr11: 84046 530-84 45468 7 0.41 Exon 8; HPi n7-8 Mal e 1 e Inh erited from an unaf fected moth er C, B DEC IPHER 2885 01 D el Chr11: 84334 017-84 59563 4 0.26 Intron 7; HPi n7 Fema le 1 f U nknow n Other DEC IPHER 2888 42 D el Chr11: 84334 017-84 59563 4 0.26 Intron 7; HPi n7 Un know n 1 g U nknow n Other DEC IPHER 2897 34 D el Chr11: 84595 575-84 90757 9 0.31 Exons 5– 7 Un know n 2 h D e novo cons titu tive C, B DEC IPHER 2926 20 D el Chr11: 84046 614-84 21476 2 0.17 Intron 8; HPi n8 Fema le 0 U nknow n C DEC IPHER 3000 42 D el Chr11: 84046 614-84 41950 2 0.37 Exon 8; HPi n8 Un know n 0 U nknow n C DEC IPHER 3001 09 D el Chr11: 84419 443-84 58129 2 0.16 Intron 7; HPi n7 Un know n 0 Inh erited from a mot her of unkno wn phenoty pe C DEC IPHER 3001 11 D el Chr11: 84367 238-84 53966 5 0.17 Intron 7; HPi n7 Un know n 0 Inh erited from a mot her of unk nown phe notype C 13 39 [ 10 ] D el Chr11: 83595 987-84 48964 9 0.89 Exons 8– 18 ; HPin7-8 Un know n 1 i D e novo cons titu tive C, B, E L4 [ 48 ] D el Chr11: 84003 321-84 26632 9 0.26 Exons 8– 9; HPi n8 Un know n U nknow n U nknow n P L5 [ 46 ] D el Chr11: 83945 764-84 21496 4 0.27 Exons 9– 11 ; HPin8 Mal e U nknow n Inh erited from an unaf fected mot her P L6 [ 47 ] D el Chr11: 83795 102-84 16532 5 0.37 Exons 9– 13 ; HPin8 Un know n U nknow n D e novo cons titu tive P L7 [ 47 ] D el Chr11: 84328 458-84 54841 6 0.22 Intron 7; HPi n7 Un know n U nknow n D e novo cons titu tive P
Table 1 Description of the 29 patients having deletions in the DLG2 7-9 region (Co ntinued) L8 [ 49 ] D el Chr11:84 14369 7-8431 2722 0.17 Exon 8; HPi n8 Un known 1 j Un know n P L9 [ 49 ] D el Chr11:84 11138 4-8435 4568 0.24 Exon 8; HPi n8 Un known 1 k Un know n P L11 [ 44 ] D el Chr11:83 96163 3-8463 3847 0.67 Exons 8– 11; HPin7-8 Fema le Un know n Inh erited from an unaf fected mot her P L13 [ 44 ] D el Chr11:84 37585 9-8452 1180 0.145 Intron 7; HPi n7 Mal e Un know n Un know n P Neurodevelopmental phenotype abbreviations : C cognitive, B behavioral, P psychiatric, E epilepsy; we used patients ’DECIPHER id whenever available; this is the case for the two ULB patients and the 18 public DECIPHER pa ti e nt s. Th e 21 st en try is id e nt if ie d b y the rep o rt ed id nu m be r in Vu lt o-va n Si lf ho u t e t al . [ 10 ]. We pr o vi de in sid e squ ar e br ac k et s ref er en ce s fo r the ot he r ei gh t pa ti en ts fo un d in the li ter at ur e (L4 -9 , L1 1, L 13 ). Se e Ad di tio na l fi le 1 :T a b le sS 7– S 11 fo r a mo re de ta il ed d es cr ip tio n. H Pi n7 an d HP in 8 ar e na me s gi ve n to the ne w DL G 2 fu nc tio na l reg io ns de sc rib ed in thi s wo rk (s ee te xt ) a30-kbp dup on chrY. Genes: AKAP17A , ASMT b225-kbp dup and 278-kbp dup on chr9, 148-kbp dup on chr11. Genes: TRPM3 , TMEM2 , EHF c300-kbp del on chr17 variant inherited from normal parent. Genes: SLC39A11 d290-kbp dup on chr17 inherited from mother. 22 genes e130-kbp dup on chr7 inherited from mother. Gene: AKAP9 f180-kbp del on chr1. Genes: INPP5B , MTF1 , SF3A3 g541-kbp del on chr16. 28 genes h191-kbp del on chr1 and 101-kbp del on chr12; both inherited from mother. Genes: SUMF1 , PIK3C2G , RERGL i5-Mbp dup on chr15; de novo. Several genes j41-kbp del on chr1. Gene: DNAJC6 k23-kbp dup on chr20. No gene
≥0.32 (as routinely done at Université Libre de Bruxelles Center for Medical Genetics). Furthermore, DGV and literature structural variations are described categorically as either duplication or deletion; therefore, for each dataset, we converted log2ratios into categorical values using the following rationale: duplication for positive value, deletion for negative value. For the whole genome enrichment analysis, we used the release version dated April 22nd, 2016 for DECIPHER and July 2015 for DGV (see Additional file 1: Supplementary note 2 for details).
Roadmap Epigenomics Project
From the Roadmap Epigenomics Project, we used genome-wide profiling of six histone modification markers (H3K4me3, H3K4me1, H3K27ac, H3K9ac, H3K27me3, H3K9me3) in 13 cell lines and tissues: H1 cell line, H1 derived neuronal progenitor cultured cells (H1 NPC), H1 derived mesenchymal stem cells (H1 mesenchymal), H1 BMP4 derived mesendoderm cultured cells (H1 mesendo-derm), fetal brain, and eight adult brain tissues (Additional file 1: Figures S19 and S20). We compared ChIP-Seq signal to a corresponding whole-cell extract sequenced control to identify narrow regions of enrichment (peaks) using MACS v2.1.0 peak caller with default parameters. Since the Roadmap Epigenomics dataset provides at least one ChIP-Seq control, we identified peaks for every possible profile–control combination in the tissue. In this work, we used Roadmap Epigenomics data version 9.
Following the general consensus regarding the histone code [53, 54], we used H3K4me3 as a marker of pro-moter potential and we grouped H3K9ac, H3K27ac, and H3K4me1 markers as genic activators and H3K27me3 and H3K9me3 markers as genic repressors.
Chromatin modification datasets (ENCODE Project)
We used histone modification and transcription factor binding datasets from the human and mouse ENCODE projects via the UCSC genome browser.
RNA-Seq data and pipeline (ENCODE Project)
The ENCODE Project provides a collection of genomics data available for the analysis of functional elements [55]. Starting from RNA-Seq data, we ran a pipeline to understand the transcriptional role of the two new func-tional elements described in this work (see “Results”). The pipeline consists of two main steps: de novo tran-scriptome assembly and gene/isoform detection. We investigated fetal brain RNA-Seq paired-end data (hg19) and collected BAM alignment files for six experiments (ENCODE ENCSR000AEW, ENCSR000AFD, ENCSR00 0AFE, ENCSR000AEX, ENCSR000AEY, ENCSR000AFJ; see Additional file 1: Table S19). Running cufflinks v2.2.1 [56] in de novo configuration (without -g or -G options) with –no-update-check and –library-type fr-firststrand
parameters resulted in a GTF file per each BAM given as input. The assemblies were then merged into a master transcriptome via the cuffmerge tool. We then computed the detection and visualization of exons and splice junc-tions using QoRTs v1.0.1 [57] (java -Xmx4G -jar <
QORTS_JARFILE > QC –stranded command) and
Junc-tionSeq v0.6.9 [58] software (runJuncJunc-tionSeqAnalyses function with analysis.type = exonsOnly and
meth-od.GLM = advanced parameters). We ran the same
pipeline on fetal and adult non-brain tissues such as liver (ENCODE ENCSR000AFB), muscle (ENCODE ENCSR000AFF and ENCSR000CUI), skin (ENCODE ENCSR000AFG), thyroid (ENCODE ENCSR000AFK), and fibroblast of dermis (ENCODE ENCSR000CUH). Because adult brain paired-end RNA-Seq data were not available through ENCODE, we used paired-end RNA-Seq data from frontal, temporal, occipital, and cerebellum adult brain tissues from Yao et al. [59].
We also retrieved mouse newborn brain RNA-Seq data from ENCODE: hindbrain (ENCODE ENCSR749BAG), midbrain (ENCODE ENCSR255SDF), and forebrain (EN-CODE ENCSR723SZV). From these three tissues, we collect six BAM files (see Additional file 1: Table S20 for details).
In our genome-wide analysis, we estimated the presence of a splicing site by means of differential coverage between adjacent nucleotides. We used
bedtools [60] v2.25.0 (subcommand genomecov with
parameters –bg –split) to measure coverage per each
nucleotide, resulting in a bedgraph file for each fetal brain BAM file.
CAGE peaks and FANTOM5 project
Cap analysis gene expression (CAGE) is a method to determine transcription start sites on a genome-wide scale. We investigated the CAGE signal using FAN-TOM5 project [61]. We retrieved, from the project repository and UCSC (access date: 19 October 2016), robust CAGE peaks identified by decomposition-based peak identification (DPI) [62]. Robust CAGE peak data include position (start, end), strand, tissue-specific expression level (in tags per million), and
tissue type. For each robust CAGE peak in
H3K4me3 peak regions (HP, see “Results”), we
com-pared the expression level in brain versus other tis-sues. The list of brain tissues for the former group is reported in Additional file 1: Table S18.
Conservation analyses
The conservation analysis of human genomic sequences or regions was performed in mouse via the NCBI BLAST online tool and across vertebrates by means of the CEGA database [63].
Genomic coordinates, exons, and isoforms DLG2/Dlg2 genome references
From UCSC we gathered and preprocessed data related to DLG2 with the following objectives: i) gather all exons belonging to all isoforms and number them uniquely; ii) understand which exons are shared across isoforms and which serve as alternative promoters. The result of this preprocessing step is reported in Fig. 1 (details in Additional file 1: Table S1 and Figure S1). In this paper we use UCSC numerical reference to identify an exon; we also provide the Ensembl DLG2 coordinates and isoforms (Additional file 1: Table S2 and Figure S2) and comparison of both annotations (Additional file 1: Table S3). For the whole genome analysis, we refer to the coordinates available in the UCSC browser knownGene table (hg19) regarding genes and exons.
For mouse, we list the coordinates of the UCSC known Dlg2 exons in Additional file 1: Figure S3 and Table S4; we also report the Ensembl Dlg2 exonic coordinates for two mouse strains (BALB/cJ and A/J) in Additional file 1: Figures S4 and S5 and Tables S5 and S6.
DLG2/Dlg2 exons and amino acid mapping
We used NCBI BLAST (access date: November 2016) and UniProtKB/Swiss-Prot (access date November 2016) databases to align DNA to amino acid sequences and to map orthologous exons between human and mouse
DLG2-Dlg2 genes. The mapping between DLG2/Dlg2
exons is reported in Additional file 1: Supplementary notes 3–6. We describe here the information regarding the unmapped DLG2/Dlg2 exons. In Parker [32], the expression at the RNA level of the six mouse DLG2 (also known as PSD-93) protein isoforms described by the authors were detected by reverse transcription RT-PCR using isoform-specific primers. We used the reported forward primers of PSD-93 zeta and PSD-93 gamma in NCBI BLAST to locate the start of their coding regions in mm10 genomic coordinates. For the former, the primer
aligns to chr7:90504814-90504835, around 600-kbp
upstream of the first UCSC mouse exon, possibly corre-sponding to the coding region of human exon 3; for the latter, the primer aligns between mouse exons 3 and 4, chr7:91711767-91711790, orthologously mapping to hu-man exon 10 (Additional file 1: Supplementary note 6). Likewise, RT-PCR primers for PSD-93 beta and epsilon map to the two new exons described in this work (see “Results”; Additional file 1: Supplementary Note 6). We then compared the murine protein sequences reported in UniProtKB/Swiss-Prot to the human genome (see Additional file 1: Supplementary notes 3 and 4 for details). The beginning of the mouse Q91XM9-7 (also known as PSD-93 zeta) isoform, from position 38 to position 156, aligns with the start of the human Q15700-2 isoform (encoded by human exons 3 to 6)
with E-value of 1.1 × 10−58(NCBI BLAST score). The first seven amino acids (MQHAFIP) of the mouse Q91XM9-3 (also known as PSD-93 gamma) isoform match with the end of human exon 10. No known mm9 or mm10 UCSC or Ensembl Dlg2 exons code for these murine zeta and gamma protein isoforms.
Statistical analyses
All statistical analyses were performed using R software, version 3.2. Regarding the whole genome analysis, while it was possible to merge DECIPHER NDD patients with GDD/ID cases, we had to deal with missing patient information in 90.9% of the total GDD/ID CNV controls [11, 51]. Merging DGV and GDD/ID control cohorts would filter out most of the data in the latter (Additional file 1, Supplementary notes 1 and 2). For this reason, we classify as statistically enriched for NDD cases those regions having a p value <0.05 after Bonferroni correction in both the fol-lowing settings: DECIPHER + GDD/ID cases versus DGV and DECIPHER + GDD/ID cases versus GDD/ID controls. Results
Identification of novel DLG2 genomic elements (HPs)
In the ULB cohort, DECIPHER, and the literature we found 29 patients with a monogenic deletion involving the
DLG2 gene (Table 1; see“Methods”). To our knowledge,
we are the first to analyze these patients as a cohort. Except for five patients (three with unknown phenotypes), they all present neurodevelopmental symptoms (see the “Clinical description of the 29 DLG2 patients cohort” section below). All deletions alter the region between exons 7 and 9 (7-9 region; Fig. 1). In our effort to explain why intragenic DLG2 deletions occur exclusively in the 7-9 region, we noticed that 10/27-9 (34%) patients have only intronic aberrations, three of which have that intronic deletion as a single variation reported in DECIPHER (DECIPHER 292620, 300109, 300111; Fig. 1), possibly suggesting pathogenic involvement of yet unknown func-tional elements in intron 7 or 8 of DLG2.
We investigated the presence of unknown regulatory elements in the DLG2 7-9 introns by integrating the Road-map Epigenomics Project data in a neuronal developmental scheme (Fig. 2). We compared histone modifications in available tissues and cell types related to brain and two other tissues as negative controls. We ordered these modifi-cations along a developmental timeline: stem cells, neur-onal progenitors, fetal brain, and adult brain. As depicted in Fig. 2 (see also Additional file 1: Figures S19 and S20 for all adult brain tissues), once a cell specializes as a brain cell, four regions enriched in H3K4me3 arise in the 7-9 region, suggesting the presence of four promoters. Two of these overlap exons 7 and 9, as we can expect from known DLG2 isoforms (Additional file 1: Figure S1). The other two are in the middle of introns 7 and 8, positing them as novel
functional elements. We called them H3K4me3 peaks of the DLG2 7-9 region (HPs): for convenience, HPin7 for in-tron 7 and HPin8 for inin-tron 8 (see Table 2 for coordinates).
Describing new promoters and coding first exons inside HPin7 and HPin8 in fetal brain
We investigated the functional role of HPin7 and HPin8 by gathering further independent bioinformatics datasets
(see “Methods”). Evidence of multiple robust CAGE
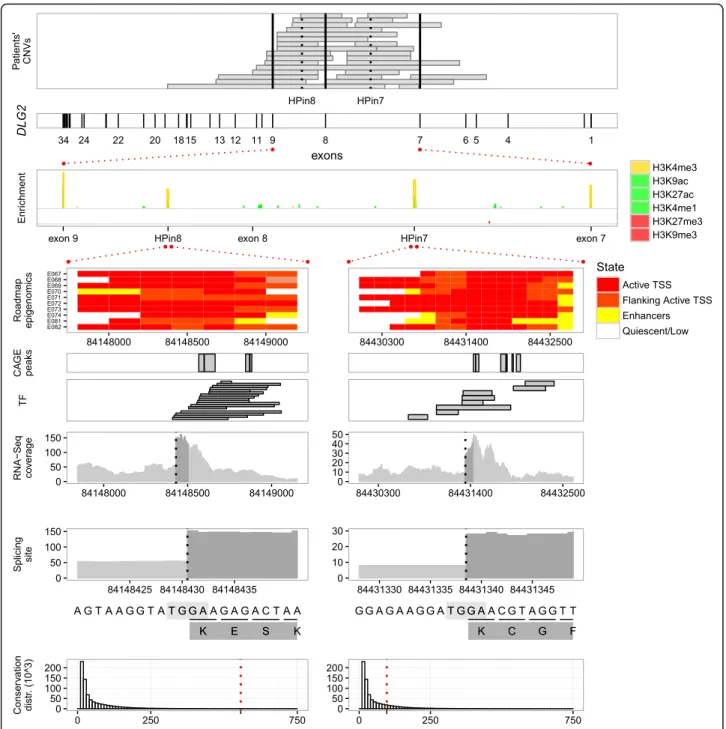
peaks, human expressed sequence tags (ESTs), transcrip-tion factors (TFs), and high expression levels located in the HPs characterized them as having promoter activity (Fig. 3; Additional file 1: Figures S30–S34, S39, and S40). Likewise, ENCODE and Roadmap Epigenomics Project categorize HPin7 and HPin8 as active promoters in brain tissues and as weak/repressed/poised elements in other tissues (see the“Roadmap Epigenomics” panel in Fig. 3 and Additional file 1: Figures S16, S17, S21, and S22) [24, 64].
We studied in detail the HPin7 and HPin8 levels of expression in RNA-Seq data available from ENCODE (see“Methods”). The coverage in BAM files, along with CAGE and GTEx expression data [65], confirmed high DLG2transcriptional activity in brain tissues, specifically at the fetal stage (Additional file 1: Figures S23–S29, S32, S35–S40, and S45–S50). This suggests that the HPs
could be the start of two new brain-specific DLG2 iso-forms. De novo transcriptome assembly with JunctionSeq, absence of reads splicing from upstream exons into the HPs, and absence of antisense reads strongly support such a hypothesis (Table 3; Additional file 1: Figures S39–S42 and S54 and Table S14).
We then looked for the presence of donor splicing sites to define the 3′ border of HPin7 and HPin8 exons. An abrupt difference of 46 and 59 in RNA-Seq read coverage locates them at positions chr11:84431338-9 and chr11:84148430-1, respectively (Additional file 1: Figures S43, S44, S55, S62, and S63). For both HPs, the four nucleotides at the splice site match the consensus AG.GT donor sequence [66, 67] (the“Splicing site” panel in Fig. 3).
The above analyses define two new DLG2 exons. We
named these novel human exons “coding first exons”
(CFEs): CFEin7 inside HPin7, CFEin8 inside HPin8. We pro-vide a schematic representation of HP, promoter, and CFE nomenclature in Fig. 4a. To find the exons which CFEin7 and CFEin8 splice into, we used the RNA-Seq reads that split over the donor site into the acceptor site. Those reads end in DLG2 exon 8 and exon 11, respectively (Fig. 4b).
Collectively, our analyses strongly suggest that HPin7 and HPin8 promote two new bona fide DLG2 isoforms (Table 3 and Fig. 4b). Several observations emerge from
(See figure on previous page.)
Fig. 2 Discretized ChIP-Seq profile overview of different markers across different tissues or cell types. The data come from profile–control comparisons of Roadmap Epigenomics Project data using MACS v2.1.0. The y-axis reports the -log10p value as measurements of marker against control enrichments; the greater the height, the higher the statistical confidence. Each of the nine stacked plots reports a discretized ChIP-Seq profile for different markers in one specific tissue. Starting from the top we have stem cells (H1 cell line), neuronal progenitor cells (H1 derived neuronal progenitor cultured cells), fetal brain, adult brain tissues, and, at the bottom, one non-brain-related tissue, H1 derived mesenchymal stem cells. In each plot, histone modifications are grouped according to their related function: promoter marker (in gold), activation markers (“act”, in green) or repression markers (“rep”, in red). The same y scale is applied to the three groups. Exons 7, 8, and 9 along with HPin7 and HPin8 are reported on the x-axis. All markers are listed in the legend, mixed and overlapped in the plot. A white box in the marker legend means data are not available. All genomic coordinates are in hg19
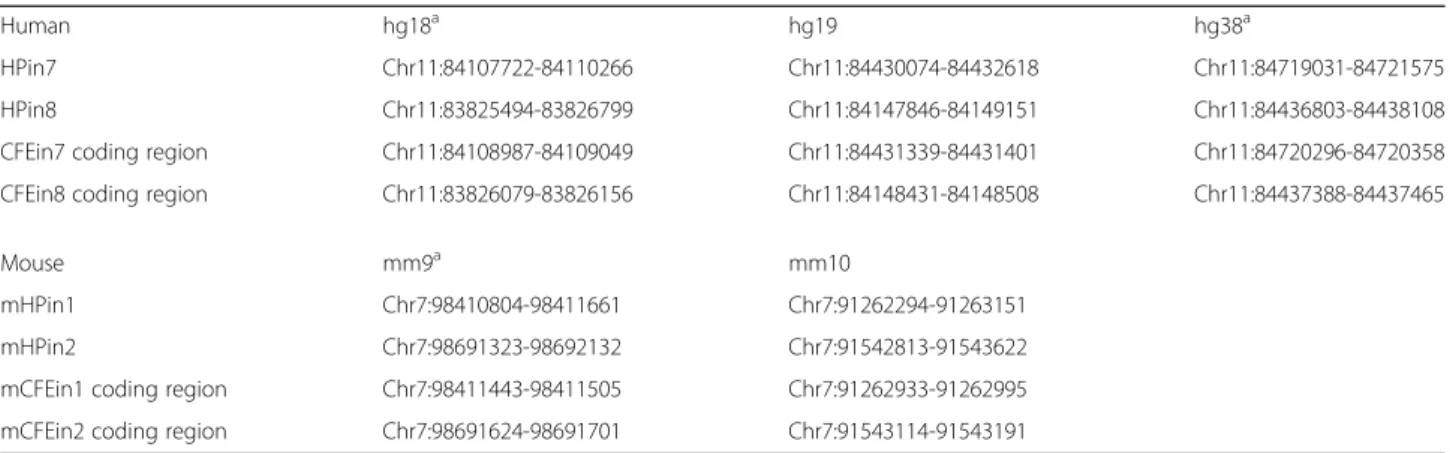
Table 2 Novel promoters and coding first exon coordinates
Human hg18a hg19 hg38a
HPin7 Chr11:84107722-84110266 Chr11:84430074-84432618 Chr11:84719031-84721575 HPin8 Chr11:83825494-83826799 Chr11:84147846-84149151 Chr11:84436803-84438108 CFEin7 coding region Chr11:84108987-84109049 Chr11:84431339-84431401 Chr11:84720296-84720358 CFEin8 coding region Chr11:83826079-83826156 Chr11:84148431-84148508 Chr11:84437388-84437465
Mouse mm9a mm10
mHPin1 Chr7:98410804-98411661 Chr7:91262294-91263151 mHPin2 Chr7:98691323-98692132 Chr7:91542813-91543622 mCFEin1 coding region Chr7:98411443-98411505 Chr7:91262933-91262995 mCFEin2 coding region Chr7:98691624-98691701 Chr7:91543114-91543191
Genomic coordinates of the novel functional regions found the human DLG2 and mouse Dlg2 genes. We investigated their location in hg19 and mm10, respectively. Their corresponding location in other genome references were retrieved by means of the UCSC liftOver tool. In DLG2, we name HPin7 and HPin8 the H3K4me3 peak found in introns 7 and 8, respectively. Inside HPin7 and HPin8 we discovered a protein-coding exon. We identify the coding part of the human exons as CFEin7 (inside HPin7) and CFEin8 (inside HPin8). In mouse, we name the orthologous H3K4me3 peak regions mHPin1 and mHPin2, as they are located in the first and second introns of the Dlg2 gene. We identify the coding part of the mouse exons as mCFEin1 (inside HPin1) and mCFEin2 (inside HPin2)
a
an evaluation of RNA-Seq profiles in human tissues. HP isoforms seem differentially expressed according to brain regions. CFEin7 and CFEin8 have peaks of expression at the fetal stage. The DLG2 7-9 region is quasi-devoid of transcription in non-brain or adult tissues. Nascent transcription is present in introns 6, 7, and 8 as classic-ally found for long introns [68, 69]. We checked for the absence of the recursive exon motif YYYAGGURAG in CFEin7 and CFEin8 to rule out the presence of recursive splicing [69].
We summarize our bioinformatic analyses regarding HPin7 and HPin8 in Fig. 3 and Table 3.
HPin7 and HPin8 nucleotide conservation
To characterize further these new isoforms, we checked for their existence in other species. Across vertebrates, elements corresponding to HPin7 and HPin8 are listed in the Con-served Elements from Genomics Alignments (CEGA) data-base [63], reporting moderate and high conservation scores, respectively (the“Conservation distribution” panel in Fig. 3;
Fig. 3 HPin7 and HPin8 data integration. The integration of genotypic, epigenomic, RNA-Seq, and complementary functional datasets for DLG2 with a focus on HPin7 and HPin8, along with the 5′ splice site locations. Conservation is represented by the CEGA score [63]
Table 3; Additional file 1: Figures S14 and S15). We then studied the murine conservation of HPin7 and HPin8 nucle-otides by comparing their sequences with the mouse genome using NCBI BLAST. Both are highly conserved in the Dlg2 gene, in the first and second introns. They overlap ChIP-Seq peaks of H3K4me3 in mouse brain tissues (ENCODE data visualized in Additional file 1: Figures S12 and S13), endorsing the same pattern seen in the human data. We called them mouse HPs (mHPs): mHPin1 in in-tron 1 and mHPin2 in inin-tron 2 (see Table 2 for coordinates).
Orthologous HP isoforms found in mouse
We inspected the transcriptional profile of mHPs using newborn mouse RNA-Seq data from ENCODE
(see “Methods”). In the mHP regions, we observed
transcriptional activity and the presence of splicing donor sites. RNA-Seq reads starting in mHPin1 and mHPin2 do splice into Dlg2 exon 2 and exon 4, re-spectively. These features, added to the presence of H3K4me3 peaks and the absence of upstream reads splicing into the HP regions, strongly suggest, as in hu-man, the existence of new Dlg2 promoter and first exons inside mHPs (Fig. 4c; Additional file 1: Figures S51–S53). We named the new mouse exons mCFEs: mCFEin1 inside mHPin1, mCFEin2 inside mHPin2.
Human and mouse HPs promote protein coding isoforms
We used NCBI and UniProt to investigate the coding po-tential of the exons featured in HPs. UniProt includes the manually annotated and reviewed protein isoform dataset
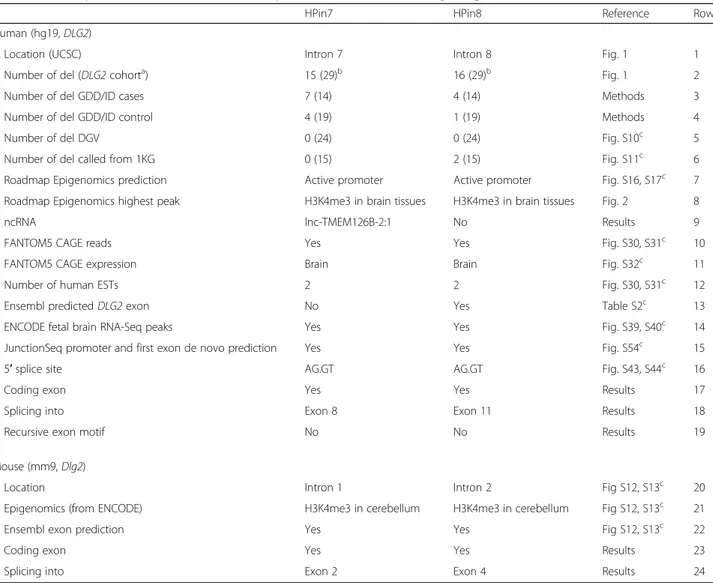
Table 3 Summary of information collected and analyzed from different sources regarding HPin7 and HPin8 of DLG2
HPin7 HPin8 Reference Row
Human (hg19, DLG2)
Location (UCSC) Intron 7 Intron 8 Fig. 1 1
Number of del (DLG2 cohorta) 15 (29)b 16 (29)b Fig. 1 2
Number of del GDD/ID cases 7 (14) 4 (14) Methods 3
Number of del GDD/ID control 4 (19) 1 (19) Methods 4
Number of del DGV 0 (24) 0 (24) Fig. S10c 5
Number of del called from 1KG 0 (15) 2 (15) Fig. S11c 6
Roadmap Epigenomics prediction Active promoter Active promoter Fig. S16, S17c 7 Roadmap Epigenomics highest peak H3K4me3 in brain tissues H3K4me3 in brain tissues Fig. 2 8
ncRNA lnc-TMEM126B-2:1 No Results 9
FANTOM5 CAGE reads Yes Yes Fig. S30, S31c 10
FANTOM5 CAGE expression Brain Brain Fig. S32c 11
Number of human ESTs 2 2 Fig. S30, S31c 12
Ensembl predicted DLG2 exon No Yes Table S2c 13
ENCODE fetal brain RNA-Seq peaks Yes Yes Fig. S39, S40c 14
JunctionSeq promoter and first exon de novo prediction Yes Yes Fig. S54c 15
5′ splice site AG.GT AG.GT Fig. S43, S44c 16
Coding exon Yes Yes Results 17
Splicing into Exon 8 Exon 11 Results 18
Recursive exon motif No No Results 19
Mouse (mm9, Dlg2)
Location Intron 1 Intron 2 Fig S12, S13c 20
Epigenomics (from ENCODE) H3K4me3 in cerebellum H3K4me3 in cerebellum Fig S12, S13c 21
Ensembl exon prediction Yes Yes Fig S12, S13c 22
Coding exon Yes Yes Results 23
Splicing into Exon 2 Exon 4 Results 24
For each source, a reference is reported. For rows 2–6, values in parentheses stand for the number of deletions overlapping the DLG2 7-9 region. Row 3: the number of total GDD/ID cases corresponds to the number of intragenic deletions, i.e., those that are not affecting other genes; hence, nssv_3460188 and nssv_3461505 are not
considered (Additional file1: Figure S6). The“5′ splice site” entry reports the two nucleotides before and after the exon–intron border (marked with the dot character)
a
The DLG2 cohort is a collection of deletions from DECIPHER, ULB, and the literature overlapping the DLG2 7-9 region b
Five deletions overlap both HPin7 and HPin8 c
UniProtKB/Swiss-Prot. Using BLASTX [70, 71], we found that human HP DNA sequences match with the beginning of some human predicted proteins found in NCBI BLAST databases (Additional file 1: Supplementary note 5). These predictions aligned to two known mouse Dlg2 protein isoforms found in UniProtKB/Swiss-Prot: Q91XM9-2 (known as 93 beta) and Q91XM9-6 (known as PSD-93 epsilon). The beginning of these mouse proteins correspond to the exons found in mHPin1 and mHPin2 (“Methods”; Additional file 1: Supplementary notes 3 and 4). Hence, proteic experimental evidence in mouse added to evolutionarily conserved gene structures, epigenetic regulation, brain expression, and amino acid sequences in-dicate coding potential in both genomes.
The genomic coordinates of the coding regions inside human CFEs and mouse mCFEs are presented in Table 2. The complete nucleotide and amino acid human sequences are available in Additional file 1: Figure S88 and S89. The
nucleotides corresponding to the coding segments of CFEin7 and CFEin8 are pictured in Fig. 3 (see the dark grey in RNA-Seq coverage and Splicing site panels). The human coding sequences have been registered in GenBank under references KY368394 (CFEin8) and KY368395 (CFEin7). Likewise, mouse coding sequences have been registered in GenBank under references KY368396 (mCFEin2) and KY368397 (mCFEin1).
New DLG2 and Dlg2 gene models
Remarkably, despite experimental evidence of the murine PSD-93 beta and epsilon proteins and their referencing in UniProtKB/Swiss-Prot, both human and mouse genome references lack their corresponding exon annotations. CFEs do correspond to the first exons of these beta and epsilon isoforms. Hence, the identification and detailed assessment of the CFEs presented in this work offer new DLG2 and
a
d
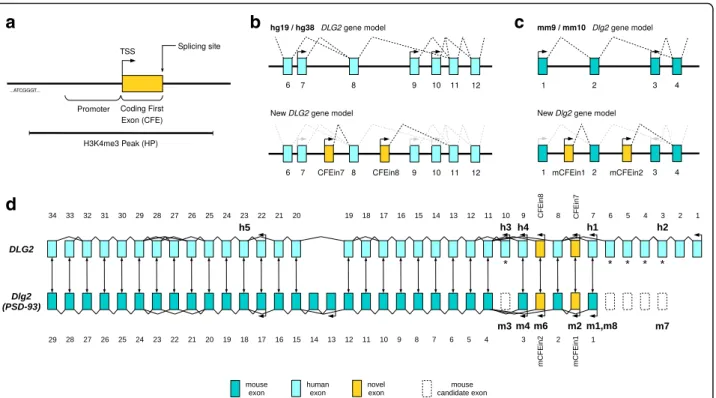
b
c
Fig. 4 DLG2 gene model and exon mapping in mouse and human. a Qualitative graphical representation of H3K4me3 peak (HP), upstream promoter, and coding first exon (CFE). TSS transcription start site. b Two DLG2 gene models using UCSC data: the hg19/hg38 model at the top and the new model integrating our research regarding two novel promoters and coding first exons (CFEin7 and CFEin8) at the bottom. c mm9/mm10 and new Dlg2 models comparison. d DLG2/Dlg2 exon mapping by DNA sequence alignment. Bidirectional arrows between exons represent the best match according to NCBI BLAST. Arrows with tips pointing leftwards show transcription start sites according to UCSC, updated with our results. Bold annotations, such as“h3” and “m8”, mark the beginning of protein isoforms according to UniProtKB/Swiss-Prot, in human (Q15700) and mouse (Q91XM9). Regarding the mouse isoform terminology,“mX” stands for Q91XM9-X and m1, 2, 3, 4, 6, and 7 correspond, respectively, to PSD93-alpha, beta, gamma, delta, epsilon, and zeta. Human exons 3–6 and 10 are annotated with an asterisk because there is evidence (see“Methods” and Additional file 1: Supplementary note 10) that they map to unannotated Dlg2 mouse exons in mm10 reference genomes. Those“missing” murine exons code for “m3” and “m7” protein isoforms, and are depicted with dashed borders. “m5” represents DLG2 isoform “Q91XM9-5” and maps from mouse exon 3 to exon 11 (Additional file 1: Supplementary note 4). It is not included in the figure because no experimental confirmation of its existence is available. In UniProt,“h5” is also reported as not experimentally proven. However, in GTEx (adult brain), it is the most expressed isoform (see ENST00000426717 in Additional file 1: Figure S26). Hence, it is included in the figure
Dlg2gene models (Fig. 4d). The new DLG2 gene model has seven promoters and coding first exons, with respect to the five of the UCSC standard model described in hg19 or hg38 (Fig. 4b, d). Likewise, the new Dlg2 gene model has six promoters and coding first exons rather than the four previously described in mm9 or mm10 (Fig. 4c, d).
Human–mouse DLG2–Dlg2 gene comparison pro-vided additional unexpected results. Using human and mouse reference genomes, we were able to map orthologous exons from one organism to the other in most of the exons but not all (asterisks in Fig. 4d). Human DLG2 exons 1 to 6 and 10 along with mouse
Dlg2 exons 13 and 14 resulted in being “species
spe-cific”. At first, we believed the unmapped exons were the results of gain of functionalities during vertebrate evolution, but our experience with the HP isoforms made us suspicious. A manual examination of the murine protein sequences described in Parker [32] shows that murine exons equivalent to human exons 3 to 6 and exon 10 (asterisks in Fig. 4d) must exist but are entirely missing from mm9 or mm10 reference genome annotations (see “Methods”; Additional file 1: Supplementary note 10).
Concerning the DLG2 7-9 region, our results show that it involves five (instead of three) coding exons, of which four (instead of two) start different DLG2 protein isoforms (Fig. 4b). In the next section, we describe the deletion of these five exons in relation to NDDs.
HPin7 and HPin8 deletions are statistically enriched in NDD patients
A HP exon deletion-based analysis would explain the occurrence of NDD symptoms in 26 out of the 29 (90%) DLG2 patients (Fig. 1). The remaining three have other rare CNVs elsewhere in the genome
(Additional file 1: Tables S7–S10). The number of control patients with affected HPs in the DGV and 1KG cohorts is zero and two, respectively, further suggesting the importance of the HP exons (Additional file 1: Figures S10 and S11, Tables S12 and S13). We there-fore assessed the enrichment of HP deletions in cases over controls via statistical analyses.
One-tailed Fisher’s exact test comparing DECIPHER (case) and DGV (control) populations on the presence of deletions affecting any HPs resulted in a p value of 7.984 × 10−07. The same analysis using exons 7, 8, and 9 resulted in a p value of 6.107 × 10−04, pinpointing a stronger role of the two HPs, rather than the known DLG2exons, as links to NDDs (Figs. 1 and 5).
We validated the clinical importance of HP deletions by performing the equivalent statistical analysis with the independent GDD/ID cohorts [11, 51] (see“Methods”). In the case cohort, 11 deletions affect either HPin7 (7) or HPin8 (4) out of a total of 14 located in the DLG2 7-9 region. In the control cohort, three deletions affect either HPin7 (2) or HPin8 (1) out of a total of 19 located in the DLG2 7-9 region. The statistical analysis results in a p value of 4.501 × 10−04 for deletions affecting any HPs, and a p value of 0.3809 for deletions affecting
exons 7, 8, and 9 (see “Methods”; Additional file 1:
Figures S6–S9). This confirms the statistical enrich-ment of HP deletions in NDD cases, and the stronger role of HP exons with respect to known ones.
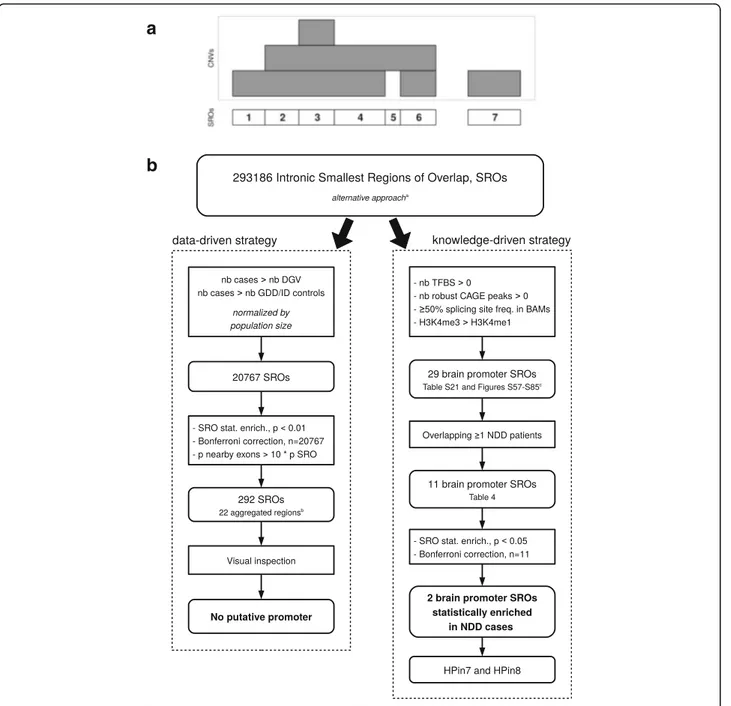
To further validate this result, we performed a third statistical assessment using an unbiased genome-wide approach (Fig. 6; Additional file 1: Figures S86 and S87, and Supplementary notes 1 and 2 for methods and details). We used two methods: a data-driven strategy and a knowledge-driven strategy. The former, based on a
Fig. 5 Number of times each exon is deleted in DLG2 patients’ CNVs. Distribution of CNV deletions from patients in the DLG2 cohort. Red bars represent the number of deletions overlapping the exon in consideration. On the x-axis, the exons that correspond to a transcription start site are reported with a number (shown by arrows)
straightforward patient versus control CNV enrichment ana-lysis, turned out negative. The latter reduced the genome search space according to the presence of four functional characteristics known to be associated with promoters (Fig. 6). This strategy resulted in the prediction of 11 novel promoters and first exons found deleted in intronic regions in NDD patients (Table 4; Additional file 2). Two are statisti-cally enriched in cases versus controls (p < 0.05, after Bonfer-roni correction). They correspond to HPin7 and HPin8. The
knowledge-driven strategy validates, in a third way, the asso-ciation between HP deletions and NDDs.
Collectively, our three statistical analyses show a consistent enrichment of HPin7 and HPin8 deletions in NDD patients (Fig. 7).
Clinical description of the 29-patient DLG2 cohort
Of the 29 patients we found with DLG2 7-9 deletions, 24 have a NDD phenotype (see Fig. 1 and Table 1 for an
a
b
Fig. 6 Genome analysis workflows used to discover novel promoters and first exons statistically associated with NDDs. a The smallest regions of overlap (SRO) definition (see also Additional file 1: Figure S56). b Summary of the whole genome analysis steps used to discover novel promoters and first exons statistically associated with NDDs. DECIPHER and GDD/ID cases are aggregated. The control cohorts are kept separate under the alternative approach (Additional file 1: Supplementary note 2). The four cohorts were used to define the SROs.aAdditional file 1: Supplementary note 2.
b
overview, and Additional file 1: Tables S7–S11 for a detailed description). The most common phenotypes are cognitive disabilities (mainly GDD/ID, 16 patients), followed by behavioral anomalies (ASD or ADHD, 10 patients) and psychiatric disorders (mainly schizophre-nia, nine patients). The least-represented NDD pheno-type is epilepsy with only one case. NDDs have been assessed for gender and heredity bias, classically describ-ing a sex bias skewed towards boys with ID and
maternally inherited CNV events [72–74]. Of the 24 NDD patients having aberrations in the DLG2 gene, 11 are males and three females (ten unknown). Among them, the two ULB patients are males with aberrations inherited from asymptomatic mothers.
Discussion
Although DLG2 has been linked to psychiatric disorders [44, 46–49], our work now describes a cohort of patients
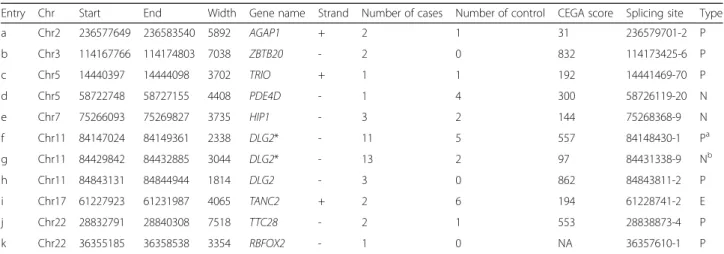
Table 4 Intronic regions harboring putative novel promoters found deleted in NDD patients
Entry Chr Start End Width Gene name Strand Number of cases Number of control CEGA score Splicing site Type
a Chr2 236577649 236583540 5892 AGAP1 + 2 1 31 236579701-2 P b Chr3 114167766 114174803 7038 ZBTB20 - 2 0 832 114173425-6 P c Chr5 14440397 14444098 3702 TRIO + 1 1 192 14441469-70 P d Chr5 58722748 58727155 4408 PDE4D - 1 4 300 58726119-20 N e Chr7 75266093 75269827 3735 HIP1 - 3 2 144 75268368-9 N f Chr11 84147024 84149361 2338 DLG2* - 11 5 557 84148430-1 Pa g Chr11 84429842 84432885 3044 DLG2* - 13 2 97 84431338-9 Nb h Chr11 84843131 84844944 1814 DLG2 - 3 0 862 84843811-2 P i Chr17 61227923 61231987 4065 TANC2 + 2 6 194 61228741-2 E j Chr22 28832791 28840308 7518 TTC28 - 2 1 553 28838873-4 P k Chr22 36355185 36358538 3354 RBFOX2 - 1 0 NA 36357610-1 P
Each row details an intronic H3K4me3 peak region overlapping any smallest region of overlap (SRO) meeting the following criteria: deleted in at least one case individual and demonstrating the presence of both transcription factor binding sites and CAGE peaks, of a H3K4me3/H3K4me1 peak ratio greater than 1, and of at least one abrupt RNA-Seq delta coverage of 20. We provide the name of the gene the intron belongs to, the number of case and control patients (sum of DGV and GDD/ID) found in the cohorts, and the exact location of the splicing site. The asterisk next to the gene name represents a significant statistical enrichment
after Bonferroni correction of NDD patients in such region with p < 0.05 (see“Results”; Additional file2).“CEGA score” documents the conservation score across
vertebrates as reported in the Conserved Elements from Genomics Alignments database [63]. The“Type” column reports whether such a region is predicted as
promoter (P) or exon (E) by Ensembl (archive 75, Feb 2014) or as novel (N). Coordinates are in hg19 a
This region corresponds to HPin8 b
This region corresponds to HPin7
Fig. 7 The main steps and results of the research. Summary of the high-level steps and main outcomes of the research described in this paper. HPin7 H3K4me3 peak in DLG2 intron 7, HPin8 H3K4me3 peak in DLG2 intron 8, HP either HPin7 or HPin8, HPs both HPin7 and HPin8, CFE coding first exon, NDD neurodevelopmental disorder
with DLG2 deletions who present three phenotypic cat-egories of NDDs: cognitive, behavioral, and psychiatric. Such broad NDD involvement of DLG2 is somewhat expected for a gene known to play an important role in the development, plasticity, and stability of synapses [3, 31–33, 43]. Concerning learning and memory, it is interesting to note that Dlg2 (PSD-93) mouse knock-outs have defects in long-term potentiation of hippocampal neurons [75] and have been shown to be impaired in complex learning, cognitive flexibility, and attention [44]. Defects in cognitive flexibility can evoke ASD endopheno-types [44]. In the past, a hypothetical link was proposed between autism genes and DLG2 through a PI3K synaptic pathway [76]. Also, while patients in the DLG2 cohort have cognitive, behavioral, or psychiatric disorders, re-markably only one out of 29 has an epilepsy phenotype, suggesting this neurodevelopmental phenotype is less often associated with DLG2 deletion. Epilepsy has scarcely been studied with reference to DLG proteins, and mostly with reference to DLG4 (PSD-95 in mouse) [77, 78]. DLG1, DLG3, or DLG4 are not known as human epilepsy genes. Identically, DLG2 has never been linked to epilepsy except for anecdotal reports [79–81].
The higher amount of male than female patients in the DLG2 cohort (13 male to five female and 11 un-known out of 29; Table 1), with a penetrant NDD phenotype (11 to three and ten unknown out of 24), with a single rare CNV (five to one and three unknown out of nine), and harboring a maternally inherited aber-ration in DLG2 (three to 0 and one unknown out of four) supports the NDD female protective hypothesis studied in other cohorts [72–74]. In addition to being more penetrant in males, the transmission of DLG2 7-9 deletions from clinically asymptomatic parents suggests incomplete penetrance. Such incompleteness is expected for inherited CNVs in NDDs [82, 83]. Two patients (GC33254, GC43330) having DLG2 deletions and another relevant CNV cited in Sahoo et al. [84] also corroborate the additive burden“two-hit” hypothesis for risk factor CNVs in NDDs [82, 85]. Collectively, these data suggest that DLG2 7-9 deletions overlapping HPin7 and HPin8 are NDD risk factor CNVs. Larger case and control populations will help to determine their exact level of phenotypic penetrance. Note that very mild penetrance of any NDD risk factor CNV could be the norm [7, 13].
In the recent version of DECIPHER (December 2016) and the Signature Genomic Laboratories dataset [84], we found ten additional patients (Additional file 1: Supplementary note 9). Nine have a deletion in the
DLG2 7-9 region and one is lacking exon 6 and entry
“h” in Table 4. Eight have lost at least one CFE, and five have lost at least one of exon 7, 8, or 9. Six have a described NDD phenotype, four with a CFE deletion.
Two patients with CFE deletions have no clinical infor-mation. This further suggests that the new fetal brain CFE coding isoforms described in the present work are crucial elements for the NDD phenotypes associated with DLG2 deletions. It also leaves open the possibility that other DLG2 exons may contribute to NDD pheno-type penetrance.
Analyzing the DLG2 cohort, we found that the mechanistic system explaining the NDD phenotypes was the loss of two new human promoters and coding first exons, CFEin7 and CFEin8. They code for the orthologous isoforms of murine PSD-93 beta and epsilon protein isoforms. Understanding in vivo their developmental role should provide useful knowledge to link tissue-specific expression of DLG protein isoforms and NDD development.
The comparison between human and mouse DLG2/
Dlg2 genes revealed a significant lack of
cross-annotation in both reference genomes. For example,
DLG2 human exons 1–6 and 10 are unmapped to any
mouse exons while these murine exons should exist. Because of the human–mouse genetic overlap and evolutionarily conserved properties, we expect that, as we already manually did for DLG2, an automated cross-species annotation analysis of DNA and protein information from UCSC, NCBI BLAST, and UniProtKB/ Swiss-Prot databases will disclose novel exons in other genes.
Classic data-driven strategies study the enrichment in patients compared to controls one region at a time. Such univariate analysis is limited in detecting the possible complexity of NDDs. Here, a multivariate assessment was performed for the DLG2 HPin7 and HPin8 statistical ana-lysis, helping to reveal the importance of both regions. With accumulation of data and patients, multivariate data-driven analysis might become more relevant in deci-phering NDDs.
In this work, we investigated NDD phenotypes, but the same methodology can be applied for other diseases of interest. Moreover, while the present work is focused on CNV data, using additional functional annotations, types of variant, and more sensitive whole genome sequencing analysis would be a logical development.
Conclusions
Our work demonstrates the key importance of two new DLG2 promoters and coding first exons for their associ-ation with neurodevelopmental phenotypes. It expands the DLG2 NDD phenotypic spectrum to intellectual disability (GDD/ID, language delay) and behavioral dis-orders (ASD, ADHD). Through our manual investigation of DLG2/Dlg2 exon mapping, it unveiled the lack of
reference genomes and between nucleotide and protein databases. Our study also emphasizes the importance of tissue-specific integrative studies along the developmen-tal timeline to further explain developmendevelopmen-tal disorders. Additional files
Additional file 1: Supplementary figures and tables. (PDF 10077 kb) Additional file 2: Knowledge-driven analysis results. (XLSX 13 kb)
Abbreviations
ADHD:Attention deficit hyperactivity disorder; ASD: Autism spectrum disorder; CAGE: Cap analysis gene expression; CEGA: Conserved Elements from Genomics Alignments; CFE: Coding first exon; CGH: Complete genomic hybridization; CNV: Copy number variation; DECIPHER: Database of Chromosomal Imbalance and Phenotype in Humans Using Ensembl Resources; DGV: Database of Genomic Variants; EST: Expressed sequence tag; GDD: Global developmental delay; HP: H3K4me3 peak; HUDERF: Hôpital Universitaire Des Enfants Reine Fabiola; ID: Intellectual disability; IGV: Integrative Genome Viewer; NDD: Neurodevelopmental disorder; NPC: Neuronal progenitor cultured cell; PSD: Postsynaptic density; ULB: Université Libre de Bruxelles; WPPSI-R: Wechsler Preschool and Primary Scale of Intelligence
Acknowledgements
CR and GS thank Prof. Philippe Lepage and Prof. Pierre Smeesters for their support of this work. This study makes use of data generated by the DECIPHER Consortium. A full list of centers who contributed to the generation of the data is available from http://decipher.sanger.ac.uk and via email from [email protected]. Funding for the project was provided by the Wellcome Trust.
Funding
The Belgian Kids’ Fund (to CR). Brussels Institute for Research and Innovation (Innoviris) through the project BridgeIris (RBC/13-PFS EH-11) (to CR, TL, MA, GB). Fonds Jean Van Damme, Erasme Fund for Medical Research, and by the E-Rare grant EuroMicro (to MA). The Action de Recherche Concertée (ARC) of the Fédération Wallonie Bruxelles, Belgium, Brussels Region (to MA, CV). Fond Lippens (to CV). Fonds IRIS-Recherche (to CV, GS). The funders had no involvement in the study design, data collection, data analysis, and writing of the report.
Availability of data and materials
The partial deletions of DLG2 in patients 1 and 2 are publicly available in the DECIPHER database. Patient 1 has been assigned the DECIPHER id 317136 and patient 2 the DECIPHER id 317185. The CFEin7 coding DNA sequence is registered in GenBank with reference KY368395. The CFEin8 coding DNA sequence is registered in GenBank with reference KY368394. The mCFEin1 coding DNA sequence is registered in GenBank with reference KY368397. The mCFEin2 coding DNA sequence is registered in GenBank with reference KY368396.
Authors’ contributions
Conception and design: CR, GB, CV, ND, GS. Analysis: CR, CV, ND, GS. Interpretation of data: CR, GB, CV, ND, GS. Acquisition of data: CR, SC, TS, ID, BP, NL, CV, ND, GS. Wrote the paper: CR, SC, CV, ND, GS. Contributed samples/ materials/tools/resources: CR, SC, TS, BP, MCA, EFB, MCD, FF, GBF, MG, BI, SJ, FNB, MDP, FP, AR, SR, AT, JRV, TL, GC, MA, GB, CV, ND, GS. The three second authors (SC, TS, ID) contributed equally to this work. The four last authors (GB, CV, ND, GS) contributed equally to this work. Read the manuscript: all authors. Critical revision: CR, ID, MA, GB, CV, ND, GS. Final approval: all authors.
Ethics approval and consent to participate
All studies involved in this research received institutional review board approvals. Samples of patient 1 (DECIPHER 317136) and patient 2 (DECIPHER 317185), along with parent’s samples, were obtained and handled in agreement with the guidelines set out by the Université Libre de Bruxelles (ULB) hospital ethics committees. Written informed consent was obtained from parents of both patients (Comité d’éthique de l’Hôpital Erasme - ULB: reference Q2015/003).
Research conformed to the Declaration of Helsinki. We comply with the data access and sharing agreement for DECIPHER.
Consent for publication
The parents of patients 1 and 2 have provided consent to publish the clinical and genomic details presented.
Competing interests
The authors declare that they have no competing interests.
Publisher’s Note
Springer Nature remains neutral with regard to jurisdictional claims in published maps and institutional affiliations.
Author details
1
Interuniversity Institute of Bioinformatics in Brussels ULB-VUB, Brussels 1050, Belgium.2Machine Learning Group, Université Libre de Bruxelles, Brussels
1050, Belgium.3Department of Neurology, Hôpital Erasme, Université Libre
de Bruxelles, Brussels 1070, Belgium.4Neuropediatrics, Hôpital Universitaire
des Enfants Reine Fabiola, Université Libre de Bruxelles, Brussels 1020, Belgium.5Faculté de Médecine, Université Libre de Bruxelles, Brussels 1070,
Belgium.6ULB Center of Medical Genetics, Hôpital Erasme, Université Libre
de Bruxelles, Brussels 1070, Belgium.7Service de Médecine Génétique, Centre
Hospitalier Universitaire Vaudois CHUV, Lausanne 1011, Switzerland.
8Department of Public Health and Pediatrics, University of Torino, Turin
10126, Italy.9Medical Genetics, Bambino Gesù Pediatric Hospital, Rome
00165, Italy.10S.C. Medical Genetics, Institute for Maternal and Child Health
-IRCCS“Burlo Garofolo”, Trieste 34137, Italy.11Laboratory of Medical Genetics, CHU de Caen - Hôpital Clémenceau, Caen, 14033 Caen Cedex, France.
12Service de Génétique Médicale, CHU de Nantes, Nantes, 44093 Nantes
Cedex 1, France.13West of Scotland Clinical Genetics Service, South Glasgow
University Hospitals, Glasgow G51 4TF, UK.14Service de Génétique, CHRU de Lille - Hôpital Jeanne de Flandre, Lille 59000, France.15Medical Genetics,
University of Siena, Siena 53100, Italy.16Genetica Medica, Azienda
Ospedaliera Universitaria Senese, Siena 53100, Italy.17Service d’Histologie
Embryologie Cytogénétique, Hôpital Necker Enfants Malades, Paris 75015, France.18Université Paris Descartes - Institut IMAGINE, Paris 75015, France. 19Department of Clinical Pathology and Genetics, Sahlgrenska University
Hospital, Gothenburg 413 45, Sweden.20Department of Human Genetics,
University of Leuven, Leuven 3000, Belgium.21AI lab, Vrije Universiteit Brussel, Brussels 1050, Belgium.22Pediatrics, Hôpital Universitaire des Enfants Reine
Fabiola, Université Libre de Bruxelles, Brussels 1020, Belgium.23Genetics,
Hôpital Universitaire des Enfants Reine Fabiola, Université Libre de Bruxelles, Brussels 1020, Belgium.24Present address: Neuropediatrics, Clinique Saint-Anne Saint-Rémy - CHIREC, Brussels 1070, Belgium.25Present address:
Assisted Fertilization Department, Casa di Cura Città di Udine, Udine 33100, Italy.
Received: 16 January 2017 Accepted: 20 June 2017
References
1. Hoischen A, Krumm N, Eichler EE. Prioritization of neurodevelopmental disease genes by discovery of new mutations. Nat Neurosci. 2014;17:764–72. 2. Li J, Cai T, Jiang Y, Chen H, He X, Chen C, et al. Genes with de novo
mutations are shared by four neuropsychiatric disorders discovered from NPdenovo database. Mol Psychiatry. 2015;21:290–7.
3. Marín O. Developmental timing and critical windows for the treatment of psychiatric disorders. Nat Med. 2016;22:1229–38.
4. O’Donovan MC, Owen MJ. The implications of the shared genetics of psychiatric disorders. Nat Med. 2016;22:1214–9.
5. Bourgeron T. From the genetic architecture to synaptic plasticity in autism spectrum disorder. Nat Rev Neurosci. 2015;16:551–63.
6. Gandal MJ, Leppa V, Won H, Parikshak NN, Geschwind DH. The road to precision psychiatry: translating genetics into disease mechanisms. Nat Neurosci. 2016;19:1397–407.
7. Finucane B, Challman TD, Martin CL, Ledbetter DH. Shift happens: family background influences clinical variability in genetic neurodevelopmental disorders. Genet Med. 2015;18:302–4.
8. Moeschler JB, Shevell M. Comprehensive evaluation of the child with intellectual disability or global developmental delays. Pediatrics. 2014;134:e903–18.